What Is Fiscal Burden?

Fiscal burden is a measure of the financial resources commanded by state and local governments. The most common measures are government spending levels and the tax burden. Those measures are included here. Yet, while other comparative studies of state fiscal policy might measure these in some form or another, those studies often tend to address tax burdens and spending burdens separately.

This index combines them all into one category named “Fiscal Burden,” a decision influenced by a key insight from Nobel Prize–winning economist Milton Friedman: “The true cost of government to the public is not measured by explicit taxes but by government spending.”

Notably, this index does not claim (nor would Friedman) that taxes do not matter. Indeed, the form taxes take can be deeply harmful to a state’s economic growth and ability to attract investment capital and population. That’s the reason tax policy, not just tax burdens, are measured here. Yet government debt matters too, as government bonded-debt levels are essentially future taxes and claims on yet-to-be-created wealth for the political benefit of voters in the present.

Including debt ensures that the rankings do not advantage a state that cuts taxes without cutting spending. Furthermore, a state that generates the minimum revenues necessary (i.e., a low tax burden) to undertake only the most necessary government functions may do so through a growth-restraining tax code, even if the state never has to issue debt.

So, “Freedom in the 50 States” addresses all of these aspects, grouping compatible measures of fiscal burden into a single category. It includes how much tax revenue is collected, the form those taxes take, how much of that money is spent by the government, how much it competes with private labor markets through government employment, and how much debt the government issues in the form of general obligation bonds. This ranking therefore provides a more complete picture than narrower assessments of the overall claims that a state government places on the private sector, both now and in the future.
State Ranks and Grades

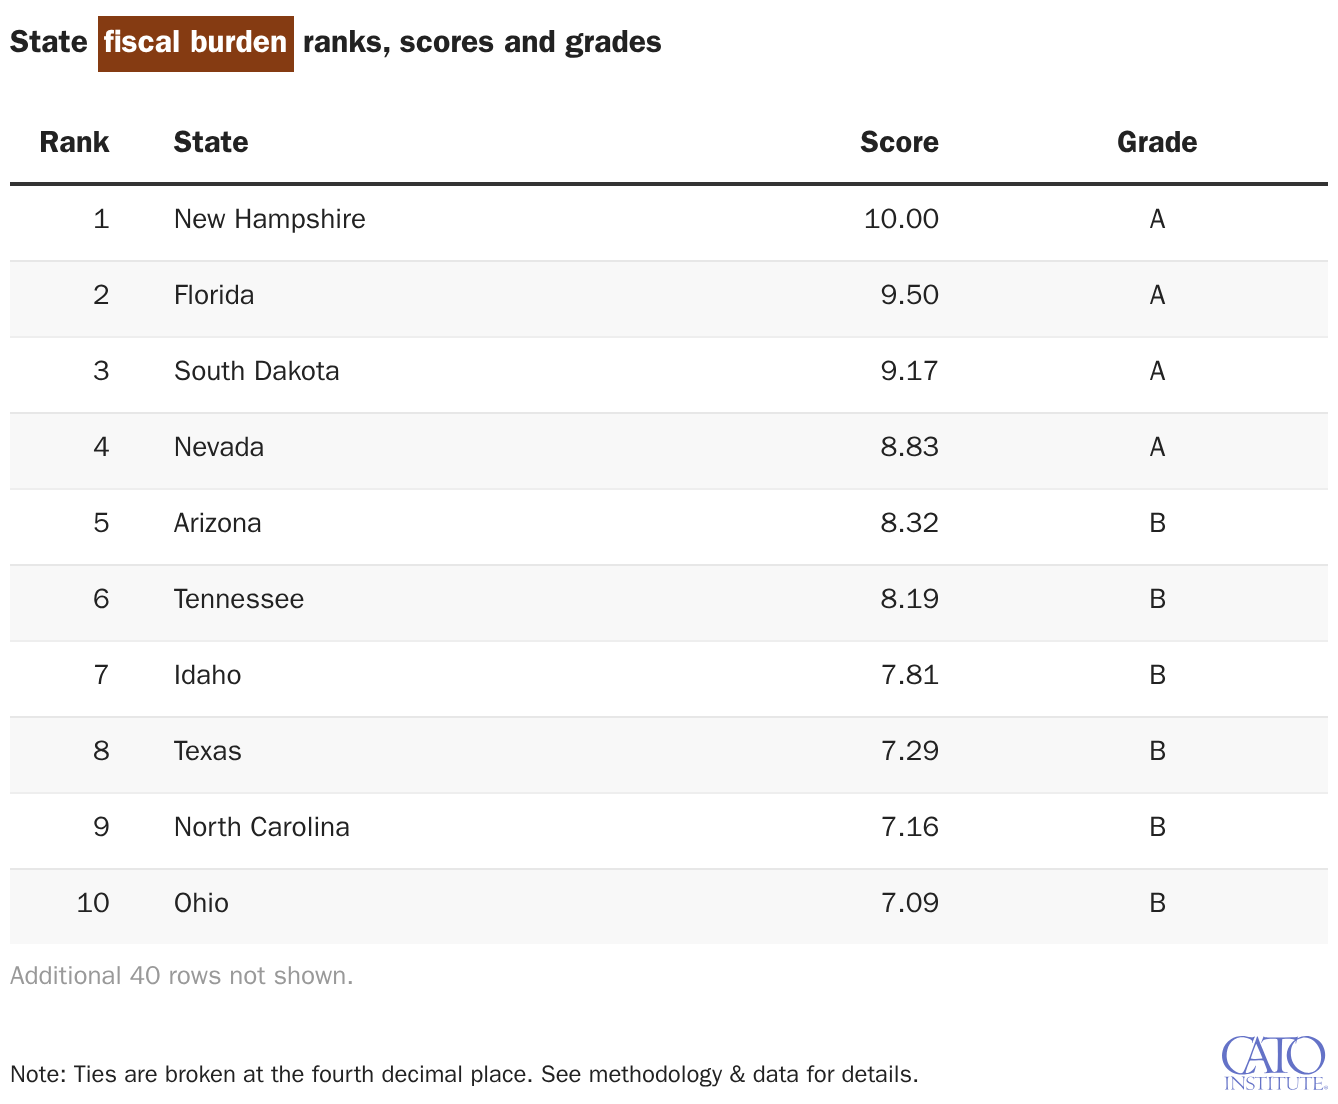
State fiscal burden ranks, scores and grades

Four states receive an A in the Fiscal Burden category (listed from highest to lowest score): New Hampshire, Florida, South Dakota, and Nevada. Each exhibits low tax and spending burdens, does not have an income tax, and generally has below-average levels of debt and government employment.

On the other end of the spectrum, 12 states receive an F (listed from highest to lowest score): Kansas, New Jersey, Minnesota, Maryland, Delaware, Oregon, Vermont, West Virginia, California, New Mexico, New York, and Hawaii. They all have comparatively higher-than-average tax and spending burdens and maintain high top income-tax rates.

Alaska is a unique case in which a state with no income tax receives a nearly failing grade (the lowest-scoring D). That is because most of Alaska’s high level of government spending is financed by severance taxes on oil and gas exploration, which accounts for the lion’s share of the state government revenue. In other words, Alaska effectively exports most of its tax burden. Yet the state also maintains a much higher-than-average debt burden and government payroll, both of which materially contribute to the overall poor grade.

Governor Ranks and Grades

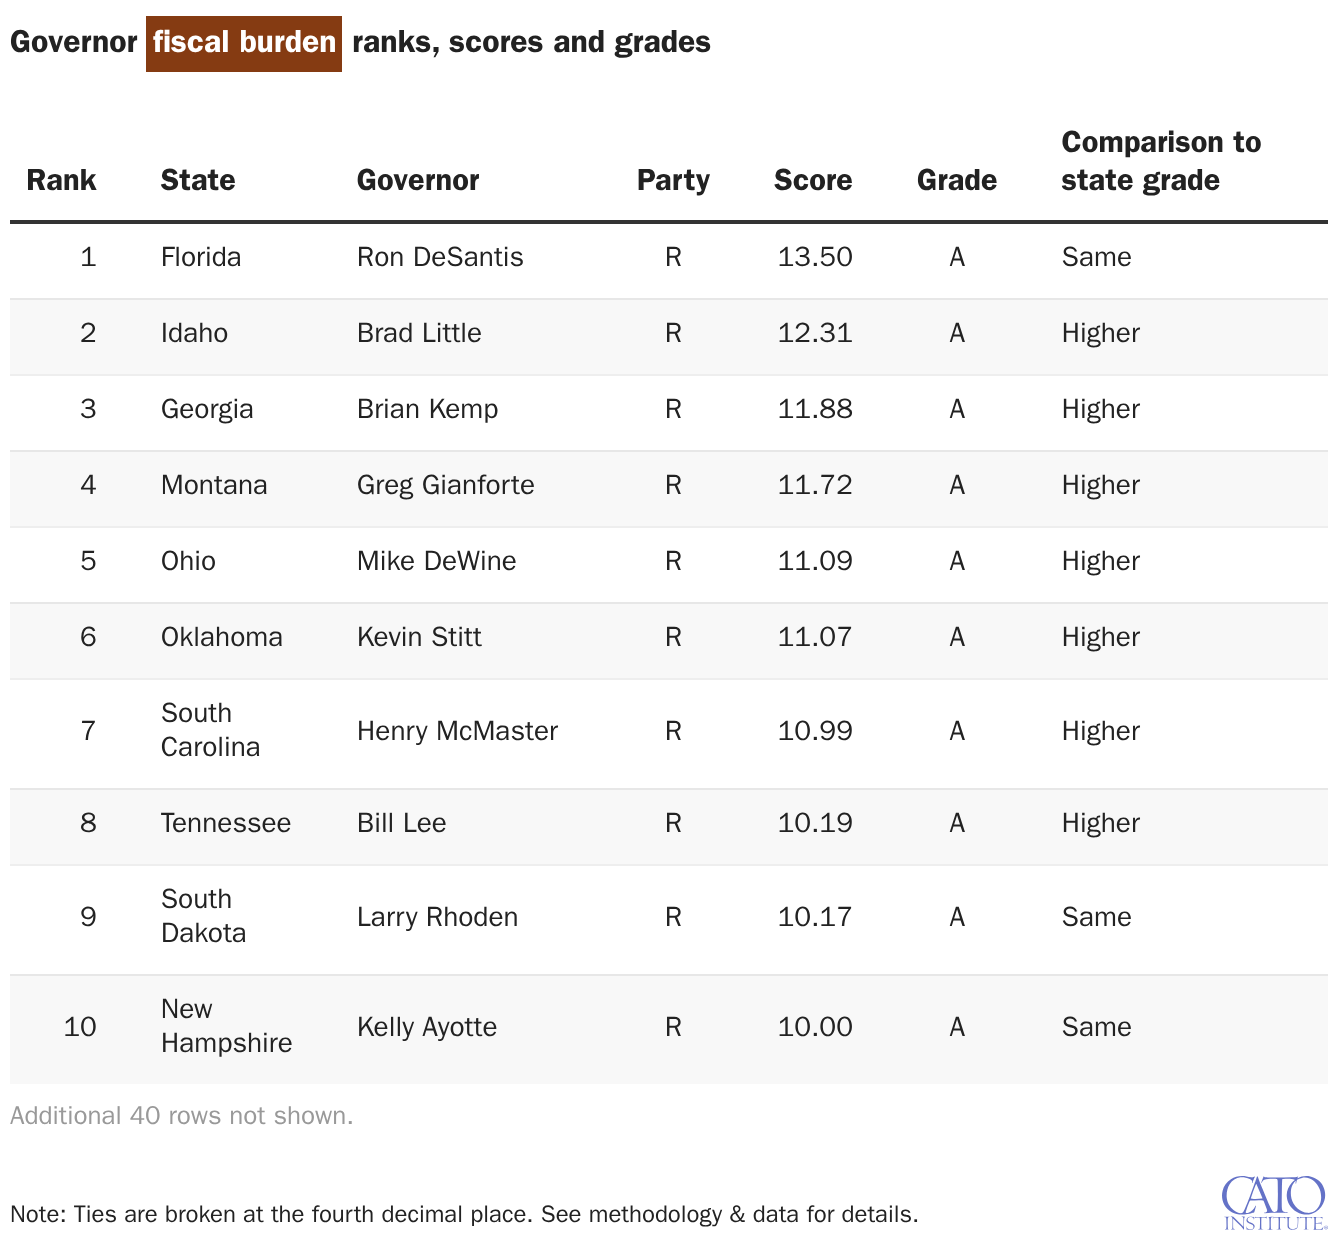
Governor fiscal burden ranks, scores and grades

As a result of the substantial tax cutting that has occurred since state budgets have stabilized after the pandemic’s uncertainty, 16 governors receive A grades. Fifteen of them are Republicans; the sole Democrat among them is Jared Polis of Colorado.

There are a few standouts among the A‑graded governors: Idaho’s Brad Little, Georgia’s Brian Kemp, and Montana’s Greg Gianforte managed to substantially cut taxes (particularly the income tax) while also proposing net budget cuts (on average) over the past few years. All three governors receive grades higher than their respective states, and the states they govern would have had a lower rank if not for the actions of their governor and state legislature.

Seventeen governors receive an F. Most of them are governors of states that also receive a failing grade, and each governor’s tenure has done nothing to help increase their state’s grade.

Two failing governors who scored lower than their respective state—Washington’s Bob Ferguson and Maine’s Janet Mills—both supported the creation of a new top income-tax bracket intended to hit high earners above a $1 million income threshold. In the case of Ferguson, his state of Washington would have had a substantially better grade than it actually receives in this report (D) had it not been for his push to create this high-earner income tax, particularly as it now diminishes the state’s reputation as being devoid of most types of income taxes. (Although this income tax won’t be enforced until 2029—and there is currently litigation over its constitutionality as well as a ballot initiative to overturn it—it is included here because of its significance in Ferguson’s tenure as governor so far and because there is ample anecdotal evidence that this tax and local taxes like it are already influencing the decision of investors and employers to move out of the state.)

How Is Fiscal Burden Measured?

The category consists of nine measures grouped into the following five categories:

  • Government spending (two variables)
  • Government employment (one variable)
  • Tax burden (two variables)
  • Income tax policy (two variables)
  • Government debt (two variables)

Government Spending

This group consists of two variables that measure spending by government relative to statewide personal income, a measure of the size of the state economy. The data on income come from the Bureau of Economic Analysis.

The first variable is an average of total state general fund spending for FY 2024 and FY 2025 (the prior two full fiscal years) as a percentage of statewide personal income. The data on general fund budget levels come from the National Association of State Budget Officers as well as various official budget documents from each state. This variable measures the spending that the state governor and legislature most directly control each legislative session: the state budget that is financed by state tax revenue and debt, excluding federal transfers.

The second variable is total state and local direct expenditure as a percentage of statewide personal income. The data for these expenditures come from the Census Bureau; the most recent year available is 2023. This measure includes local government spending because, although “Freedom in the 50 States” is a state ranking, local conditions are integrated into some variables. (Housing policy is another example.) There are two reasons for this. The first is that people pay taxes to both the local government under which they live as well as their state government. To exclude these local government spending burdens would unnecessarily limit the measure of the overall scope of government in a state. Secondly, state governments sometimes delegate functions to local governments or assume functions that are typically in the purview of local governments elsewhere. As a result, not including both could either artificially boost or decrease the rank of a state.

For grading the governors, proposed spending levels as a percentage of personal income for each fiscal year are compared to the actual spending levels, all as reported by the National Association of State Budget Officers and the official budget submissions from each governor. Governors who proposed less in relation to actual spending receive additional points in relation to the average percentage difference. Governors who proposed more spending receive point deductions using the same standard.

Government Employment

This group consists of one variable: full-time equivalent (FTE) employees of state and local government as a percentage of total non-farm payroll. The data for FTE employment come from the Census Bureau; the non-farm employment numbers come from the Bureau of Labor Statistics. Both are for calendar year 2025.

Although a core of government employment is necessary for all levels of government to carry out legitimate government functions, an excess of employment beyond those functions indicates an unnecessarily large government sector. Government displacement of private-sector jobs might be viewed as a labor market issue (which could have also been a comfortable fit within the Occupational Freedom section), but it is also closely tied to the revenue demands of government. In addition, it is also one of the largest components of government growth on which a legislature or governor (but mostly the latter) can have the most direct impact—through furloughs and hiring freezes, for instance.

Governors are graded on the change in FTE employment relative to the overall growth in the labor force in their state. Governors who presided over declines receive additional points, and those who presided over an increase receive deductions.

Tax Burden

This group consists of two variables that measure the amount of tax revenue taken in by government relative to statewide personal income. The data on income come from the Bureau of Economic Analysis.

The first variable is an average of total state revenue for 2025 as a percentage of statewide personal income. The data on revenue levels come from the Census Bureau and are the revenue analog of general fund expenditure measure in the Government Spending group. The revenue measured here is considered “own-source” tax revenue—generated from taxes such as sales taxes and income taxes—which excludes revenue from severance taxes on natural resources and gas and oil extraction.

The second variable is state and local combined tax revenue for 2023 (the most recent available year) from the Census Bureau. This is the revenue analog of the Census-based state and local expenditure measure in the Government Spending group, and this one is also expressed as a percentage of personal income. The same rationale applies here: Although state taxes are the ones that state policymakers have the most direct control over, someone living in a state would be paying taxes to a local government too, and sometimes the state taxes they pay filter back to the local government. As before, to provide a more comprehensive fiscal measure of tax burden, both levels of government are included here.

To grade governors on tax burdens, data from both the National Association of State Budget Officers and their official budget proposals are used. They are graded on average annual proposed or enacted revenue decreases or increases as a percentage of total revenue collections for each fiscal year they are in office from 2023 through 2027. The revenue proposals reflect officially proposed permanent changes in all major taxes, not temporary changes such as rebates or sales tax holidays, or tax credits intended to subsidize specific activities.

Income Tax Policy

This group consists of two variables that are designed to measure specific attributes of the state’s income tax or to indicate the absence of an income tax. The data on which this group is based come from the National Association of State Budget Officers and the Tax Foundation.

The first variable is the top marginal income-tax rate of a state. (If a state does not have an income tax, it automatically receives the highest score of 10.) The second variable is a simple count of the number of state income-tax brackets.

These two variables together are intended to measure the degree to which income is taxed differently as someone becomes wealthier (the “progressivity” of the tax code). States that have the highest rates and the most brackets will score the lowest, based on the logic that a steeply progressive tax system that further penalizes each subsequent increment of income growth inhibits economic freedom more than a system with fewer brackets and lower rates. Therefore, in this measure, states that have a single, flat, low income-tax rate will score among the highest. The only perfect scores for these variables are given to the states that do not have an income tax.

Governors are graded on their proposed, supported, and enacted top income-tax rate changes during their tenure to date. The number of points awarded or deducted are based on how the change in the rate did or would change the income-tax policy score of their state. Vetoes that are overturned are not counted against a governor. Voter-approved tax changes that were actively supported by the governor are included in a governor’s point calculation.

Government Debt

This group consists of two variables, one representing the state and one representing all local governments. Each is the dollar amount (based on Census data) of the long-term bonded debt of that level of government for 2023 (in terms of $1K of personal income). This group is intended to measure the general debt obligations of all levels of government. Because it is a broad measure of “full faith and credit” debt, it represents a government claim on future private-sector income if government spending continues to grow in the event of revenue declines—whether that be due to changes in policy, an unwillingness to cut government spending, adverse economic conditions, or a combination of any of those. Like the state and local revenue and spending measures above, including both variables helps paint a complete picture, particularly in cases where a state takes over funding responsibility from a local government for a specific government program or vice versa. (Governors are not specifically graded on debt changes due to the lag in the available data on debt levels.)