Last month, Secretary of Defense James Mattis urged Congress to allow the Pentagon to reduce its excess overhead. Mattis has requested this authority before — as have at least four of his predecessors (Carter, Panetta, Hagel and Gates) — but the latest request accompanies a new Pentagon report that assesses the military’s infrastructure needs based on a much larger force structure than the one it has today. Even if the military, and especially the Army, were to grow back to the levels seen when the United States was actively fighting wars in both Afghanistan and Iraq (2012), the DoD is carrying 19 percent excess capacity. Such waste clearly impacts military effectiveness. As Mattis explained in a letter accompanying the report, “every unnecessary facility we maintain requires us to cut capabilities elsewhere.” Although the leading Democrat on the House Armed Services Committee, Adam Smith (D‑WA), and a handful of other lawmakers, agree with Mattis’s assessment, and would allow the Pentagon to cut such obviously wasteful spending, many others in Congress remain opposed to a new round of base closures. Kay Granger (R‑TX), chairwoman of the House Appropriations Subcommittee on Defense said in May that she had “never seen [BRAC] save much money.” Sen. Jim Inhofe (R‑OK) called plans for base closure “disappointing” and “dangerous.” “Clearly, base closure rounds,” Inhofe wrote in September, “cost the American taxpayers an exorbitant amount of money upfront and take years to recoup the initial investment.” This is incorrect. The closure of hundreds of unnecessary military bases in five successive BRAC rounds have saved American taxpayers billions of dollars. Even the much-maligned fifth and final BRAC round, initiated in 2005, is expected to deliver net savings in 2018. Secretary Mattis explained in testimony before the Senate Armed Services Committee in June that a “properly focused base closure effort” could generate $2 billion or more annually. But we shouldn’t assess the benefits of base closures solely on the basis of possible savings to the Department of Defense; that amounts to looking through the wrong end of the telescope. Although BRAC does generate real savings, the greater economic benefits accrue to communities near affected bases when they put underutilized facilities to more productive uses. In that sense, military bases aren’t closed, they’re opened. I visited such a place on Wednesday: the former Glenview Naval Air Station, about 20 miles northwest of Chicago. During World War II, the Navy trained pilots to land on aircraft carriers, in this case two converted passenger steamers on Lake Michigan. The Navy didn’t have actual aircraft carriers to spare. More than 17,000 naval aviators underwent training at Glenview, including George H.W. Bush. But the naval air station was included in the 1993 BRAC list, and Glenview took charge of clearing some 1100 acres, funded infrastructure improvements, and subdivided and sold parcels to private developers. About 400 acres were preserved as open space and parkland. To the untrained eye, few would realize that there was ever a naval base here. I’ve been aware of Glenview for years, even though I had never visited before. I knew what to look for. The street names betray the area’s storied past. Independence and Constitution Avenues are pretty common, and one even encounters the occasional Patriot Boulevard. But one doesn’t often find Nimitz Drive, Kitty Hawk Lane, or Admiral Court in a typical American subdivision. The beautiful homes, many with three-car garages, and backing to golf courses and open space, command top dollar on the real estate market. A review of a few of the listings for the houses with For Sale signs on their front lawns found asking prices between $760,000 and $875,000. Phoebe Co, a realtor with Berkshire Hathaway, explained that condos in the area go for as low as $300,000, but some of the newer townhomes sell for $800,000 or more. Single family homes selling for more than $1 million are not atypical. Glenview is a coveted location not merely for its pleasant neighborhoods, and ample green space with bike and walking paths. It is also in close proximity to the headquarters of a number of Fortune 500 companies (we drove past Allstate’s sprawling campus on the way back to O’Hare), and an easy commute to downtown Chicago — about 40 minutes by train during rush hour. The centerpiece of Glenview’s redevelopment of the former base property is The Glen Town Center, which includes retail shops at street level, and apartments above them for rent. These properties are ringed by attractive brick rowhomes. Here one finds the most visible remaining remnant of the former base: the air station’s control tower is now home to a Dick’s Sporting Goods, a Carter’s children clothing store, and a Von Maur department store. Three statues – a pilot, a sailor, and a ground crewman – stand around a fountain across the street. Painted plaques by the store fronts celebrate the many units that served at the base. Jeanne Fields, assistant property manager for the Aloft apartments, explained that renters value the convenience of living so close to shopping and dining. The Glen is “very unique,” Fields said. “You don’t usually have urban style living in the suburbs.” People who want city living without the city can get it at The Glen. And they’re willing to pay: rentals start at $1600 for a 1 bedroom, and go as high as $5000 for the largest two-bedroom unit. Fields reported that more than 90 percent of the units are currently occupied. I strolled around The Glen with my colleague Harrison Moar, stopped in at the ubiquitous Starbucks, and ate lunch at the Yard House (allegedly home of the “World’s Largest Selection of Draft Beers”). The sprawling restaurant can accommodate 250 diners, and seemed surprisingly busy for a Tuesday at Noon. The many families with young children probably weren’t there for the 100+ beers on tap, but Harrison and I might have tried one. Alex at the front told us that this was a pretty typical lunchtime crowd, and that the restaurant was even busier later in the week, and on weekends. Those who believe that base closures will devastate a local economy need to be aware of cases like Glenview (and Philadelphia, and San Francisco, and San Antonio, and Brunswick). To be sure, some places will take longer to recover (e.g. Brooklyn), and a few might never see economic activity comparable to when the nearby bases boomed (e.g. Limestone, Maine). But those who would keep unnecessary military bases open in order to shield local communities from the possible negative economic impacts are saying, in effect, that their parochial concerns should outweigh the needs of the nation. And elected officials who doubt that their base will ever be successfully converted betray a curious lack of faith in their own constituents’ ability to make productive use of valuable real estate.
Cato at Liberty
Cato at Liberty
Student protesters at the College of William and Mary recently shut down a campus speaker from the ACLU invited (ironically) to speak about “Students and the First Amendment.” Students explained their shut down was in retaliation for the ACLU’s defense of white nationalists’ free speech rights in Charlottesville, Virginia where a white nationalist rally recently took place. What motivated the students?
The Black Lives Matter of William and Mary student group wrote on their Facebook page, where they live-streamed their shut down of the event: “We want to reaffirm our position of zero tolerance for white supremacy no matter what form it decides to masquerade in.” From these students’ perspective, the ACLU supporting someone’s right to say racist things was as bad as being a racist organization.
The Cato 2017 Free Speech and Tolerance Survey helps shed light on these students’ reasoning. First, nearly half (49%) of current college and graduate students believe that “supporting someone’s right to say racist things is as bad as holding racist views yourself.” This share rises to nearly two-thirds among African Americans (65%) and Latinos (61%) who agree. Far fewer white Americans (34%) share this view.

Next, a majority (55%) of current students and nearly three-fourths of African Americans (75%) and Latinos (72%) believe that hate speech is an act of violence. Conversely, 53% of whites believe it is not.

In addition, 62% of current students and 7 in 10 African Americans and Latinos believe that “our society can prohibit hate speech and still protect free speech.” White Americans are evenly divided on this question.
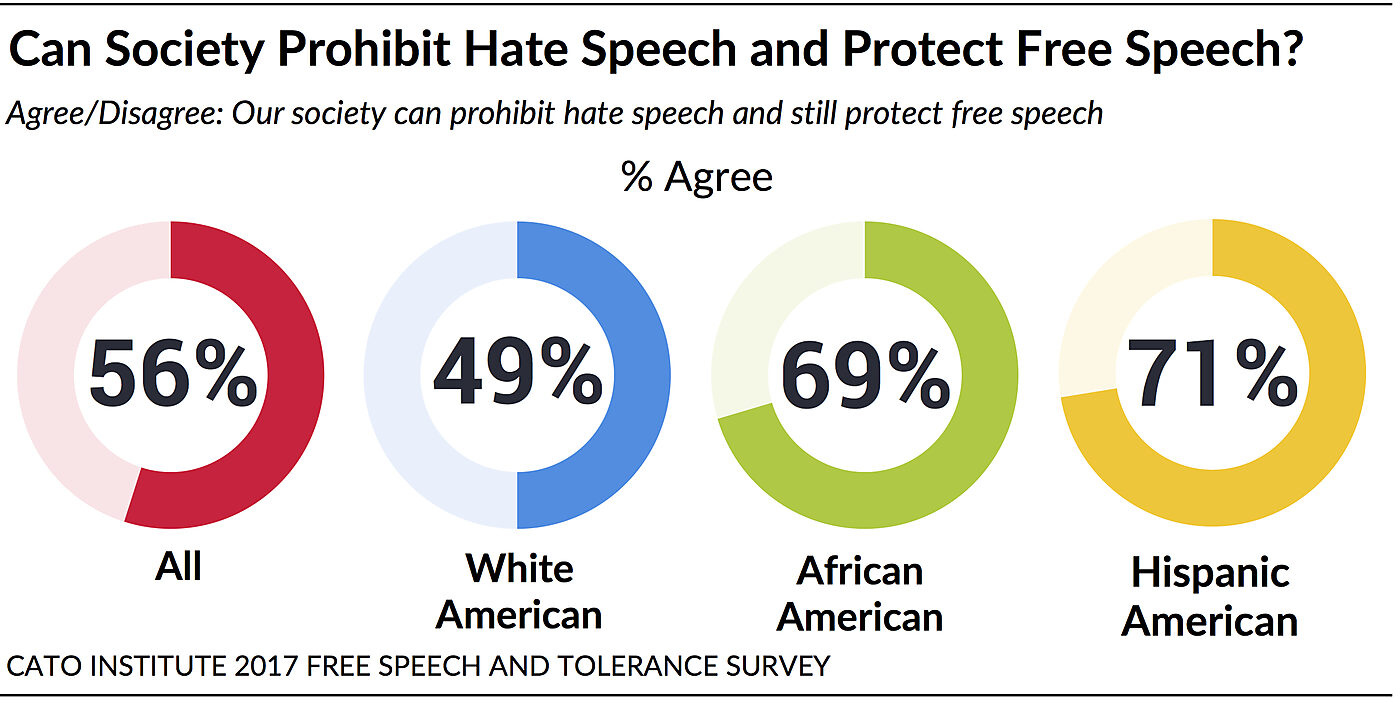
Taking these results together, it becomes clearer why the William and Mary students reacted as they did. From the students’ perspective, society is capable of protecting our First Amendment rights and curbing hate speech. If that’s true, why protect hate speech? Next, they believe hate speech is itself a violent act. Why would one want to enable violence against others? Consequently, many may conclude that anyone who tries to protect another’s right to engage in hate speech has nefarious intentions or is at least as bad as those espousing the hate. According to this view, protecting hate speech seems unnecessary and damaging. Thus, such a defense of free speech does not appear to be grounded in principle but rather a lack of empathy or even malice.
Understanding the assumptions behind the students’ logic allows for a more productive conversation. For instance, one might ask these students: is it really true that society can simultaneously ban hate speech and protect free speech? If so, how does society decide what speech is hateful and thus should be banned? Additional results from the survey demonstrate that Americans cannot agree what speech is hateful and offensive, which would make it difficult to regulate. This raises the next question: if society can’t agree what speech should be off limits, who gets to decide what speech is hateful and should be banned?
Answers to these questions are complicated and demonstrate why efforts to censor and regulate speech and expression are significantly problematic.
Sign up here to receive forthcoming Cato Institute survey reports
The Cato Institute 2017 Free Speech and Tolerance Survey was designed and conducted by the Cato Institute in collaboration with YouGov. YouGov collected responses online August 15–23, 2017 from a national sample of 2,300 Americans 18 years of age and older. The margin of error for the survey is +/- 3.00 percentage points at the 95% level of confidence.
When it comes to individual taxes, key Republican legislators seem to think “reform” is mainly about limiting or eliminating certain itemized deductions, rather than about raising revenue in ways that do the least damage to the economy (by minimizing tax distortions and disincentives).
This emphasis on curbing itemized deductions is often compared with the Tax Reform Act of 1986 (TRA86), which supposedly “paid for” cutting the top tax rate from 50% to 28% by slashing several itemized deductions. In reality, however, most extra revenue from repealing itemized deductions after 1986 was devoted to raising the standard deduction, leaving total deductions unchanged. This is apparent in the graph below, which shows total deductions – both itemized and standard – as a percentage of Adjusted Gross Income.

Deductions averaged 23.1% of AGI from 1976 to 1984, and deductions also averaged 23.1% of AGI from 1989 to 1995. In between, the reform merely shifted the timing of deductions. Deductions were pushed forward into 1985–86 to take advantage of those that were about to expire (e.g., the tax-deduction for credit card interest). Moving deductions forward held down deductions briefly in 1987–88 before they climbed back up again.
Note that total deductions were also unaffected by the fact that the maximum marginal benefit of itemized deductions (the amount saved per dollar) had fallen to 28–31% from 1988 to 1992. President Obama proposed to limit itemized deductions to 28% of the amount spent, but we already tried that in 1988–90, without success. Whatever the effect of the 1986 law eliminating several itemized deductions, plus the deep reduction in the marginal tax benefit, both were overwhelmed by the larger standard deduction.
Standard deductions doubled – from $151 billion in 1986 to over $309 billion in 1989. The only reason that is called “reform” is that politicians only define itemized deductions as “loopholes,” although the standard deduction obviously has the same effect on taxable income. Tax exemption and tax credits are far more valuable than deductions, yet (like the standard deduction) are commonly not described as “loopholes” as a matter of semantic convention (or confusion).
If the standard deduction soon rises to $24,000 per couple, as the GOP proposes, even couples with a $100,000 income would automatically have higher than average deductions.
The graph also shows that the ratio of deductions to income is clearly cyclical – rising in recessions like 1975 and 2009 because income fell more than deductions, then falling during the 1997–2000 stock boom as incomes (including capital gains and stock options) grew faster than deductions.
Reynolds’ Law of Taxes says the individual income tax will always hover around 8% of GDP, give or take one percentage point, regardless whether the top tax rate is 28%, 39.6%, 70% or 92%. Now, let’s add Reynolds’ Law of Deductions: Deductions will always hover around 23% of AGI, give or take one percentage point, regardless of whether itemized deductions are expanded, limited, or repealed.
Laws to limit itemized deductions, unlike booms and busts, have never had a noticeable lasting impact, largely because of Congressional fondness for raising standard deductions (and refundable tax credits, a super-loophole not counted here).
The Bush 41 Pease limitation on deductions was an anti-affluence political stunt making little noticeable difference. Revived in 2013, the Pease limits reduce the value of a taxpayer’s itemized deductions by 3% for every dollar of taxable income above $313,800 on a joint return. This adds about a percentage point to the top two marginal rates (and so does the PEP phase-out of personal exemptions). The Pease limits first began to phase-out itemized deductions of “the rich” in 1991, yet total deductions rose to 23.4–23.6% of AGI in 1991–93. The Pease phase-out was reinstated in 2013, yet total deductions remained the same as in 2012. Itemized deductions went down by $50.1 billion in 2013 and standard deductions went up $51.2 billion.
Doubling the standard deduction to $24,000 per couple appeared to be the primary revenue-losing objective of the GOP Big Six plan (losing $890 billion over 10 years by one estimate). Meanwhile, there have been reports of backpaddling on trial-balloons about ending property tax deductions and curbing contributions to 401(k) plans. It is not difficult to imagine the end result being that any revenue gained from limiting deductions barely offsets revenue lost by expanding the standard deduction, leaving deductions still stuck around 22–23% of AGI.
That would be like 1986 but with one big difference. In 1986, the top tax rate was cut by 22 percentage points, leaving a nearly-flat 15–28% rate structure. This year, by contrast, high-income taxpayers are not giving up big deductions and personal exemptions for a lower-rate, since the top rate is apparently to stay at 39.6%. Itemized deductions go down, personal exemptions completely vanish, yet targeted tax credits get larger (e.g., for children under age 17) and the standard deduction goes up. Tax-deferred contributions to retirement savings plans may be deeply slashed.
By rejiggering exemptions, deductions, and credits with essentially no change in the highest, most damaging tax rates, the individual side of the Republican “tax cut” is shaping up as a sizable tax increase for well-educated two-earner couples with college-age kids living in high-cost metropolitan areas, among others.
Related Tags

A study
that examined the effects body worn cameras (BWCs) have on police officers in Washington, D.C. has been making the rounds recently. The study’s findings have reinvigorated discussions about BWCs, not least because of its counterintuitive finding that BWCs did not have a statistically significant effect on officers’ use of force or civilian complaints against the police. This finding is worth considering, but the study shouldn’t deter local officials from mandating police BWCs. Even if they don’t change police officers’ behavior, BWCs can, with the right policies in place, provide a much-needed increase in police accountability and transparency.
During the study, officers with the Metropolitan Police Department of the District of Columbia were randomly assigned BWCs. Researchers with The Lab @DC, a study team in the D.C. mayor’s office, and Yale University examined use of force incidents and complaints against police officers.
The study did not seek to measure the impact of BWCs’ other benefits such as accountability, transparency, and protection for officers, but rather narrowly measured their impact. In addition to examining how often police officers use force and are the subject of complaints, researchers also studied police discretion and the judicial outcomes related to police charges.
You might expect that officers improved their behavior when they were wearing BWCs. After all, if you know that you’re being filmed you have plenty of incentives to be on your best behavior, whether you’re an officer or a resident. And yet, the recent D.C. body camera study showed that BWCs had no statistically significant effect on officers’ behavior.
This may strike many as odd. But we shouldn’t forget the limitations that restrict researchers looking into the effects of BWCs. Researchers cannot, for instance, insist that when an officer wearing a BWC calls for backup that only officers also wearing BWCs respond. In a situation where two officers are interacting with a resident and only one of the officers is wearing a BWC there is a good chance that the BWC will influence the behavior of the officer not wearing the BWC.
The researchers do not think, however, that this spillover effect affected the results of the experiment. The study notes that there was no statistically significant difference between officer behavior pre- and post-BWC deployment, as the two graphs from the study below show:


If officers not wearing BWCs improved their behavior in the presence of other officers wearing BWCs, we’d expect to see a reduction in use of force and complaints filed after the study began. However, Figure 4 and Figure 5 above show no significant difference.
Thus, even given the limitations of the study design, it appears that BWCs do not at a mass scale reduce the amount of force police officers use or the number of complaints officers receive.
The Washington, D.C. study raises an obvious question: if BWCs have no statistically significant effect on officers’ use of force or complaints, should officers be wearing them?
The answer to that question is “yes.”
First, even if body cameras do not reduce the frequency with which police officers use force, they nonetheless help provide accountability for the minority of officers who engage in serious misconduct, such as the Baltimore police officers caught planting drugs and “re-creating” a crime scene.
Second, BWCs are a tool for increased transparency in American law enforcement. Residents deserve to know how police officers behave, whether their behavior is changed by BWCs or not. At a time when cell phones are ubiquitous and BWCs are a regular feature of police misconduct debates, residents will be increasingly skeptical when a contentious fatal police encounter is not filmed. Even if a bird’s eye view of a police department reveals that BWCs don’t have a statistically significantly effect on police officers’ use of force, that doesn’t mean that same department won’t one day hire a bad police officer who will engage in illegal and deadly misconduct.
Third, BWCs can also protect police officers by minimizing time spent on baseless complaints against officers by providing clear exculpatory evidence, as was the case when a young woman falsely accused an Albuquerque Police Department officer of sexual assault during a 2014 DWI stop.
All of these BWCs benefits can only be realized with the appropriate policies in place. Without policies that protect privacy and allow residents to view body camera footage of public interest, body cameras could be used as a surveillance tool.
The authors of the Washington, D.C. study state that their results “suggest that we should recalibrate our expectations of BWCs’ ability to induce large-scale behavioral changes in policing.” But even if BWCs don’t prompt significant changes in police officers’ behavior they are worth mandating anyway. A police department with BWCs governed by the right policies will increase transparency and accountability—a welcome result even if it’s not accompanied by better-behaved police officers.

Sayfullo Saipov, an Uzbek national, killed at least eight people with a truck in New York yesterday. Uzbekistan is a central Asian country north of Afghanistan of almost 30 million people—88 percent of whom are Muslim. President Trump did not include Uzbeks in his travel ban released last month, but he is already sounding bellicose, writing that he will not allow ISIS to “enter our country” and that he “ordered Homeland Security to step up our already Extreme Vetting Program,” a phrase which he sometimes uses as shorthand for the travel ban.
But adding Uzbekistan to the travel ban would be unwise for a president whose administration has guided him toward adopting a very specific strategy to defend the ban: that the governments of the banned nationalities fail to meet certain criteria relating to identity management, information sharing, and terrorist activity in their country. As I explained in a post last month, the president did not apply the criteria in any objective way, banning some countries that meet the criteria while not banning many other countries that fail them. But adding yet another country that he himself said just a month ago meets the criteria would further expose the travel ban criteria as the sham that they are.
Uzbekistan does not fail the travel ban criteria that the Department of Homeland Security (DHS) created to justify the ban. Here are the nine travel ban criteria grouped into the three DHS categories:
Category 1: Identity management
1) Use of electronic passports embedded with data: Uzbekistan does use an electronic passport. But four travel ban countries—Venezuela, Somalia, Libya, and Iran—also use an e‑passport. The president banned Somalia despite its meeting this requirement because some countries fail to recognize Somalia’s electronic data chip. But that’s not the case for Iran’s passport, which meets the International Civil Aviation Organization standards. Uzbekistan’s passport does as well, and it “plans to convert all [older] passports to the new biometric version by July 1, 2018.”
2) Reports lost and stolen passports: INTERPOL reports that only 174 of 190 countries share lost or stolen passport information with its database (on which the United States relies). Unfortunately, it doesn’t report country-by-country compliance. However, INTERPOL praised Uzbekistan this month for cooperating with it on identifying fraudulent and stolen passports. That said, INTERPOL has also called Iranian cooperation on passport theft and abuse “very strong,” and Iranians are banned.
3) Makes available upon request identity-related information: This criterion is vague, but Uzbekistan cooperates with INTERPOL on passport information. According to the U.S. Department of State, Uzbekistan “has actively participated in the C5+1 regional framework of cooperation between the United States and the Central Asian countries (Kazakhstan, Kyrgyz Republic, Tajikistan, Turkmenistan, and Uzbekistan), which includes a program related to countering violent extremism (CVE).”
Category 2: National security information
4) Makes available terrorist and criminal information upon request: Uzbekistan does make available this information. The State Department reports: “Uzbek law enforcement maintains its own terrorist watchlist and contributed to INTERPOL databases.” Further, it reports, “Uzbekistan has worked with multilateral organizations such as the Organization for Security and Cooperation in Europe and the UN Office on Drugs and Crime on security issues.”
5) Provides identity document exemplars: There is no public information on this, but given the evidence on passport cooperation, it seems likely that Uzbekistan do provide documents.
6) Allows U.S. government’s receipt of information about passengers and crew traveling to the United States: Uzbekistan encourages this information sharing. The State Department writes, “state airline collects and disseminates advance passenger information. The U.S. Transportation Security Administration conducted several inspections of the Tashkent airport in 2016.” Compliance by other countries with sharing this information was in 2013 “close to 100 percent.”
Category 3: Risk indicators
7) Is a known or potential terrorist safe haven: According to the U.S. Department of State, Uzbekistan is neither a terrorist safe haven nor has it ever been a terrorist safe haven. Terrorist safe havens are defined by the inability or unwillingness of the country’s government to control its territory to prevent terrorist groups from having a safe space to form. This description does not apply to Uzbekistan, which goes to great lengths to prevent terrorist groups from having safe haven and does control its territory. Chad, North Korea, and Iran are not terrorist safe havens either, but are travel ban countries.
8) Is a participant in the Visa Waiver Program that meets all of its requirements: Uzbekistan is not a participant in the VWP, so this criterion likely does not apply to it. None of the other travel ban countries are participants in the VWP.
9) Regularly fails to receive its nationals subject to final orders of removal from the United States: As of May 2017, Uzbekistan did not regularly refuse to receive its nationals subject to final orders of removal, according to federal Immigration and Customs Enforcement. In September, the U.S. government sanctioned four countries for failure to receive its deportees, but Uzbekistan was not on that list either. Of course, of the travel ban countries, only Iran was on the list from May.
The president could always add additional criteria to try to justify including Uzbeks in the travel ban, but any additional criteria would result in the failure of even more countries—many of whom meet the DHS criteria and are allies of the United States. For example, if President Trump added a requirement that no nationals of the country in question have killed anyone in the United States in a terrorist attack, then at least a dozen other countries would have to be added to the travel ban list. Of course, none of the current travel ban countries have nationals that have committed deadly terrorist attacks in the United States since 1975.
Uzbekistan fails none of the requirements outlined by the Department of Homeland Security. If President Trump chooses to add them to the list, it would further expose the travel ban as an arbitrary exercise of the executive whim, not an objective list.
Related Tags
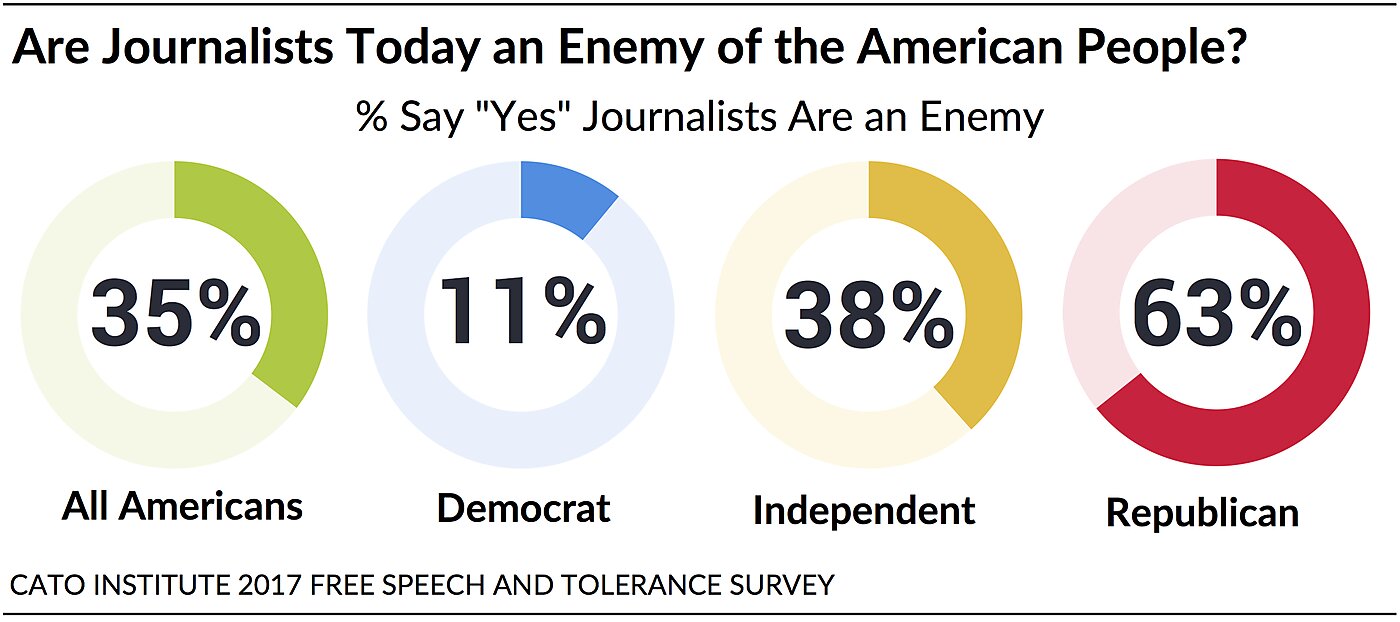
Early in his presidential tenure, Donald Trump tweeted that the national news media is “fake news” and that it is an enemy of the American people. Nearly two-thirds (64%) of Americans do not agree with President Trump that journalists today are an “enemy of the American people,” finds the Cato 2017 Free Speech and Tolerance Survey. Thirty-five percent (35%) side with the president.
However, nearly two-thirds (63%) of Republicans agree that journalists are an enemy of the American people. Such a charge is highly polarizing: 89% of Democrats and 61% of independents do not think journalists are the enemy.
52% of Democrats Say Media Is Doing a Good Job Holding Government Accountable
While Republicans stand out with their negative view of the media, Democrats have uniquely positive evaluations of it. A slim majority (52%) of Democrats say the national news media is doing a good or even an excellent job “holding government accountable.” In contrast, only 24% of independents and 16% of Republicans agree.
Full survey results and report found here.

Among all Americans, only a third (33%) agree the news media is doing its job holding government accountable. More than two-thirds (67%) say it is not.
The more a person identifies as liberal, the more likely they are to say the media is doing a good job. Among strong liberals, 59% say the national news media is doing a good or excellent job holding government accountable. In contrast, 87% of strong conservatives say it’s doing a poor or fair job.
Most Americans Perceive Media Bias
Why do Republicans lack confidence in the national news media while Democrats view it positively? Perhaps because most Americans perceive a liberal bias among most major news organizations.[1]
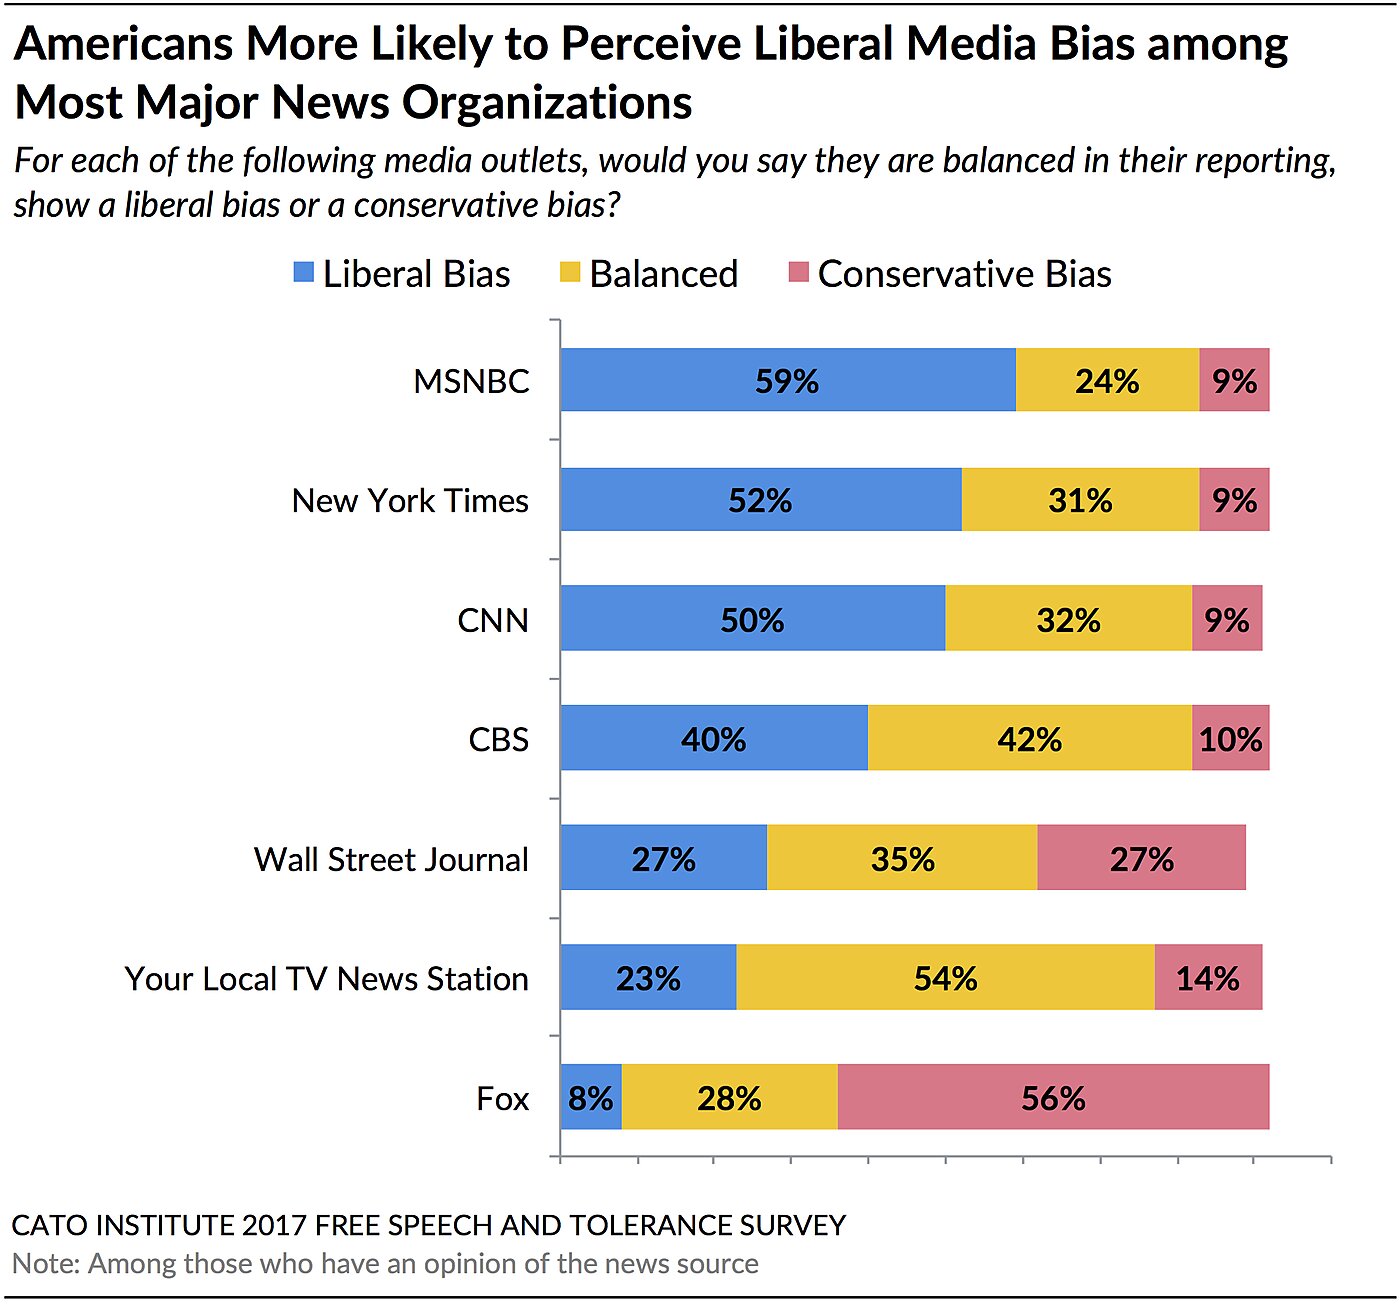
Fifty-two percent (52%) of respondents say that the New York Times allows a liberal bias to color its reporting. Fifty percent (50%) feel CNN also succumbs to a liberal media bias. Fifty-nine percent (59%) say that MSNBC also has a liberal bias. Of all the top news organizations included on the survey, only Fox News was perceived to have a conservative bias (56%).
Americans feel their local news stations and broadcast news channels do a better job than cable news in providing balanced reporting. A majority (54%) say their local news station is balanced, without a liberal or a conservative bias. A plurality (42%) also believe that CBS is balanced. Nevertheless, respondents were four times as likely to say CBS has a liberal bias than a conservative bias (40% vs. 10%), and almost twice as likely to say their local station has a liberal bias (23% vs. 14%).
Democrats Believe Media Is Balanced; Republicans See Liberal Bias
Majorities of Democrats believe most major news organizations are balanced in their reporting, including CBS (72%), CNN (55%), the New York Times (55%), as well as their local news station (67%). A plurality (44%) also believe the Wall Street Journal is balanced. The two exceptions are that a plurality (47%) believe MSNBC has a liberal bias (37% believe it’s unbiased) and a strong majority (71%) say Fox has a conservative bias.
Republicans, on the other hand, see things differently. Overwhelming majorities believe liberal bias colors reporting at the New York Times (80%), CNN (81%), CBS (73%), and MSNBC (80%). A plurality also feel the Wall Street Journal (48%) has a liberal tilt. Only when evaluating their local TV news station do most Republicans—but not a majority—perceive balanced reporting (42%). Similar to Democrats’ perceptions of MSNBC, a plurality of Republicans (44%) believe Fox News has a conservative bias; 41% believe it provides unbiased reporting.
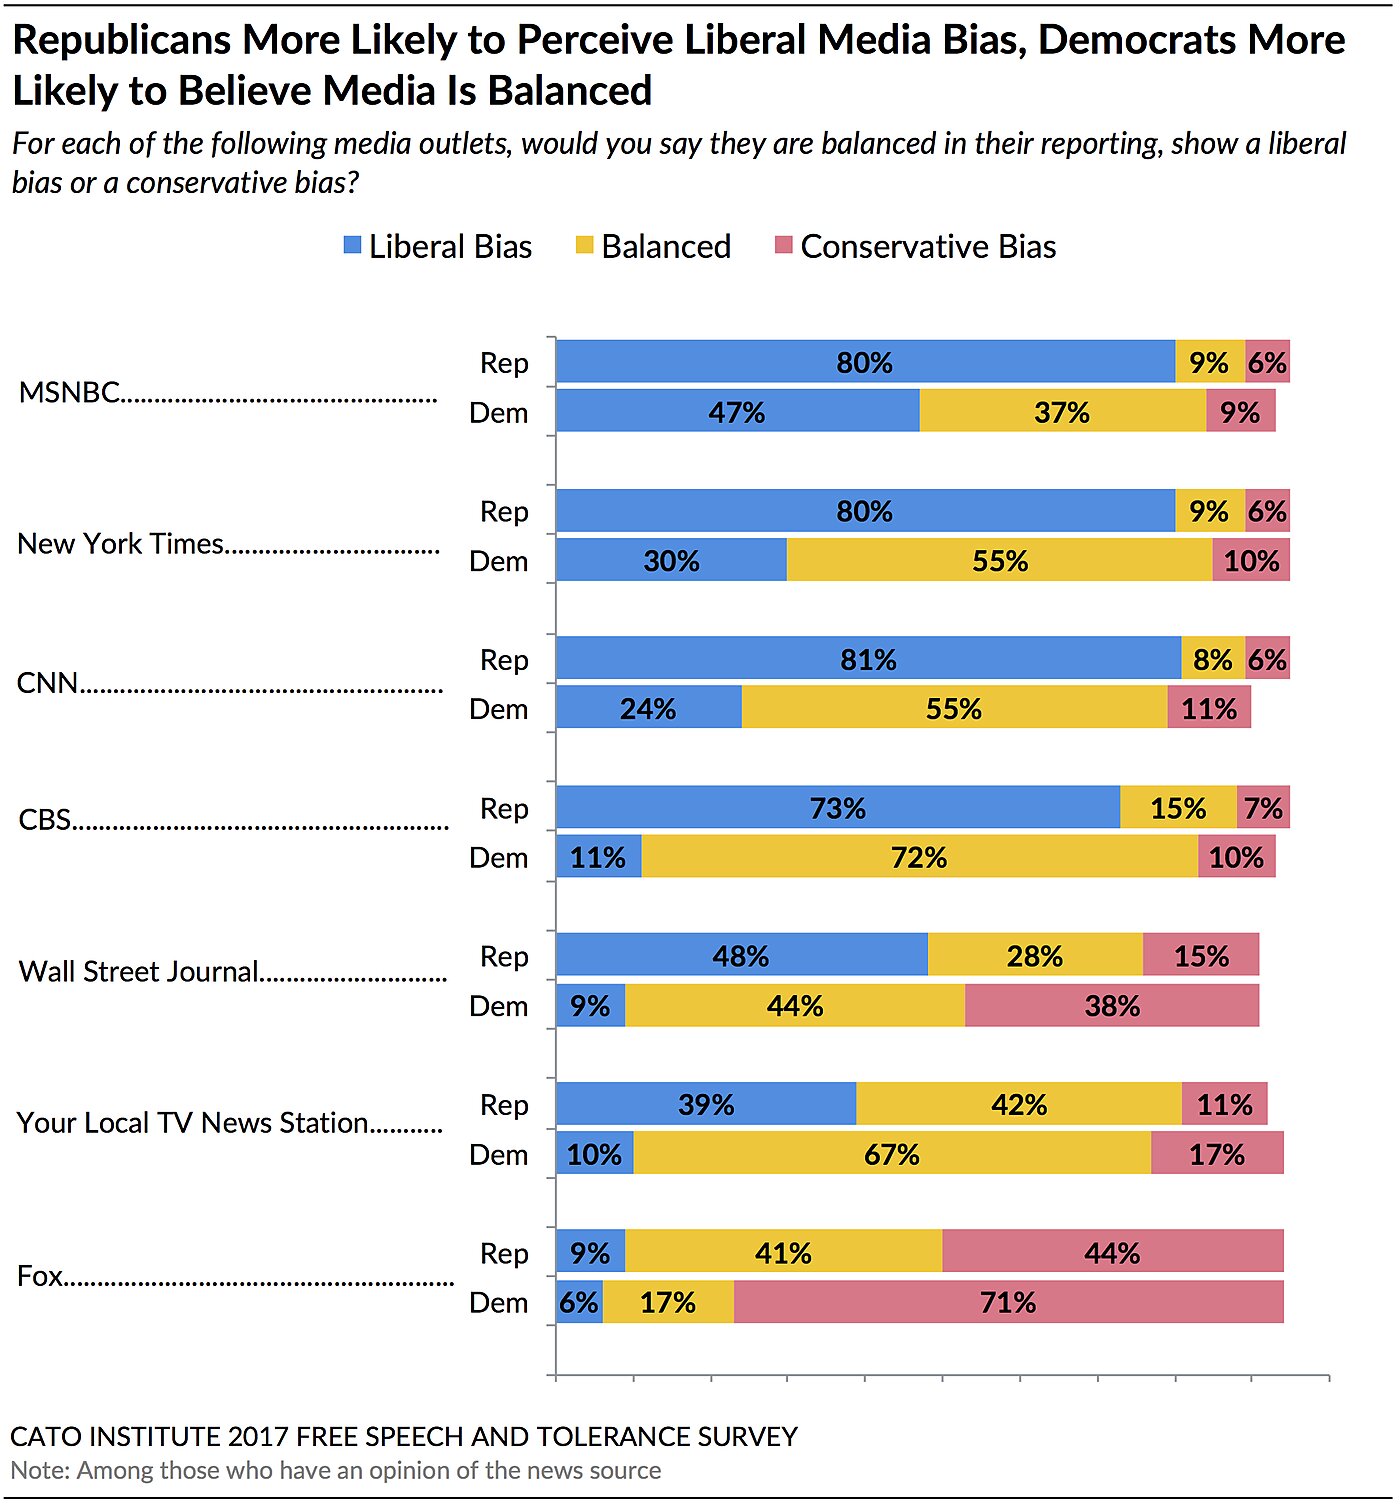
The news outlets that Republicans find most objective are their local news station (42%), Fox (41%), and the Wall Street Journal (28%). The media organizations Democrats find most objective include CBS (72%), their local news station (67%), CNN (55%), and the New York Times (55%).
70% Say Government Should Not Be Able to Shut Down News Stories
Despite Democrats and Republicans’ different perceptions of news media, they agree that government should not shut down news stories—even if biased or inaccurate.
Strong majorities of Republicans (63%), independents (71%), and Democrats (76%) agree that “government should not be able to stop a news media outlet from publishing a story that government officials say is biased or inaccurate.”

Among all Americans, 70% say government should not shut down news stories regardless of whether officials think the story is inaccurate. A little more than a quarter (29%) think government should have the authority to stifle stories authorities say are inaccurate or biased.
Full survey results and report found here.
Sign up here to receive forthcoming Cato Institute survey reports
The Cato Institute 2017 Free Speech and Tolerance Survey was designed and conducted by the Cato Institute in collaboration with YouGov. YouGov collected responses online August 15–23, 2017 from a national sample of 2,300 Americans 18 years of age and older. The margin of error for the survey is +/- 3.00 percentage points at the 95% level of confidence.
[1] Percentages in this section have been calculated among Americans with an opinion of the news source. The following were not familiar with each of these news sources: CNN: 16%, Fox: 13%, MSNBC: 22%, CBS: 19%, Local TV News Station: 18%, New York Times: 24%, Wall Street Journal: 29%.
As Republicans press ahead with major tax reforms, politicians and pundits are debating the effects of tax cuts on economic growth. This 2012 study by the former Tax Foundation chief economist took a detailed look at the academic literature on the issue.
Here is what Will McBride found:
So what does the academic literature say about the empirical relationship between taxes and economic growth? While there are a variety of methods and data sources, the results consistently point to significant negative effects of taxes on economic growth even after controlling for various other factors such as government spending, business cycle conditions, and monetary policy.
In this review of the literature, I find twenty-six such studies going back to 1983, and all but three of those studies, and every study in the last fifteen years, find a negative effect of taxes on growth. Of those studies that distinguish between types of taxes, corporate income taxes are found to be most harmful, followed by personal income taxes, consumption taxes and property taxes.”
These results support the neo-classical view that income and wealth must first be produced and then consumed, meaning that taxes on the factors of production, i.e., capital and labor, are particularly disruptive of wealth creation. Corporate and shareholder taxes reduce the incentive to invest and to build capital. Less investment means fewer productive workers and correspondingly lower wages. Taxes on income and wages reduce the incentive to work. Progressive income taxes, where higher income is taxed at higher rates, reduce the returns to education, since high incomes are associated with high levels of education, and so reduce the incentive to build human capital. Progressive taxation also reduces investment, risk taking, and entrepreneurial activity since a disproportionately large share of these activities is done by high income earners.”
This review of empirical studies also establishes some standards by which a tax system may be judged. If we apply these standards to our national tax system, the U.S. has probably the most inefficient tax mix in the developed world. We have the highest corporate tax rate in the industrialized world. If it came down 10 points—still higher than most of our trading partners—it would add 1 to 2 points to GDP growth and likely not lose tax revenue, because the tax base would expand from in-flows of foreign capital as well increased domestic investment, hiring, and work effort.
McBride’s study, with a nice summary table, is here.