


-
Many critics of free trade argue that American workers and families were better off in the less globalized 1970s and even earlier decades.
-
While the U.S. economy is more deeply integrated into the global economy today than 50 years ago, Americans today are undoubtedly better off by numerous measures of economic well-being.
-
When we more accurately account for price changes, Americans today enjoy much higher real wages and household incomes than 50 years ago. Thanks in part to globalization, Americans work fewer hours to acquire a wider variety of goods and services.
-
Rising living standards in our more globalized era have not come at the expense of the poor, here or abroad. Properly accounting for inflation and government transfers, the poverty rate today is lower than in the 1970s, and inequality is no higher.
-
U.S. manufacturing employment has fallen since its peak in 1979, but the main driver is rising productivity, not imports. The U.S. manufacturing sector remains strong, and lost manufacturing jobs have been more than offset by safer and better-paying services jobs.
When we consider the progress that has been made in the past 50 years—in living standards, equality in household consumption, worker safety, and opportunities for women and minorities—the nostalgia for a less globalized past is difficult to understand.
Americans have traditionally been optimistic about the future, but a strain of thinking across the political spectrum today seeks to recapture a time when life was supposedly better for most Americans. Concerns about the present state of the nation often focus on the increased globalization of recent decades and the harm it has allegedly inflicted on American households and workers. Proponents of this view—as disparate as U.S. Rep. Ro Khanna (D‑CA) and Sen. Josh Hawley (R‑MO)—mourn the loss of manufacturing jobs, the decline of union membership, “stagnant” real wages, and an alleged rise in income inequality since the 1970s or even earlier. They advocate higher barriers to international trade and investment as an obvious remedy to this supposed decline.
This “nostalgianomics” is misplaced. The American economy is certainly more globalized today than it was decades ago, and just as certainly, most Americans are better off today by any real measure of economic well-being than their counterparts were a half century ago. In fact, increased globalization is one of the main reasons why Americans today have higher living standards than they did in the over-idealized past.
The U.S. Economy Has Opened and Liberalized in Recent Decades
The world has certainly changed in the past half century. Along with technological and scientific advancements, the U.S. economy has become far more deeply integrated with the rest of the world. This integration has been driven both by new technologies that have facilitated the movement of goods, services, and people around the world—such as containerization and the internet—and by major trading nations’ concerted efforts to reduce tariffs and other legal restrictions on those same movements.
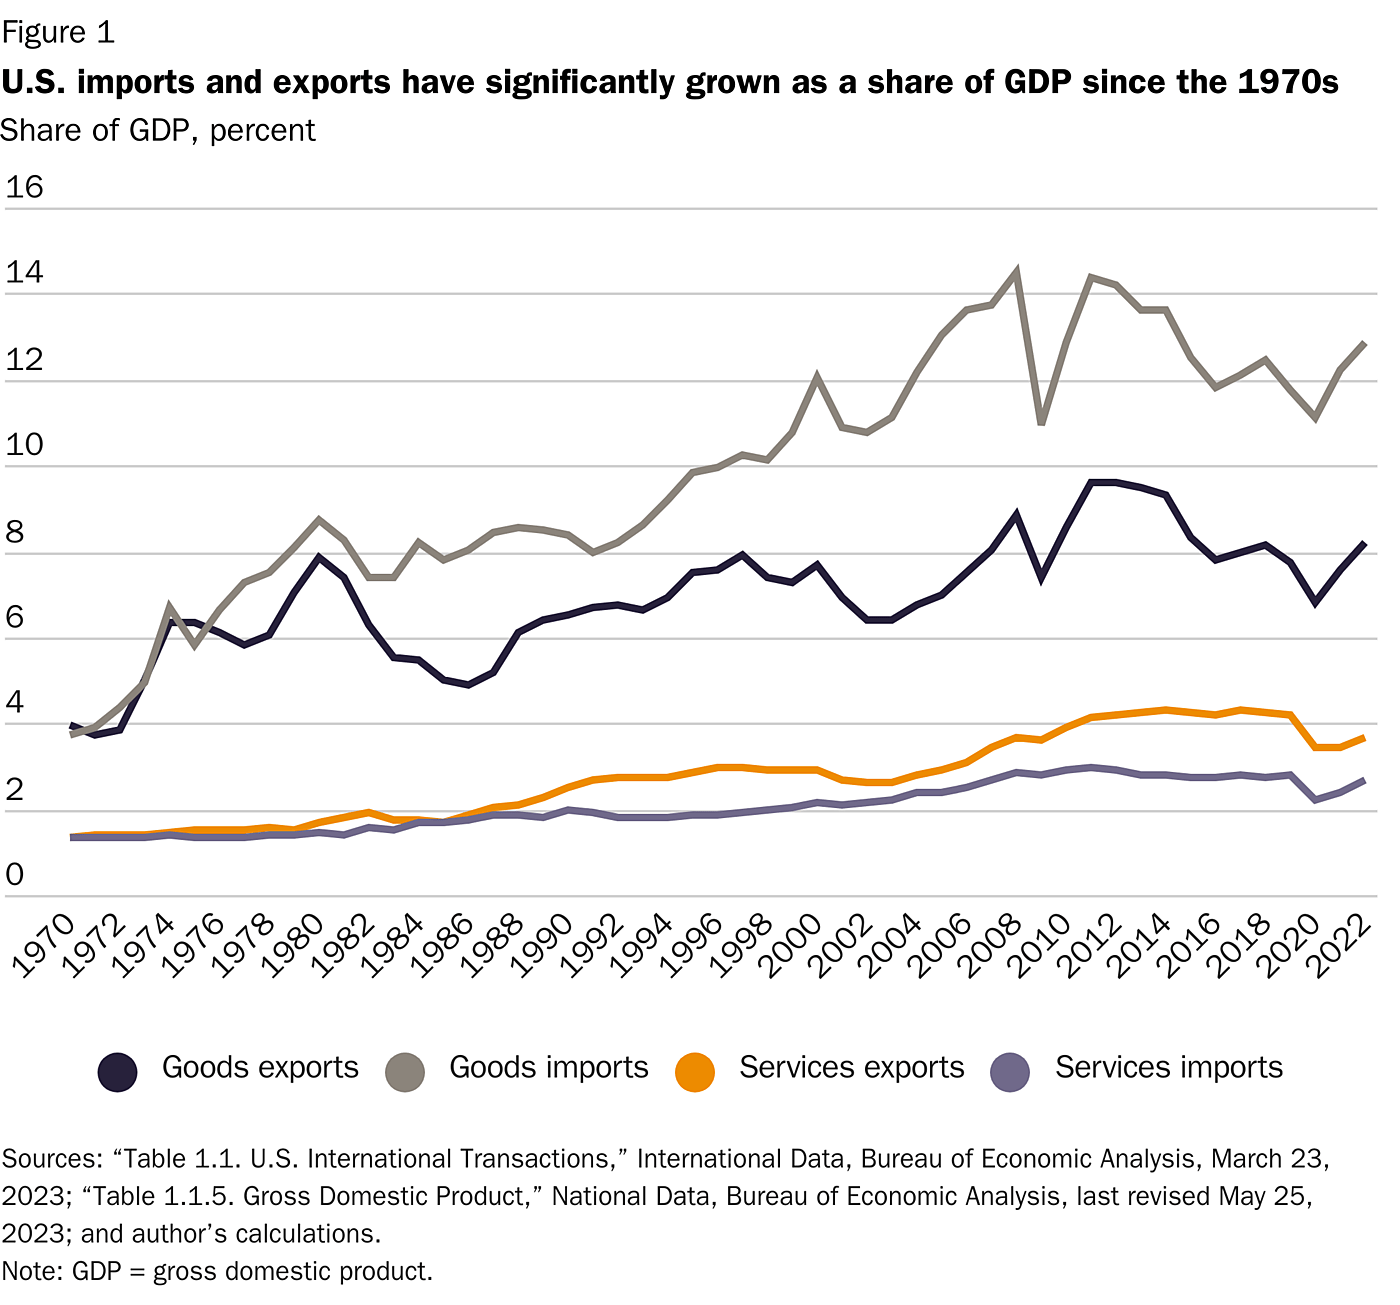
Those changes have deepened America’s integration into the global economy in recent decades. As Figure 1 shows, U.S. imports and exports of goods and services have increased substantially since the 1970s: the average value of U.S. goods exports increased from 5.4 percent of gross domestic product (GDP) in the 1970s to 8.7 percent in the 2010s, while goods imports increased even more (from 5.9 percent, on average, to 12.9 percent). Over the same period, services exports more than tripled (from 1.2 percent to 4.2 percent), and services imports more than doubled (from 1.3 percent to 2.8 percent).
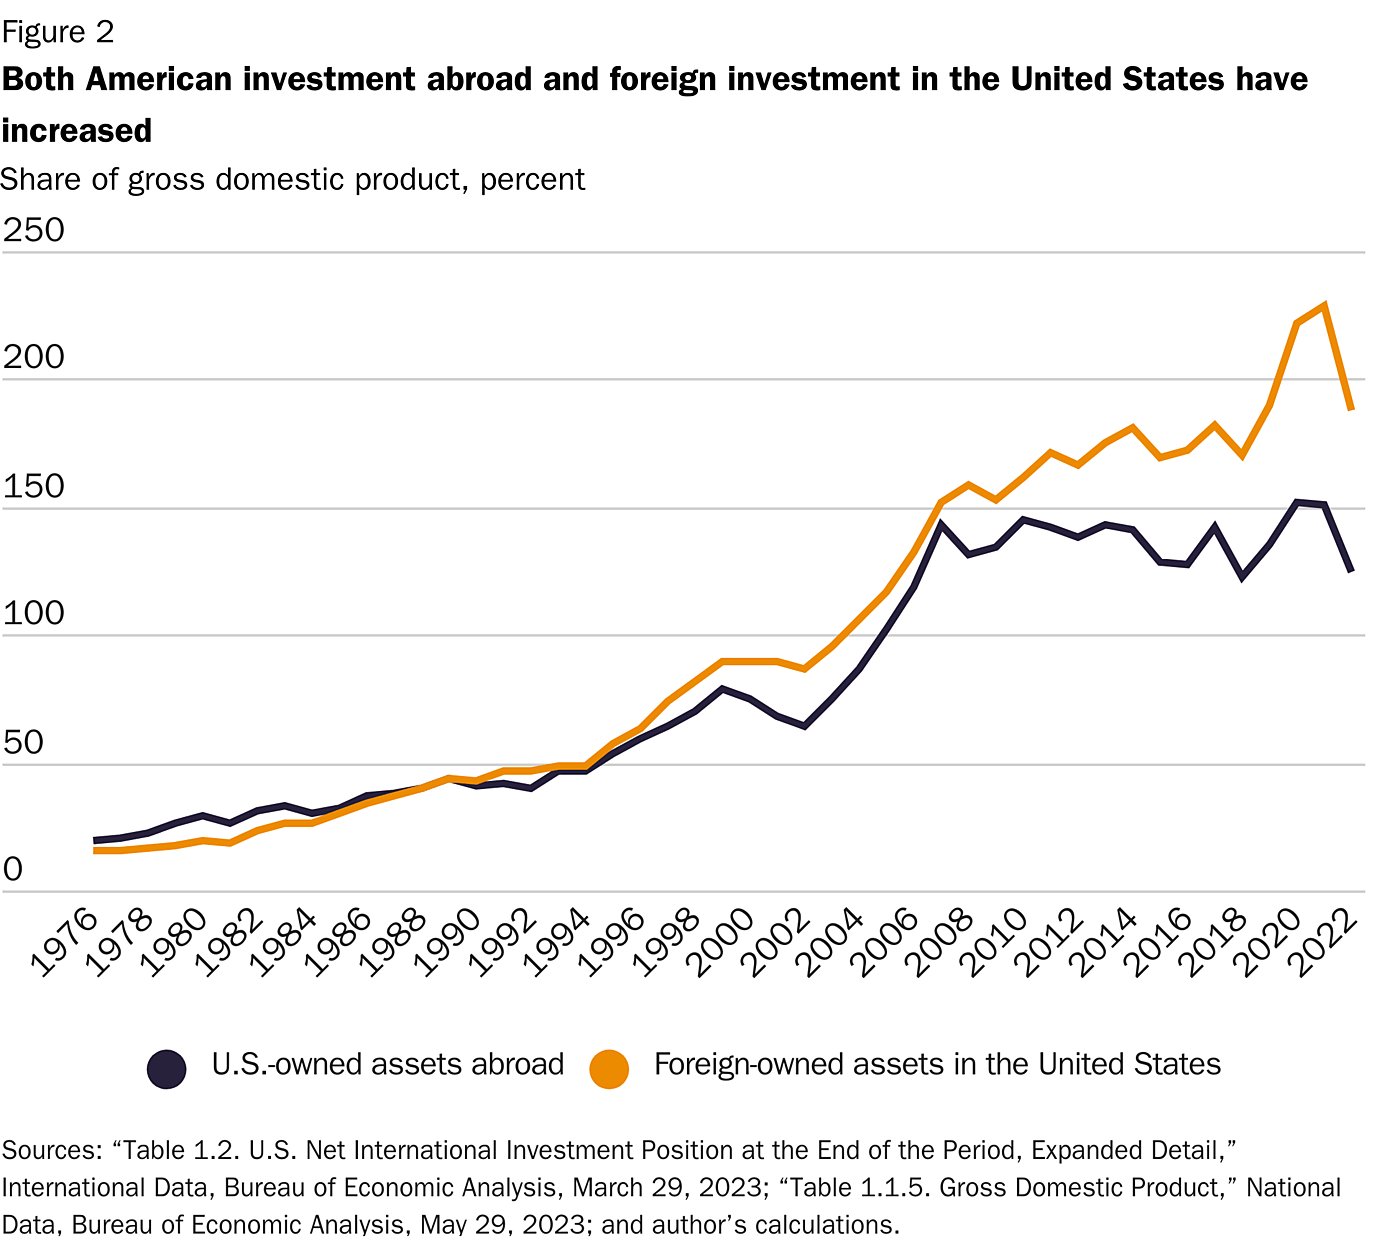
The United States’ international investment position has exhibited similar trends (see Figure 2). At the end of the 1970s (1976–79), American-owned assets abroad averaged 22 percent of U.S. GDP; by the most recent five years (2017–2021), the figure hit 150 percent of GDP. Foreign-owned assets in the United States grew even faster: from an average of 16 percent of GDP in the late 1970s to 198 percent in the past five years.
The United States has also become more open and globalized through immigration. The share of the nation’s foreign-born population rose from 5.4 percent in 1960 to 6.2 percent in 1980 and then 13.6 percent by 2021.
The United States’ international economic liberalization was accompanied by significant domestic liberalization over the same period. Beginning in the 1970s, for example, the U.S. government deregulated domestic trucking, air passenger service, freight rail, oil and natural gas prices, and telephone, cable, and satellite TV services.
These trends, of course, do not mean that the United States today is some sort of free-market paradise or even that the U.S. economy is more globally integrated than its peers abroad. (It isn’t.) Nevertheless, it remains undeniably true that the United States has experienced significant domestic and international liberalization in recent decades—liberalization that has produced a more open and competitive U.S. economy that has delivered greater and more widespread benefits to American workers and families.
Americans Are Better Off Today in Many Ways
Globalization has contributed to increased prosperity for most American households over the past half century. Liberalization of markets here and abroad has increased competition among producers, opened new markets for U.S. exporters, increased the productivity of American firms and workers, and lowered the real price of goods and services for American families—resulting in higher real incomes for most Americans.
The Real Story of Hourly Earnings and Household Incomes
Nostalgianomics’ depiction of American “wage stagnation” since the 1970s is fundamentally flawed in several key ways. First, the most typical indicator of such stagnation—U.S. production and nonsupervisory workers’ average inflation-adjusted hourly earnings—relies on an overstated measure of U.S. inflation that makes Americans’ real-wage gains seem smaller over time. As authors Phil Gramm, Robert Ekelund, and John Early explain in The Myth of American Inequality, properly accounting for inflation turns American wage “stagnation” into significant gains:
If the inflation adjustment for real average hourly earnings for production and nonsupervisory employees were to incorporate both the Chained [Consumer Price Index for All Urban Consumers] to remove the substitution bias and more accurate adjustments for new and improved products, real average hourly earnings would have risen 74.0 percent over the last fifty years rather than the official reported number of 8.7 percent. That is an additional $7.50 per hour.
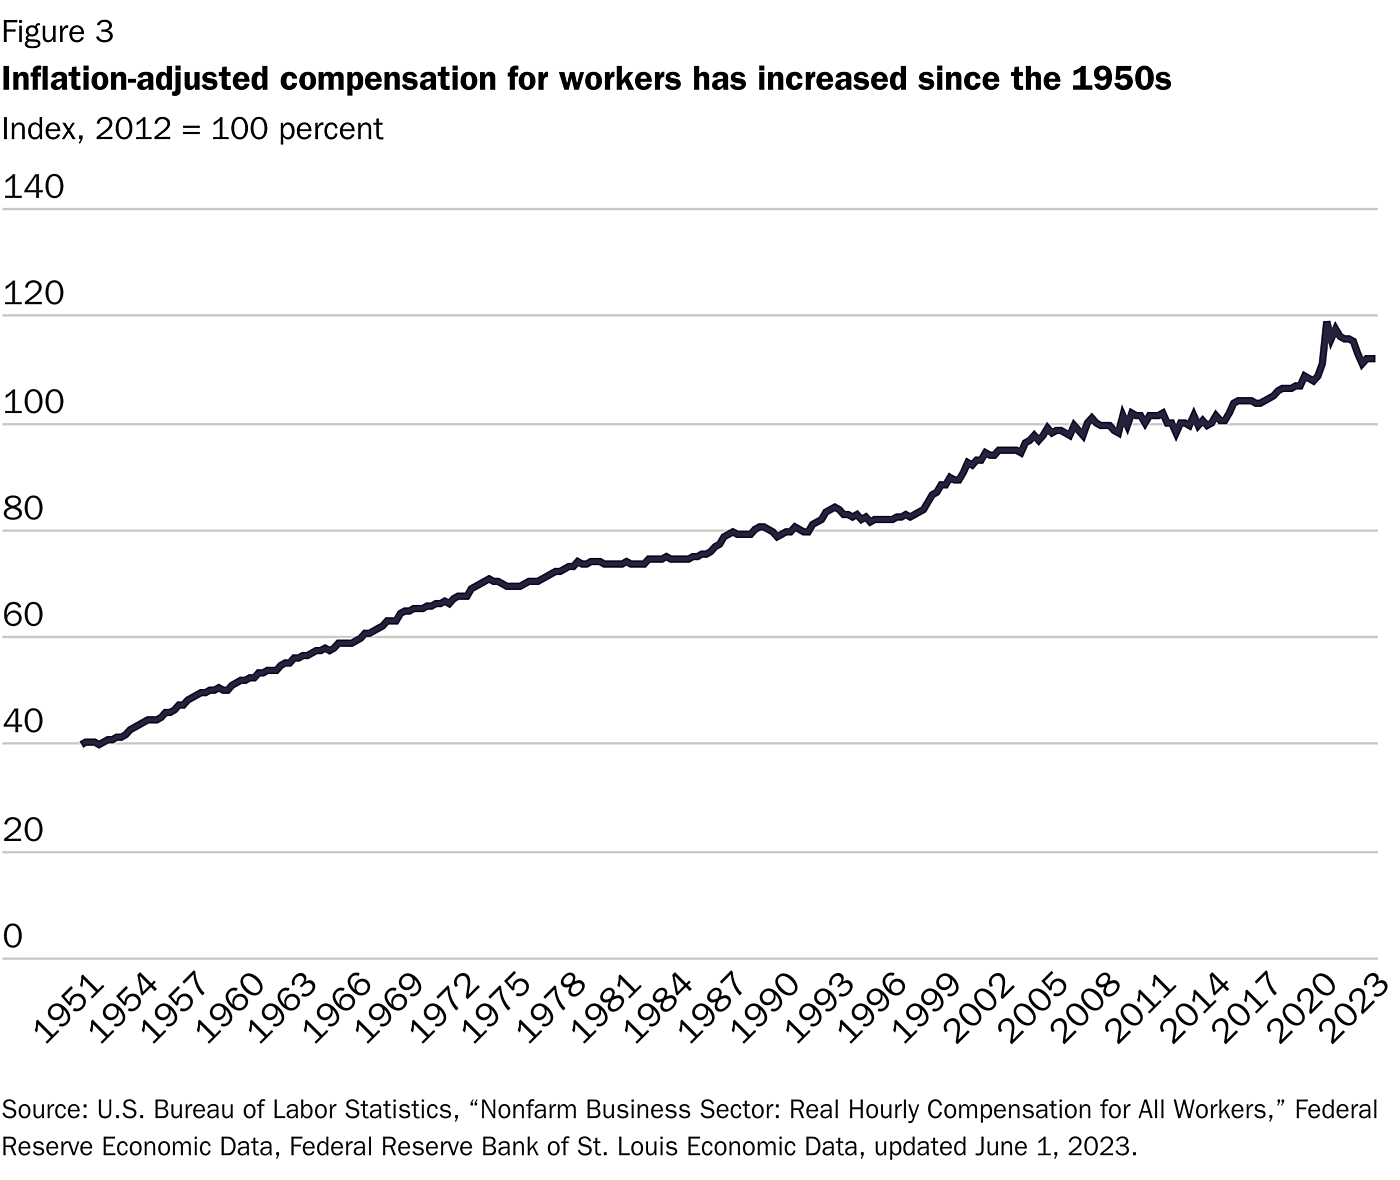
Second, examining only wages excludes nonwage benefits—bonus pay, health insurance, paid leave, contributions to retirement savings, etc.—that have made up an increasing share of total compensation in recent decades. As Figure 3 shows, including these benefits and more, properly accounting for inflation shows substantial upward progress in workers’ total compensation since the 1950s or 1970s:
Other measures of income show similar gains during recent decades of U.S. globalization. William Cline of the Peterson Institute for International Economics, for example, calculates that real median household income rose by 50 percent from 1967 to 2017—almost 30 percentage points more than what U.S. Census Bureau data report—after applying a more accurate inflation measure and normalizing household size across time periods. In their analysis, Gramm, Ekelund, and Early made a similar estimate.
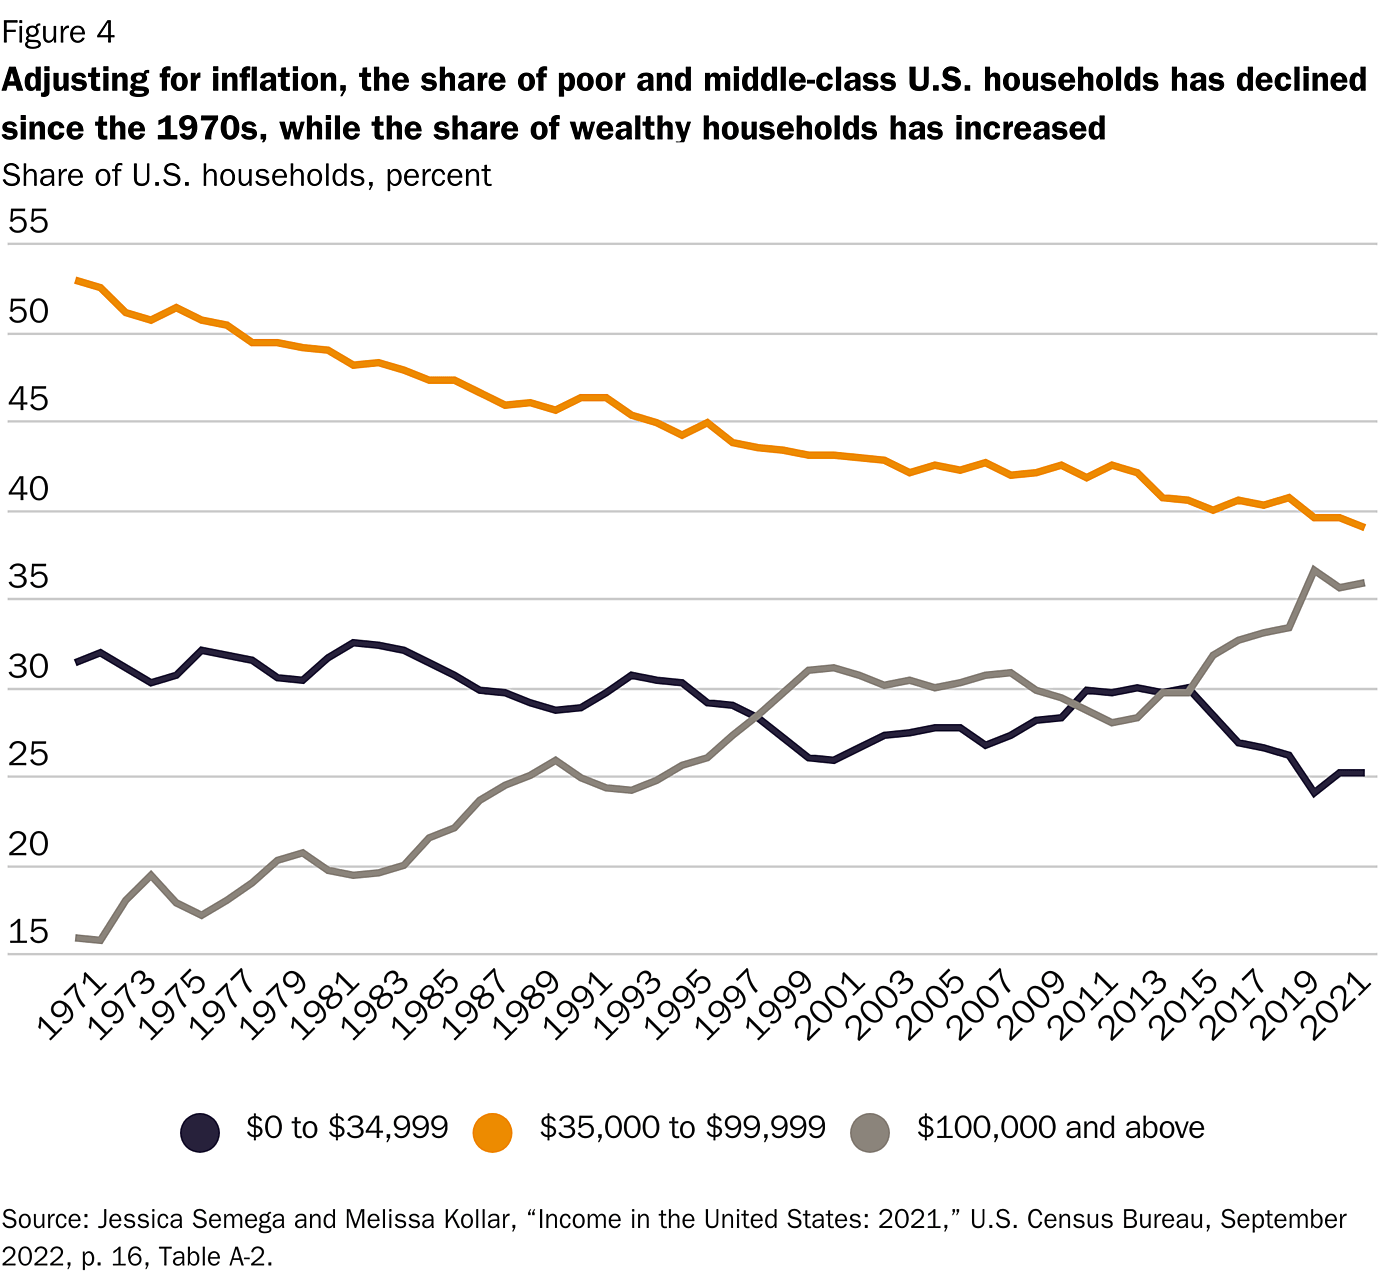
Census data also correct the myth that our more globalized economy has impoverished—and thus “hollowed out”—the American middle class. As Figure 4 shows, the share of U.S. households earning a middle-class annual income of $35,000 to $100,000 (in 2021 dollars) did indeed shrink since 1979, from 49.1 percent to 39 percent, but so did the share of households earning below $35,000 (from 30.3 percent to 25.2 percent). By contrast, the share of households annually earning more than $100,000 increased from 20.6 percent to 35.8 percent. Thus, the American middle class has shrunk in recent decades—but only due to households getting richer.
Working Less for More: The Plunging Time Price of Consumer Goods
Even these adjusted income data understate the gains enjoyed by American workers in our more globalized era. In Superabundance: The Story of Population Growth, Innovation, and Human Flourishing on an Infinitely Bountiful Planet, Cato scholars Marian Tupy and Gale Pooley compare time prices (i.e., how many hours people must work on average to acquire various goods and services) across decades and find that American workers have experienced dramatic gains since the 1970s. In particular, they calculate that the number of hours an average U.S. blue-collar worker would have to work to afford a basket of 35 consumer goods fell by 72.3 percent between 1979 and 2019 (Tupy and Pooley, p. 171). For example, in 1979, a coffeemaker cost $14.79 while the average blue-collar worker earned $8.34 per hour, meaning he would have to work 1.77 hours to buy the coffeemaker. By 2019, a comparable coffeemaker sold for $19.99 while the average blue-collar worker earned $32.36 an hour, translating to a time price of 0.62 an hour—a 65 percent decline. Using the same methodology, the authors found similar improvements for other household goods: the time price of a dishwasher had fallen by 61.5 percent; for a washing machine, by 64.6 percent; for a dryer, 61.8 percent; for a child’s crib, 90 percent; for a women’s blazer, 69 percent; and for women’s pants, 44.6 percent (Tupy and Pooley, pp. 454–56).
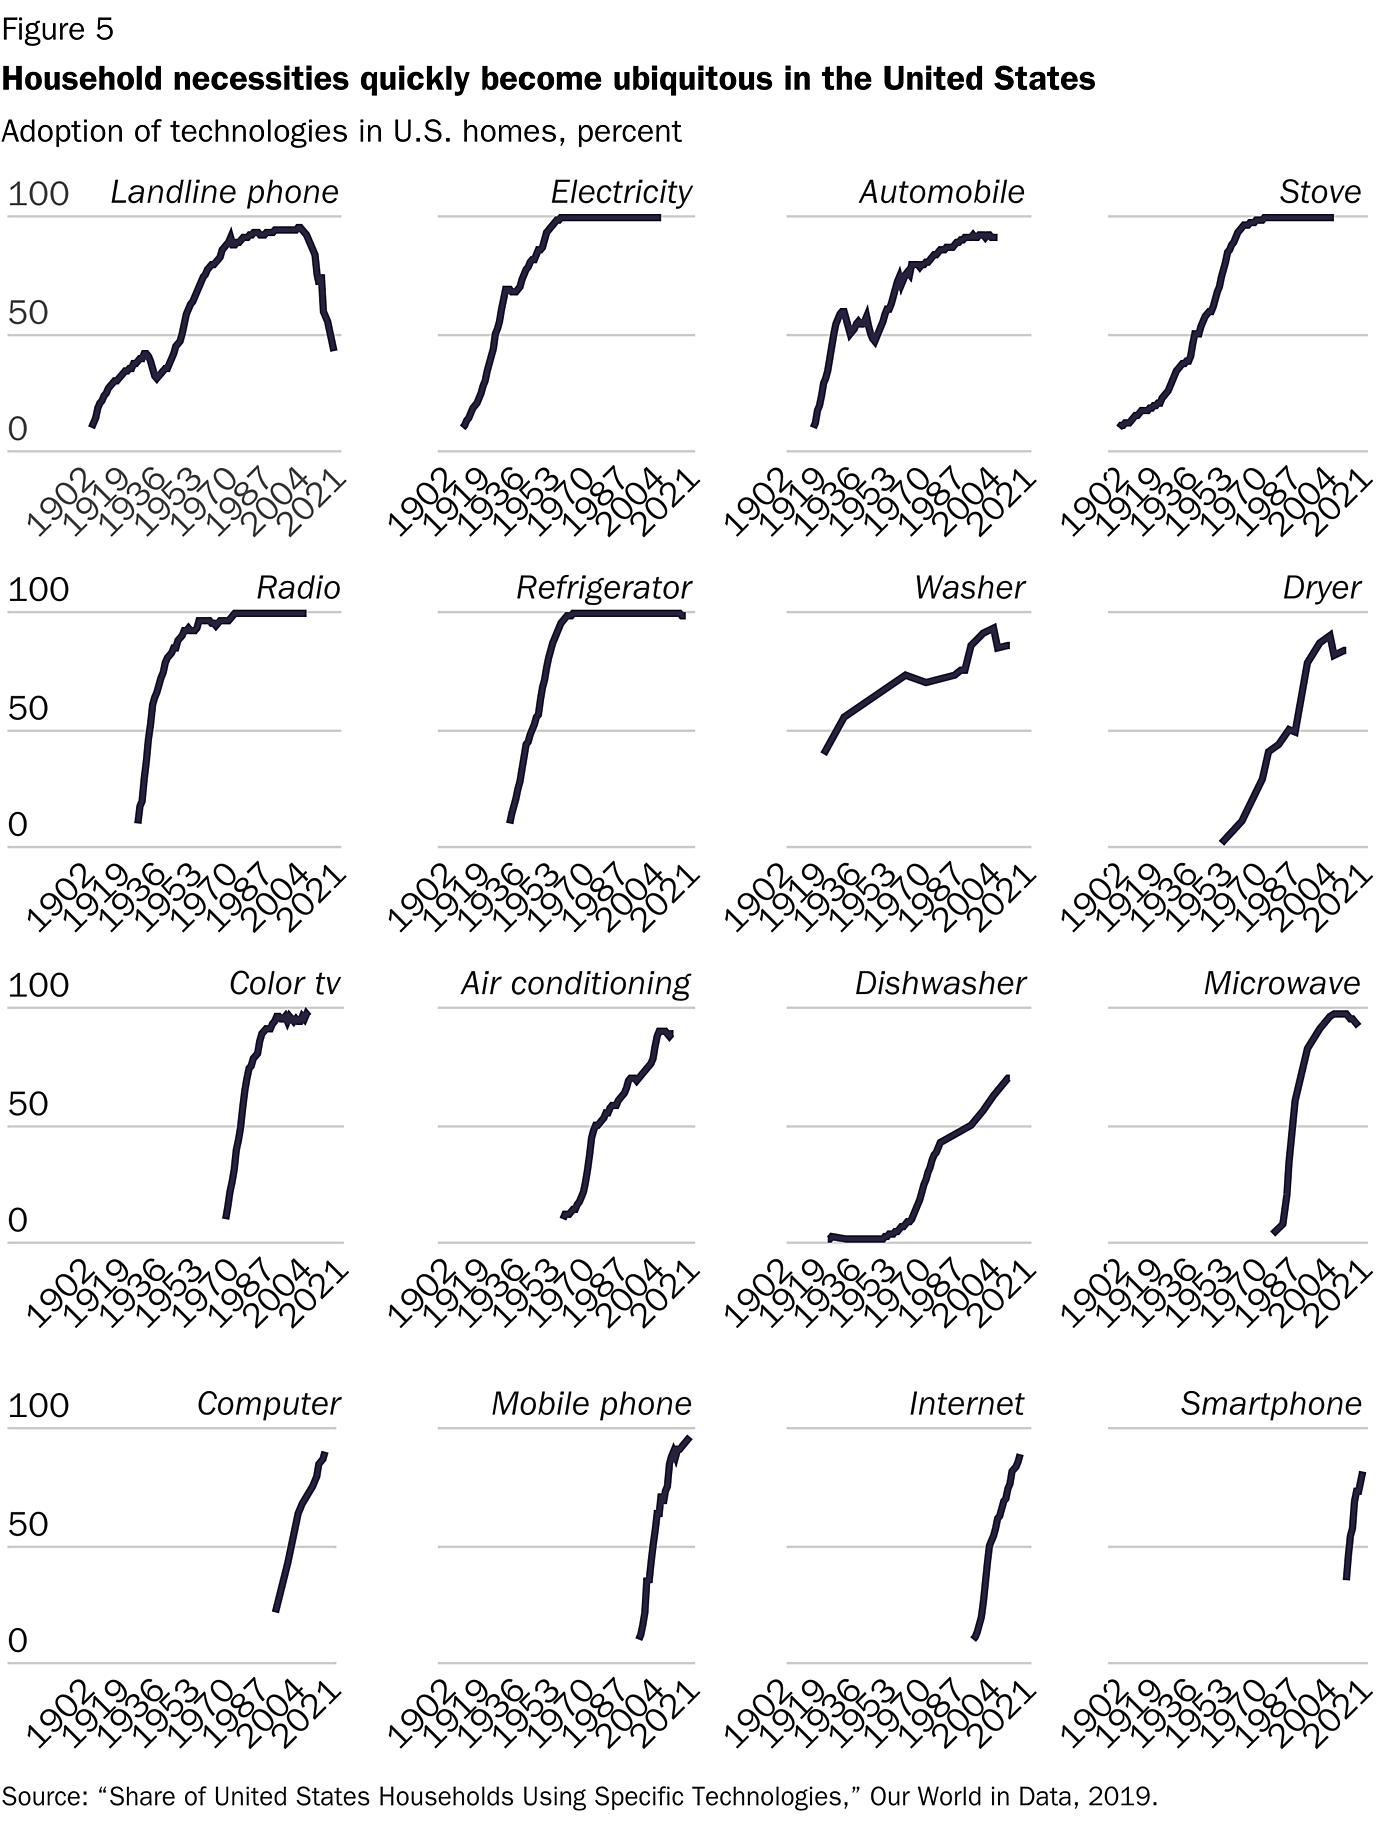
American workers are better off than in decades past not only because familiar goods have become more affordable but also because new types of products have come on the market and spread rapidly. Figure 5 shows that a range of products and services became ubiquitous in U.S. households—including automobiles and refrigerators in the first half of the 20th century, color TVs and air conditioning in the second half, and internet access and smartphones at the beginning of the 21st century.
Those who are nostalgic about life in the 1970s would likely have lived without microwaves, personal computers, and the internet. Those looking back to the 1950s forget or ignore the fact that most homes not only lacked air conditioning and color TV but also lacked dishwashers and clothes washers and dryers.
Spending Less of Our Budget on Necessities
The lower relative price of consumer goods has allowed American families to shift their share of consumption from goods to services and from necessities to more discretionary spending. In the 1950s, American households spent an average of 20.8 percent of their income on food and beverages for the home, 8.9 percent on clothing and footwear, and 4.8 percent on gasoline and other fuels—a combined 34.5 percent, or more than a third of household spending. By the 1970s, the combined share of spending on food, clothing, and gasoline had dropped to 25.8 percent and by the 2010s to 13.5 percent (see Table 1).
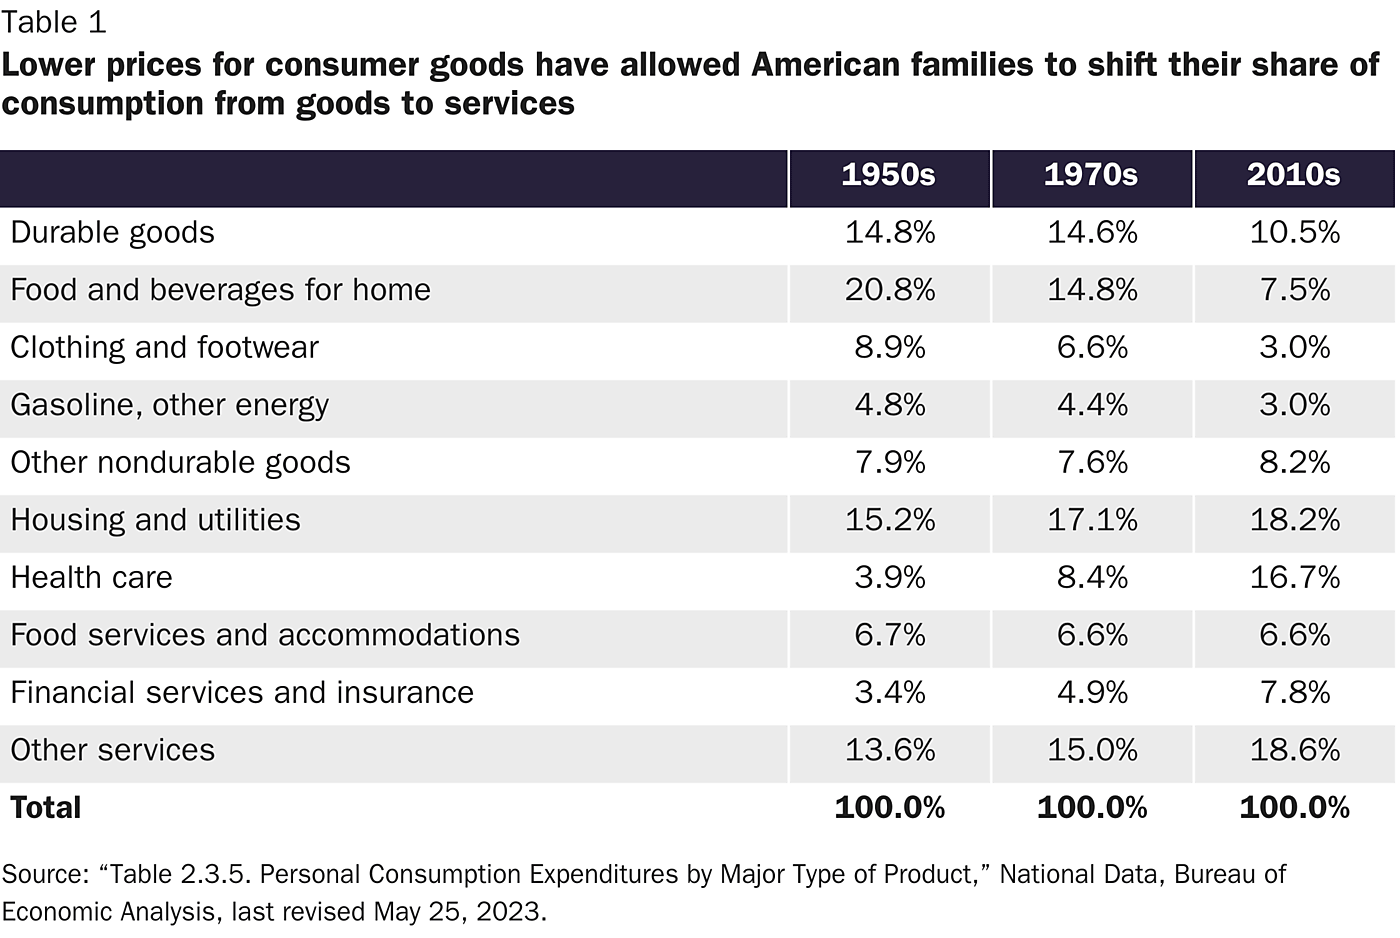
Increased access to affordable necessities has allowed Americans to spend an increasing share of our income on services such as health care, financial management, recreation, and travel. We’ve also shifted spending more to housing and utilities, from 15.2 percent in the 1950s to 17.1 percent in the 1970s to 18.2 percent in the 2010s. That modest increase has enabled Americans to live in bigger and better houses with more amenities. According to the Census Bureau, the median size of new homes sold in the United States increased from 1,645 square feet in 1979 to 2,273 square feet in 2021. The rate of homeownership has risen from 55 percent in 1950 to 66 percent today.
Populists on the left and right claim to champion the interests of blue-collar workers, yet they criticize the increased competition and lower barriers to trade since 1980 that have delivered a greater abundance of goods and services to those same people. A lower time price for popular goods means that American workers today need to work fewer hours to bring home a dishwasher, crib, TV set, or new outfit. That means more of their time and money can be devoted to acquiring other goods or services that further enhance their quality of life.
The Rising Tide of Globalization Has Lifted All Sizes of Boats
Critics of globalization may acknowledge that millions of Americans have indeed benefited in recent decades, but they say it has come at the expense of rising inequality and the stubborn persistence of poverty. But here too the past four decades of rising globalization have witnessed real progress against poverty and no overall increase in inequality in living standards among Americans.
In The Myth of American Inequality, Gramm, Ekelund, and Early show that the official poverty rate understates the gains of lower-income households because it suffers from the same inflation mismeasurement that taints the official wage and income data and because it omits major government transfers. After properly accounting for inflation and federal, state, and local transfer payments, they found that the real poverty rate in America fell from 7.2 percent in 1979 to 2.5 percent by 2017 (Gramm, Ekelund, and Early, p. 36). Meanwhile, research from economist Bruce Sacrecdote found incredible consumption gains for poorer families between 1960 and 2015. In particular, he found that American households with below-median incomes not only have more cars and bigger houses than their earlier-era counterparts but that their overall consumption (adjusted for inflation) increased between 62 percent and 164 percent over that period. Thus, poorer Americans today can consume about twice as many goods and services as their 1960s counterparts—thanks in no small part to globalization.
Official inequality figures, reflecting the widely used Gini coefficient, suffer from similar problems. After adjusting for taxes paid and transfer benefits received, Gramm, Ekelund, and Early found that the Gini coefficient has actually declined slightly (i.e., U.S. society has been becoming modestly more equal in our era of expanded globalization) since the 1950s or 1970s. The adjusted Gini coefficient was on average 0.3443 in 1950–1959, 0.3412 in 1970–1979, and 0.3384 in 2010–2017 (the most recent period available) (Gramm, Ekelund, and Early, p. 47). As the authors conclude, “Over that entire postwar period, greater transfers to lower-income households, combined with steeper taxes taken from higher-income households, have more than offset the rising inequality of earned income.”
The U.S. Manufacturing Sector Has Changed, Not Died
When they are not dismissing the real gains of U.S. workers and households in recent decades, or bemoaning the alleged rise in inequality, the critics of globalization lament the loss of manufacturing and other goods-producing jobs. They claim that manufacturing jobs have traditionally provided a pathway for less-educated and lower-skilled U.S. workers to enter the middle class. This interpretation misses the changing nature of the U.S. manufacturing sector as well as the continued growth of well-paying jobs in the services sector.
The story of manufacturing in our more globalized era is not that “Americans don’t make things anymore” but that U.S. manufacturing workers have become so much more specialized and productive. In particular, fewer Americans are employed in manufacturing today compared to the 1970s, but inflation-adjusted U.S. manufacturing output has increased dramatically over that same period, and the United States remains the world’s second-largest manufacturing nation. From 2000 to 2021, real manufacturing value-added in the United States rose by 36 percent to a record $2.56 trillion. The U.S. economy has been able to create more manufacturing value-added with fewer workers because of dramatically rising worker productivity, driven by more sophisticated equipment, more efficient production methods, a more skilled workforce, and a shift to the production of more capital-intensive goods. Today, U.S. manufacturing productivity (value-added per worker) exceeds that of Germany, Japan, and South Korea and dwarfs that of China and Mexico.
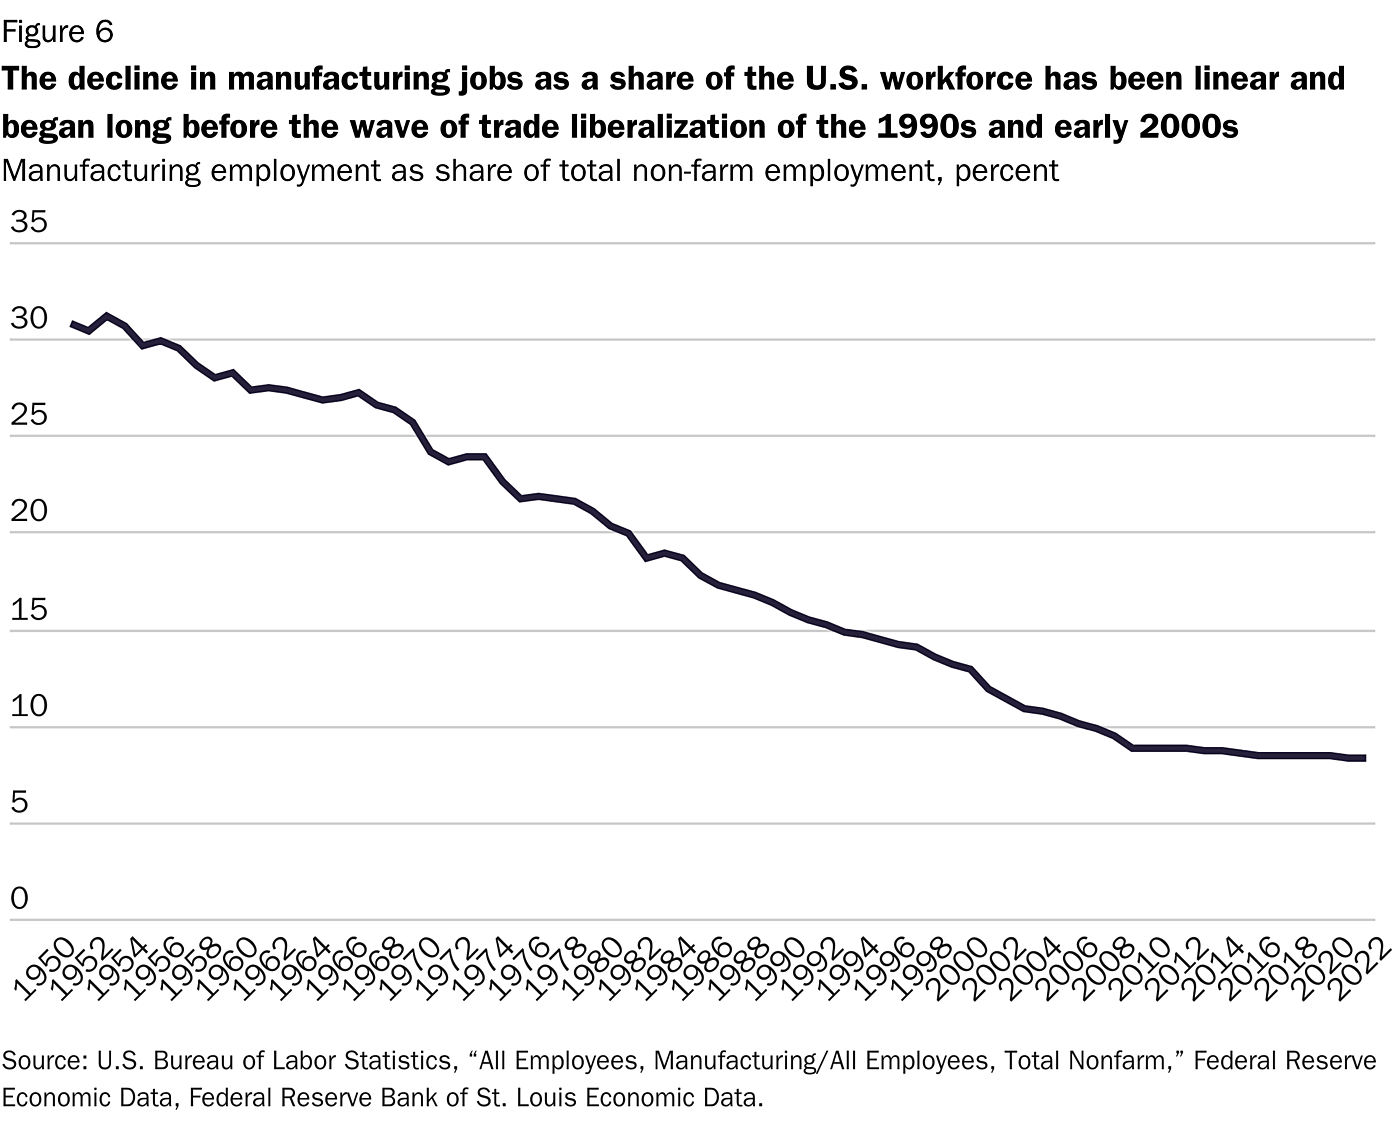
Trade and globalization undoubtedly play a role in shaping the size and composition of the U.S. manufacturing sector, but their effects should not be oversold. As Figure 6 shows, for example, the decline in manufacturing jobs as a share of the U.S. workforce has been remarkably linear and occurred throughout the supposed golden age of 1950 to 1980 and long before the United States had entered the North American Free Trade Agreement (1994), joined the World Trade Organization (1995), or granted the status of permanent normal trade relations to China (2001). This same trend has been underway with all our major trading partners, with manufacturing as a share of total employment falling over that same period in Germany, France, and Japan.
American manufacturing workers today are indeed producing less commodity steel, furniture, clothing, and footwear than they once produced, but the sector produces more aerospace products, computers, communications equipment, advanced processing chips, and chemicals. To produce those higher value-added products, the typical manufacturing workers today are better educated and more specialized in their skills than their counterparts in the 1970s or 1950s.
Many of the semi-skilled workers who filled manufacturing jobs in 1979 would not be qualified for the jobs being created in the manufacturing workplace today. As Cato’s Scott Lincicome noted last year, “As of 2021, in fact, more manufacturing workers above the age of 25 had an associate’s degree or higher (45.1 percent) than had, at most, a high school degree (40.2 percent), continuing a trend of increasing education in the sector that dates back decades.” The changing nature of the U.S. manufacturing sector means that any effort to “restore” the kind of jobs the sector offered in the 1970s would fail.
Finally, jobs lost in the manufacturing sector in recent decades have been more than offset by jobs created in the services sector and, as previously noted, accompanied by rising worker compensation. For every net job lost in manufacturing in the past three decades, a net eight new jobs have been created in the private services sector. Those include a net addition of 19 million jobs in sectors that typically pay more than manufacturing, such as business and professional services, financial activities, management, health care, and education. As Lincicome notes, however, the modern U.S. workforce also includes plenty of services jobs for working-class men: “in 2021, the number of blue‐collar, male‐dominated (60 percent or more) nonmanufacturing jobs in the United States outnumbered nonsupervisory manufacturing jobs by a nearly four‐to‐one margin.”
America’s More Liberalized Economy Delivers in Other Important Ways
Americans are also better off today in ways that are not directly captured by wage, income, and consumption data. For example:
- Workplace safety has steadily improved in recent decades, with the rate of workplace deaths down 30 percent between 1992 and 2017 and the rate of workplace injury and illness down 69 percent over the same period. A safer work environment has been driven not only by safety improvements within specific workplaces but also by a broader shift in work from heavy industry to more services-sector jobs that are inherently less dangerous.
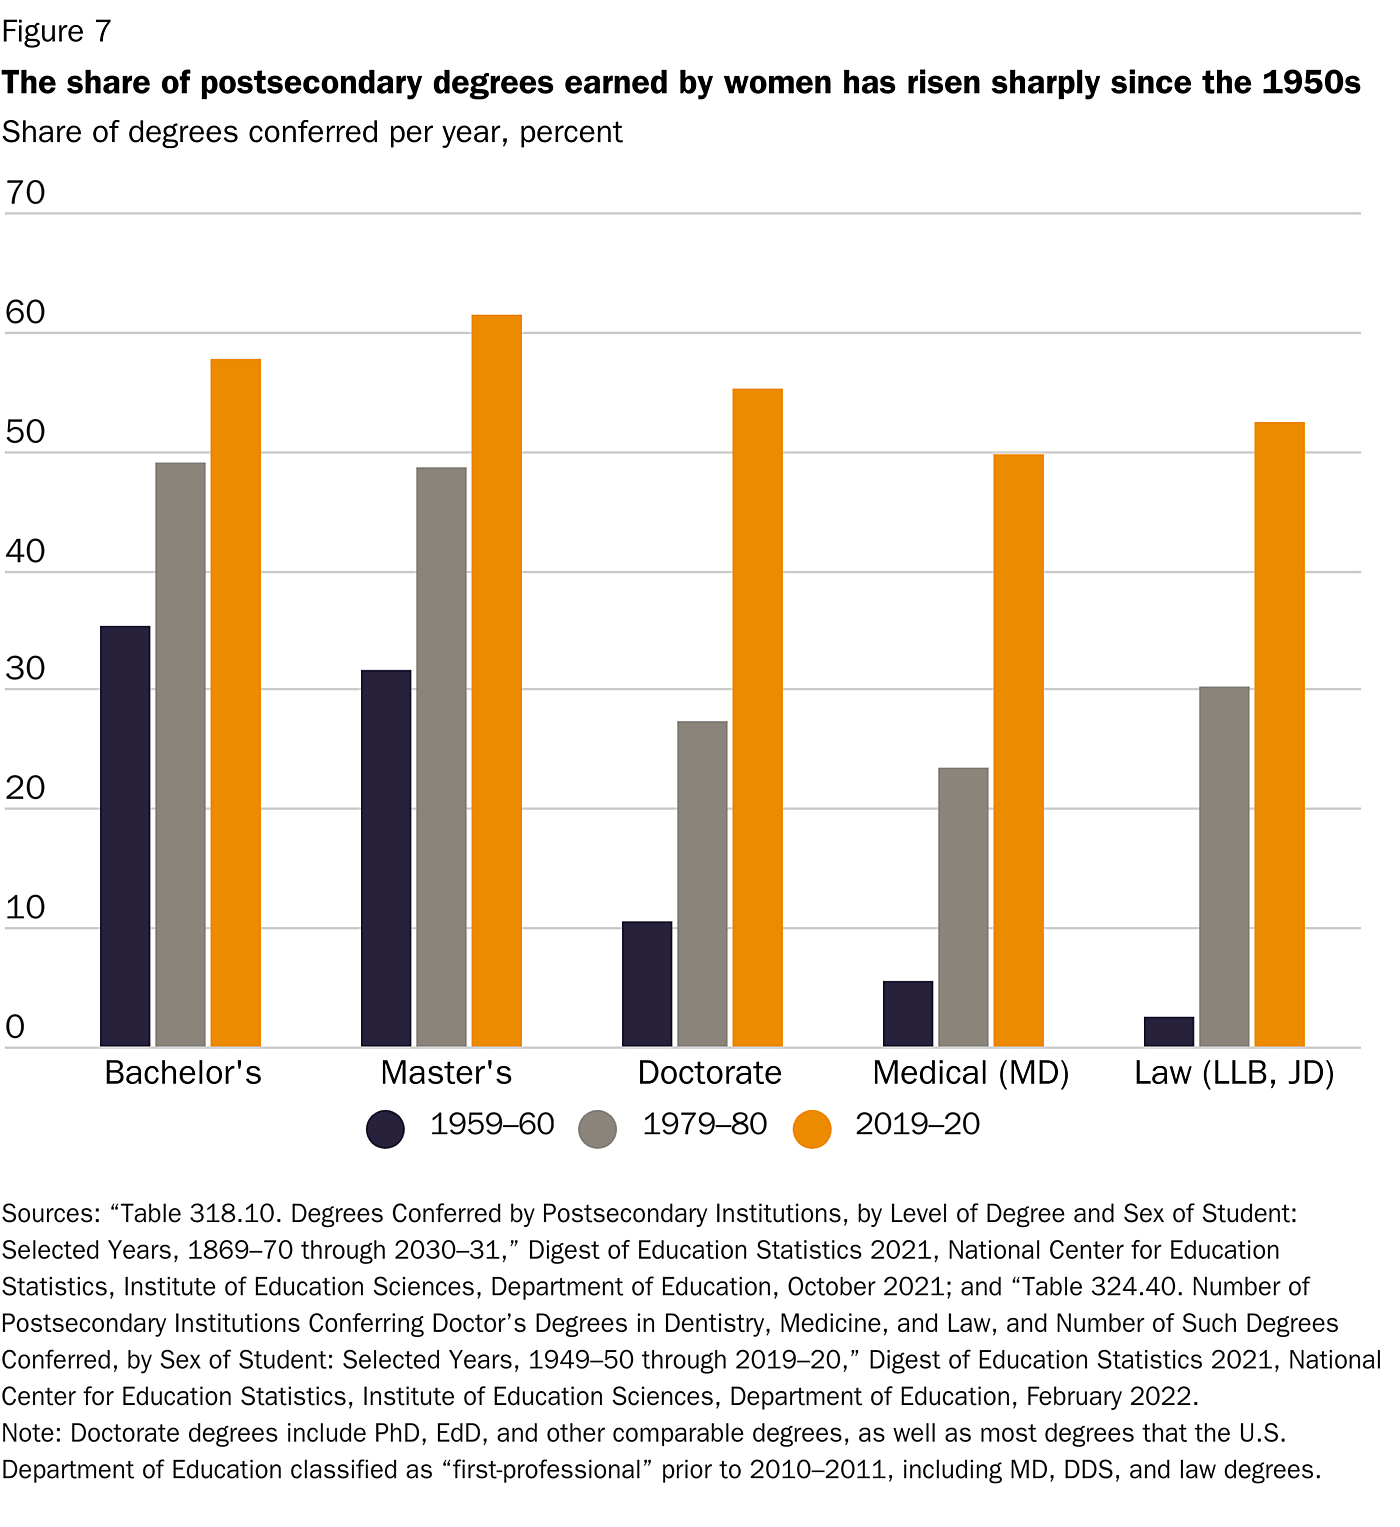
- Women have joined the workforce by the millions since the 1950s and fill a much wider range of occupations, not only because they are better educated (see Figure 7) and find less discrimination in the workplace but also because they have been freed from time-consuming tasks at home by all those modern appliances that have become available and dramatically more affordable in our modern, more globalized economy.
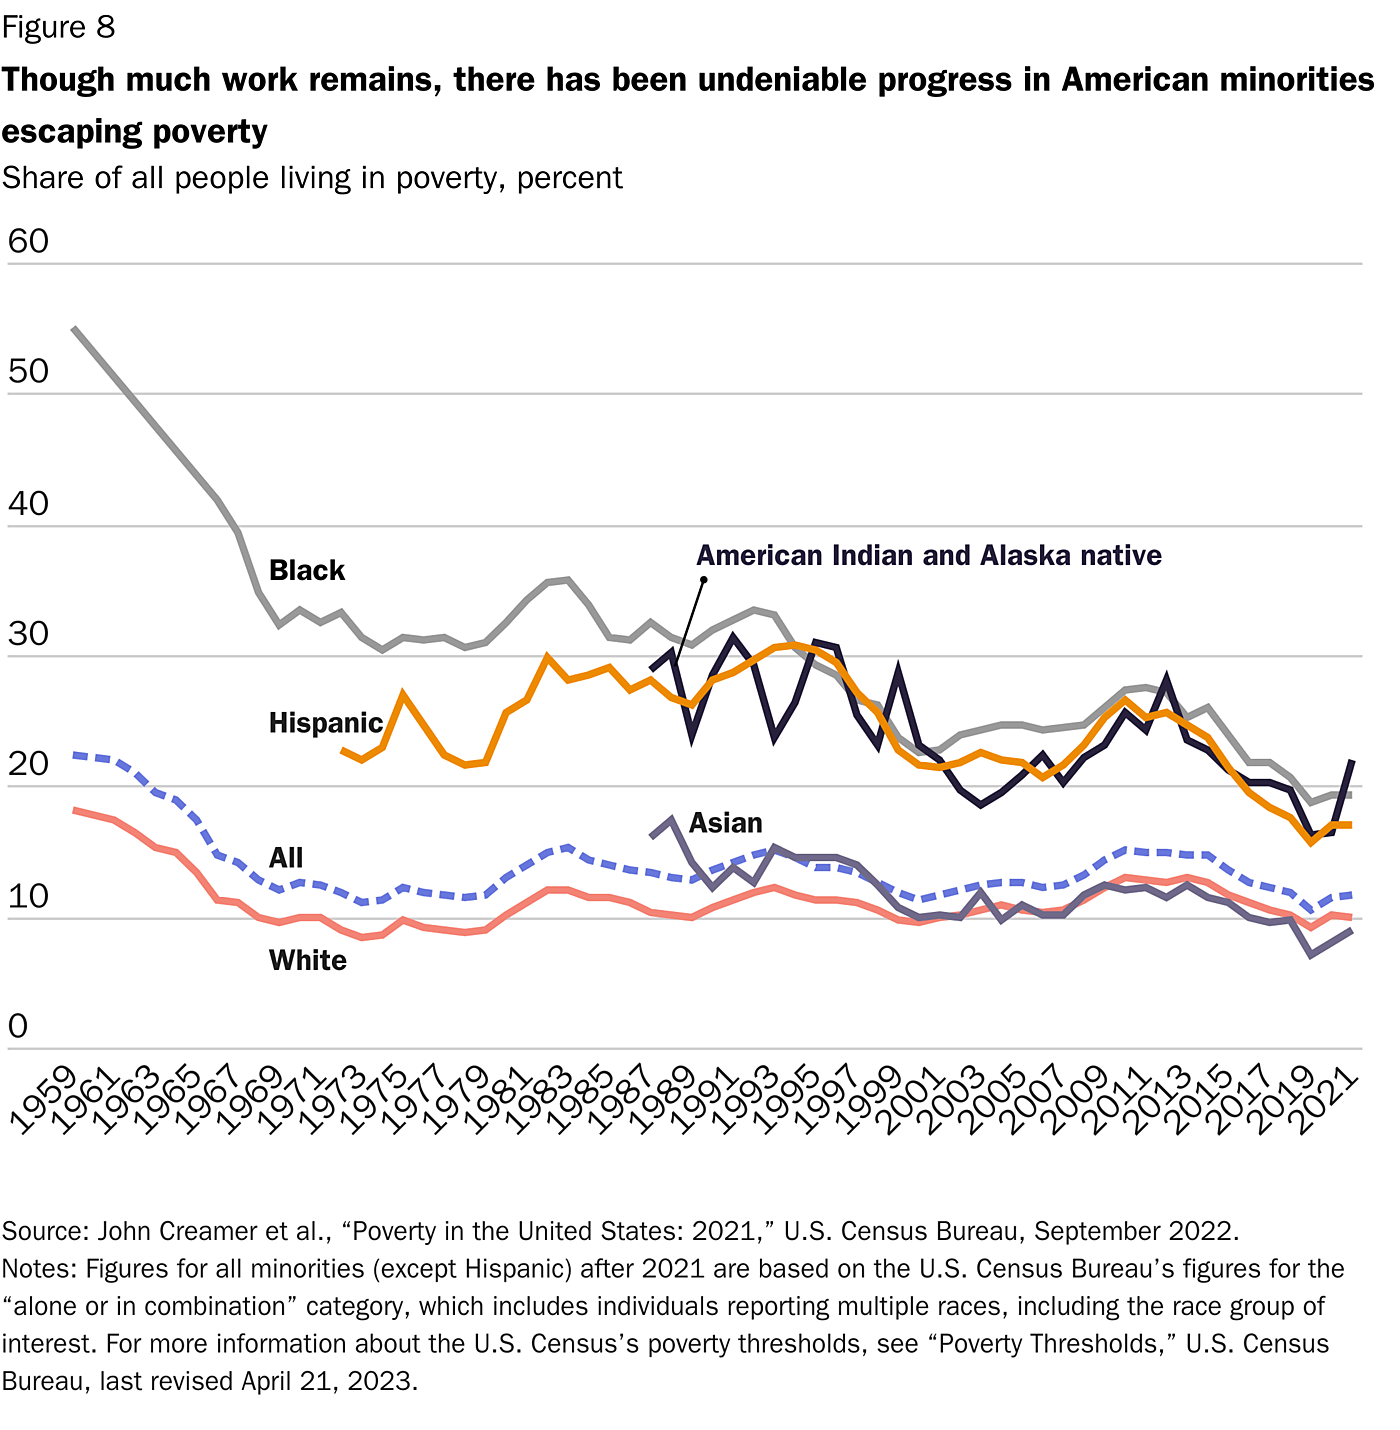
- Life for racial minorities also has significantly improved since the 1950s. As shown in Figure 8, for example, the poverty rate for black Americans declined from approximately 55.1 percent to 19 percent between 1959 and 2021. (After accounting for consumption and transfers, of course, this improvement would be even better.) The share of low-income black households fell from about 55 percent in 1967 to 37 percent in 2021, while the share of higher-income black households increased from 4.1 percent to about 22 percent over the same period. Hispanics have made similar progress since the 1970s. And while only 4 percent of Americans surveyed by Gallup in 1958 approved of interracial marriage, 94 percent do today.
- As the website Human Progress documents, an American born in the mid-1970s has over his lifetime experienced significant, long‐term improvements in life expectancy, infant mortality, food supply, education, and environmental quality. Gains since the 1950s are even larger. Death rates from cancer in the United States fell by 32 percent between 1991 to 2019, saving 3.5 million lives. The United States has also experienced substantial gains in both air quality and water quality since 1970.
Conclusion
When we consider the progress that has been made in the past 50 years—in living standards, equality in household consumption, worker safety, and opportunities for women—the nostalgia for a less globalized past is difficult to understand. As Gramm, Ekelund, and Early, summarized in their book, “In short, by virtually any physical definition of economic well-being, working Americans across all income levels, racial classifications, education levels, and other commonly used statistical classifications are substantially better off today than they were in 1972” (Gramm, Ekelund, and Early, p. 85).
If Americans want to extend and revitalize the kind of progress we have enjoyed since the 1970s, the answer is not to turn back to a more protected and regulated U.S. economy but to promote policies that open the U.S. economy to more domestic and international competition and more choice in the marketplace for U.S. workers and families.
About the Author


This work is licensed under a Creative Commons Attribution-NonCommercial-ShareAlike 4.0 International License.