
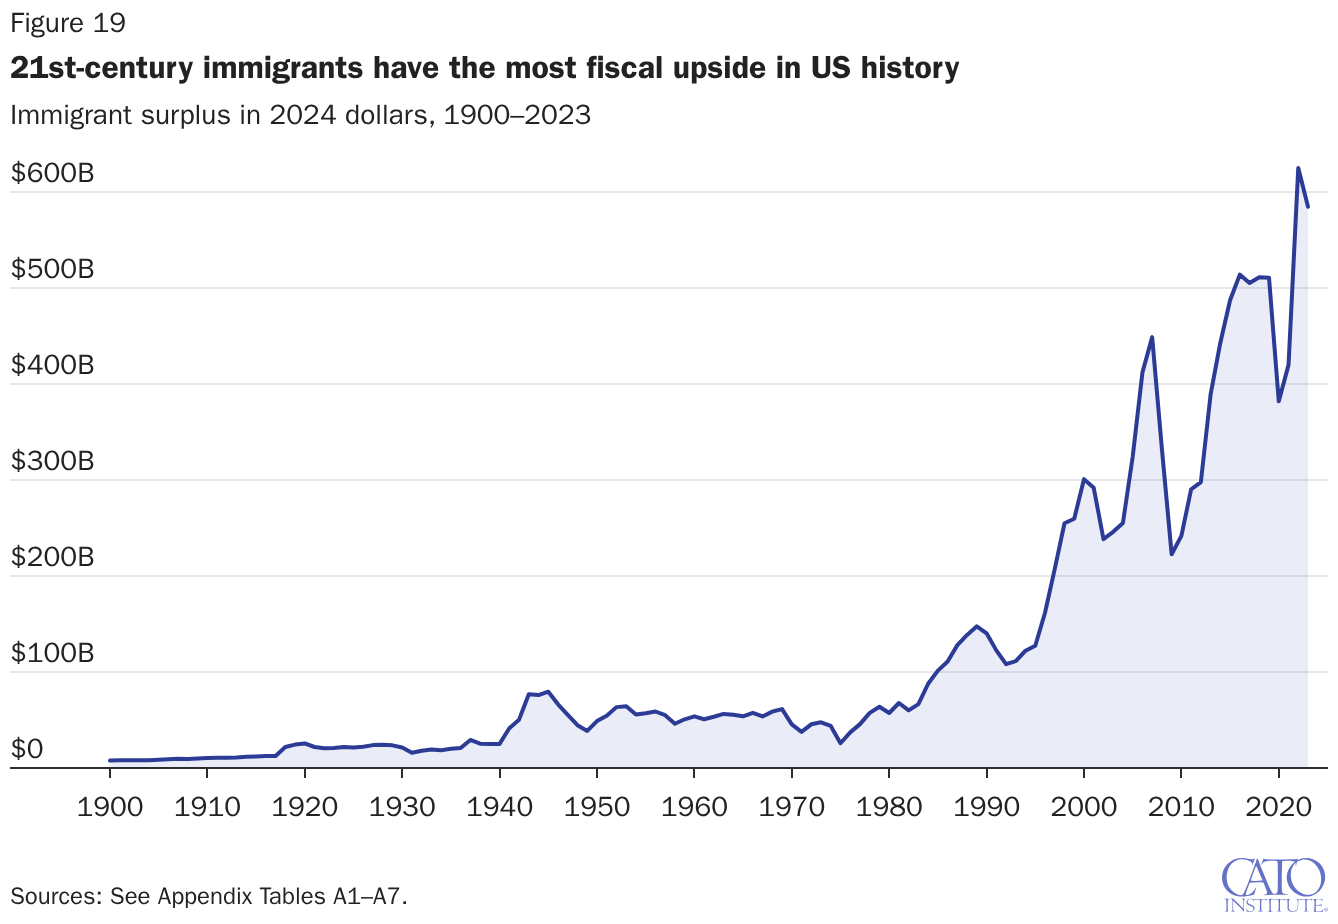
Critics of immigration often claim that it was once fiscally positive for the United States but that the welfare state ended the fiscal upside. Contrary to this perception, this paper details how immigrants have reduced federal, state, and local government deficits every year for the last 124 years by a cumulative $14.6 trillion—not counting savings on interest payments on a smaller debt. As a share of gross domestic product (GDP), the immigrant surplus was more than twice as fiscally beneficial in 2023 as in 1913—before the modern welfare state and individual federal income tax. In inflation-adjusted terms, immigrants were 53 times more beneficial to public budgets in 2023 than in 1913.
Although government spending has increased over the course of the 20th century, tax revenues have also increased. Before World War I, state and local governments drove the government deficit, as opposed to the federal government today, and all levels of government spent less of their budgets on pure public goods, so the share of spending that needed to scale with population was higher back then. But the most important difference is that immigrants today are vastly more productive—and thus pay more in taxes per capita in inflation-adjusted terms—than those in 1913, creating a much larger net fiscal surplus. Congress should build on this success by further limiting the scope of the welfare state and expanding legal immigration.
Introduction
About 130 million immigrants have come to the United States since 1776, contributing to the country’s fiscal and economic well-being.1 Nonetheless, many people believe that although immigration was helpful to the country in the past, the welfare state has now eliminated, or at least reduced, that benefit because of the cost of government services and payments to immigrants.2 Although studies have recently demonstrated that immigrants are still fiscally positive today, no study has attempted to calculate allocations of government spending to immigrants and natives every year of the 20th century to show how this fiscal benefit has changed over time.3
This study calculates the fiscal benefits of immigration over more than a century by building on the extremely detailed findings of a Cato Institute 2026 report on the fiscal effects of immigrants. That report used a fiscal accounting model based on one used by a study published by the National Academies of Sciences, Engineering, and Medicine in 2017 and applied it to a 30-year period from 1994 to 2023.4 The Cato Institute–National Academies model is based primarily on granular survey data from the Census Bureau’s Current Population Survey (CPS) Annual Social and Economic Supplement (ASEC) on the use of government benefits by immigrants and the US-born population. The CPS ASEC also imputes tax payments to specific individuals, using tax data from the Internal Revenue Service and state sources.
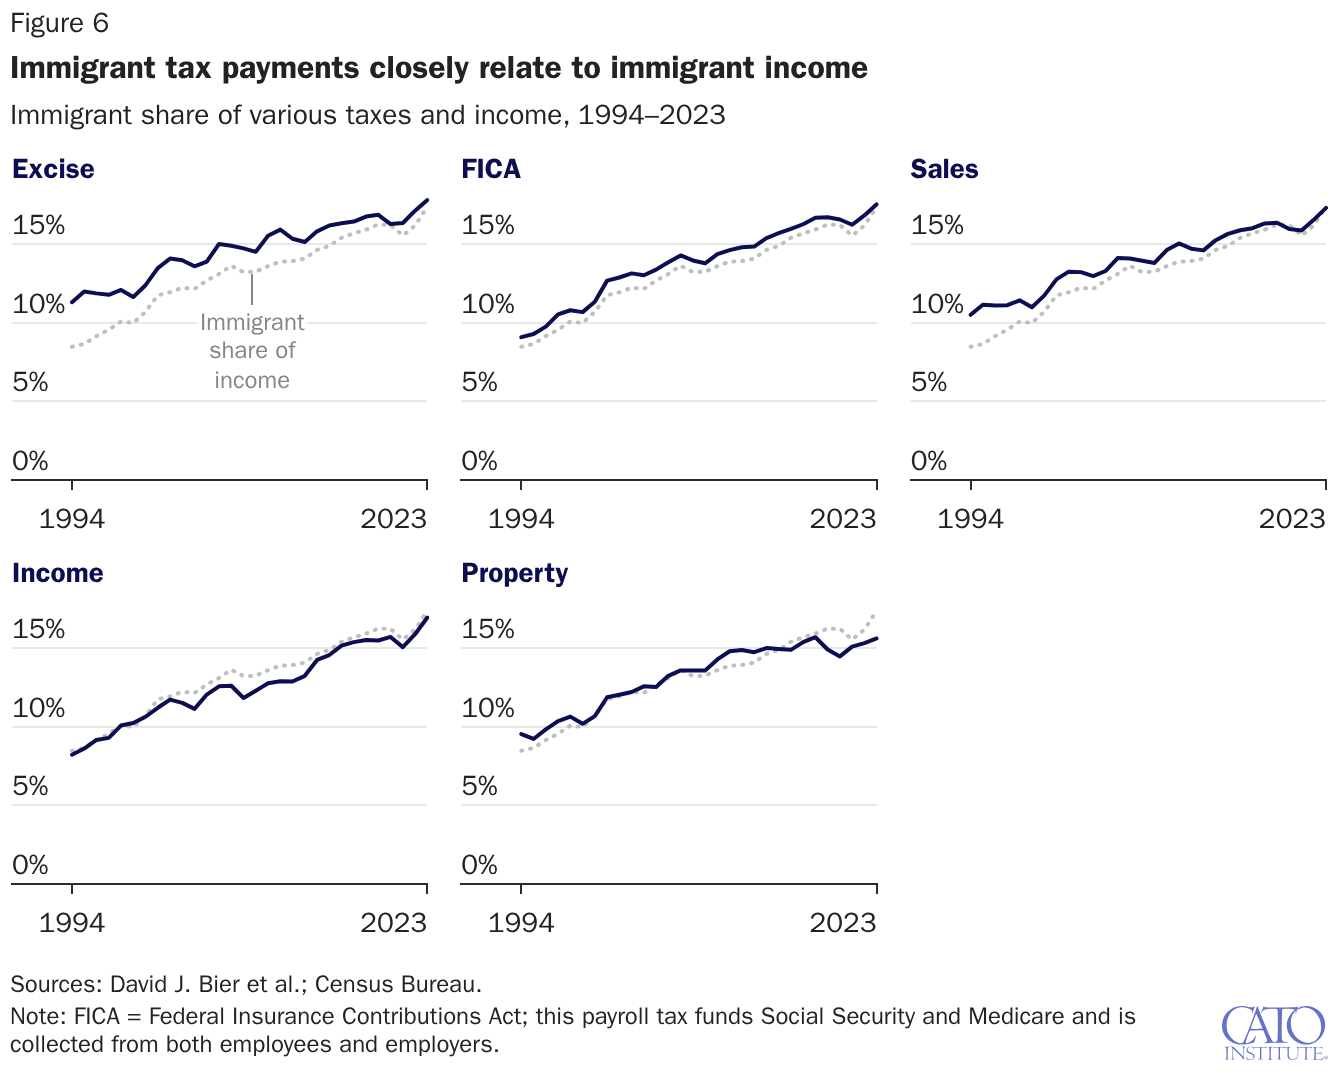
This analysis shows that the immigrant population’s share of tax payments corresponded closely to its share of income in each of these 30 years. General tax data from the IRS indicate that this relationship likely also existed before 1994. By apportioning taxes based on the share of income, this study identifies the taxes paid by immigrants throughout the 20th century. It uses similar proxies for government benefits streams (e.g., immigrant share of the population in schools for education spending).
Immigration would be even more fiscally positive if immigrants, who currently are ineligible for many welfare benefits, were entirely ineligible, but it is incorrect to conclude that immigrants are, therefore, fiscally negative. In fact:
- Immigrants accounted for a disproportionate share of earned income almost every year from 1900 to 2023.
- Immigrants paid more in taxes to every level of government than they received in benefits from government every year since 1900.
- Immigrant revenues exceeded benefits by $14.6 trillion in inflation-adjusted terms since 1900, excluding savings on interest payments on less debt.
- The total immigrant surplus in 2023 was more than twice the surplus in 1913 as a percentage of US GDP.
- In real inflation-adjusted terms, the immigrant surplus in 2023 was more than 53 times larger than in 1913: $585 billion versus $11 billion (Figure 1).

Including immigrants’ US-born dependents does not substantively change these major conclusions. This accounting also does not include any indirect effects of immigration on the productivity or tax payments of the US-born population, which would increase the positive effect.5 Nor does it calculate the enormous savings on interest payments on the debt that would have accrued over the last century if not for immigrant workers, which we cannot calculate because they would exceed the size of total US debt.
Despite receiving more benefits, today’s immigrants are more valuable to governments because they pay even more in taxes than their predecessors. Tax payments are higher both because tax rates are higher and because immigrants are much more economically productive than immigrants were a century or more ago. When immigrants come to America and work, they help make the country a wealthier and more prosperous place. Congress should reform outdated laws that restrict immigration based on the false premise that immigrants are economically harmful.
An Additional Person’s Effect on Budgets
The view that immigration has become less fiscally positive in the United States starts from three accurate premises, but it draws an unjustified conclusion. First, government spending has increased dramatically since the 1910s. Figure 2 displays all US government spending—federal, state, and local—broken down into major component parts from 1900 through 2023 as a percentage of gross domestic product, documenting a rise from less than 10 percent to more than 30 percent of GDP. Second, it is correct that, as Figure 2 illustrates, the category of social services, or “the welfare state,” was the primary driver of spending growth in the 20th century.

Third, it is accurate that the welfare state has made immigration less economically beneficial today than it would be if the welfare state had stayed as small as it was in 1910.6 But this does not mean that immigration is harmful and that the United States would be better off without it. For one thing, people’s fiscal effects are not equivalent to their economic effects. The fiscal effect is only a subset of their overall economic effect. People with zero effect on US government budgets likely have very positive economic effects in their roles as workers, consumers, entrepreneurs, and investors. Even someone with a negative fiscal effect can have a positive economic effect by expanding consumer or producer surplus or by increasing wages through consumption, investment, entrepreneurship, or labor complementarities.7
Regardless, higher government spending today does not automatically reduce immigrants’ fiscal benefit because tax revenues have also increased. As Figure 3 shows, the government imposed new taxes—income taxes and social insurance taxes (such as for Medicare, Social Security, and unemployment)—that have compensated for the rise in welfare spending over the last century. Thus, while it is correct that the government has grown dramatically, that does not mean that the net fiscal benefit of immigrants after taxes has declined proportionally to the increase in spending.

Admittedly, taxes have not covered all spending, which led to deficits during most years in the last century (Figure 4). For the purpose of analyzing immigration, however, what matters is the cost of the marginal, or next additional, person added to the society. The marginal cost is much lower than the average cost because a significant share of government spending is on pure public goods (Figure 4), meaning items for which additional people do not reduce the benefit to anyone else or trigger additional spending. If we exclude spending on pure public goods and focus only on government benefits, the net fiscal impact of the average person—and hence the true fiscal impact of the marginal person—has been positive every year since 1900, except for four years in the 21st century (2009–2010 and 2020–2021) during global economic crises.

The pure public goods categories are shown as the top three categories in Figure 2 and are combined in Figure 4. They are defined here to include the following:
- national defense, including benefits for former military personnel and foreign affairs (12.9 percent of total 2023 spending);8
- spending on general science, space, technological research, and subsidies (1.5 percent of spending);9 and
- interest on past debt (13.5 percent of spending).10
Immigrants certainly do benefit from pure public goods spending, so sometimes analysts will include that spending as benefits to immigrants in certain scenarios, depending on the point of the analysis.11 However, since such a reallocation lowers the fiscal cost of natives, the net effect of immigration overall is the same. As the National Academies report observes, the natural-born citizen’s fiscal cost “would have been larger without the addition of the first generation group because federal expenditures on public goods … would have to be divided among a smaller population. Some argue that this is an important benefit of immigration.”12
There is no doubt that a country with a larger population can spend more on the military, but whether any of that increase is the result of a larger immigrant population remains unproven. Indeed, there is no empirical connection between these two, and the available academic literature on defense spending does not connect population growth—immigrant or otherwise—to increased defense spending.13 In fact, defense-related spending per capita has generally fallen since the mid-1940s and mid-1950s, indicating that the additional population has, in practice, not led to any measurable increase in this category of spending in the last generation.14 Thus, if the early 20th-century immigrants supposedly caused a portion of the increase in per capita defense spending from 1900 to 1945, but recent immigrants did not have the same effect—as indicated by declining per capita spending—the fiscal effects of early 20th-century immigrants would seem relatively worse. In any case, if a portion of the immigrant surplus is used to fund more defense spending, the fiscal surplus still exists and is providing a fiscal benefit to the United States.
Overall, this treatment of pure public goods spending is conservative. Economists often consider other items to be pure public goods spending, such as spending on the legislative branch, the White House, general government administration, and other expenditures where the costs are unrelated to population size.15 Likewise, the assumption that there is always a direct increase in spending in other areas that theoretically should increase with more population is likely too strong. For instance, a larger labor force should logically lead to more spending on minimum wage enforcement by the Department of Labor, but in fact the Wage and Hour Division budget has remained flat for a decade and a half in real terms.16 Regardless, this paper is primarily comparing immigrants to immigrants between periods, so it is more important to use consistent methods of analysis across time.
An Immigrant’s Effect on Budgets
Figure 4 shows that the government almost always received more in tax revenue than it spent on benefits—that is, spending on everything except pure public goods. This provides a starting point for concluding that the effect of immigration on government budgets has been positive throughout American history and that the effect today is at least not worse than before the welfare state. But is the effect of an immigrant generally higher or lower than the effect of an average additional person? Building on a model used by the National Academies report, the Cato Institute has answered this question for the period 1994–2023.17 During that time, the Census Bureau’s Current Population Survey Annual Social and Economic Supplement published detailed estimates of taxes paid and benefits used by immigrants.
Before 1994, the Census Bureau did not publish regular estimates of immigrant tax payments (which rely on estimates for individuals using actual tax receipts, not self-reporting).18 The 1994–2023 estimates confirm a tight correlation between the immigrant share of income and the distribution of taxes, implying that the distribution of total income can be used as a close approximation of total taxes paid.
Figure 5 shows this recent relationship between taxes and income alongside the immigrant share of the population.19 The 1900–1930 censuses did not record income or wages directly, so we used the proxy OCCSCORE, which assigns a value using the median wage of each occupation in 1950.20 This was used to estimate the immigrant share of total earned income, rather than its absolute value. The assumption is that we can substitute occupation-based earnings for individual income because even if the absolute level changes, the relative value of the work will remain similar. The OCCSCORE is necessary because, before 1940, the census did not collect income data at all, and OCCSCORE—developed specifically to fill this gap—has become the standard tool in economic history for measuring immigrant earnings in this period.21
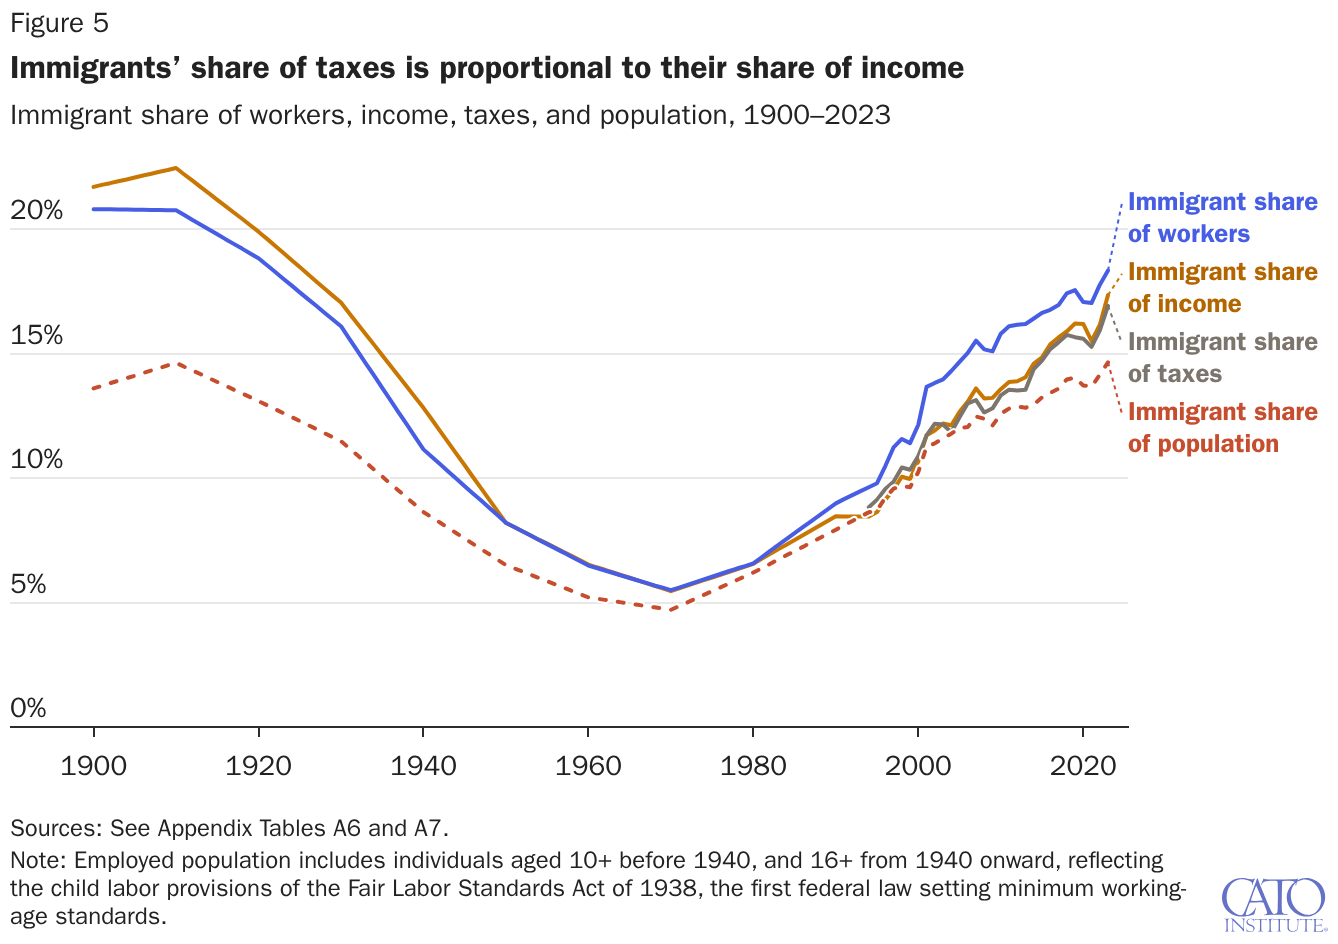
As Figure 5 shows, early 20th-century immigrants’ estimated share of income exceeded their share of workers, implying that they worked in higher-income occupations during that period. The primary reason, however, that they had such a disproportionate share of income was their high rates of employment because they were more likely to be of working age during that time.22 In real inflation-adjusted terms, immigrants’ estimated contribution to GDP—based on their share of income—increased from $280 billion in 1913 to $4.8 trillion in 2023.
Figure 5 implies that immigrants were responsible for a higher-than-average share of taxes almost every year for more than 120 years, as their share of income predicts their share of taxes. That outcome might be surprising since immigrants have had lower hourly earnings in recent years, but it becomes less mysterious after accounting for immigrants’ high employment rate. Immigrants can earn lower hourly wages, but they account for more total income per capita than natives because they have been more likely to work every year for over a century. In 2023, immigrants had an employment-to-population ratio (the share of the total population that is employed) 14.6 percentage points higher than that of US-born Americans. In 1910, that same gap neared 20 percentage points.23 This is primarily because the share of the immigrant population in their prime working years has usually been higher than that of the US-born population.
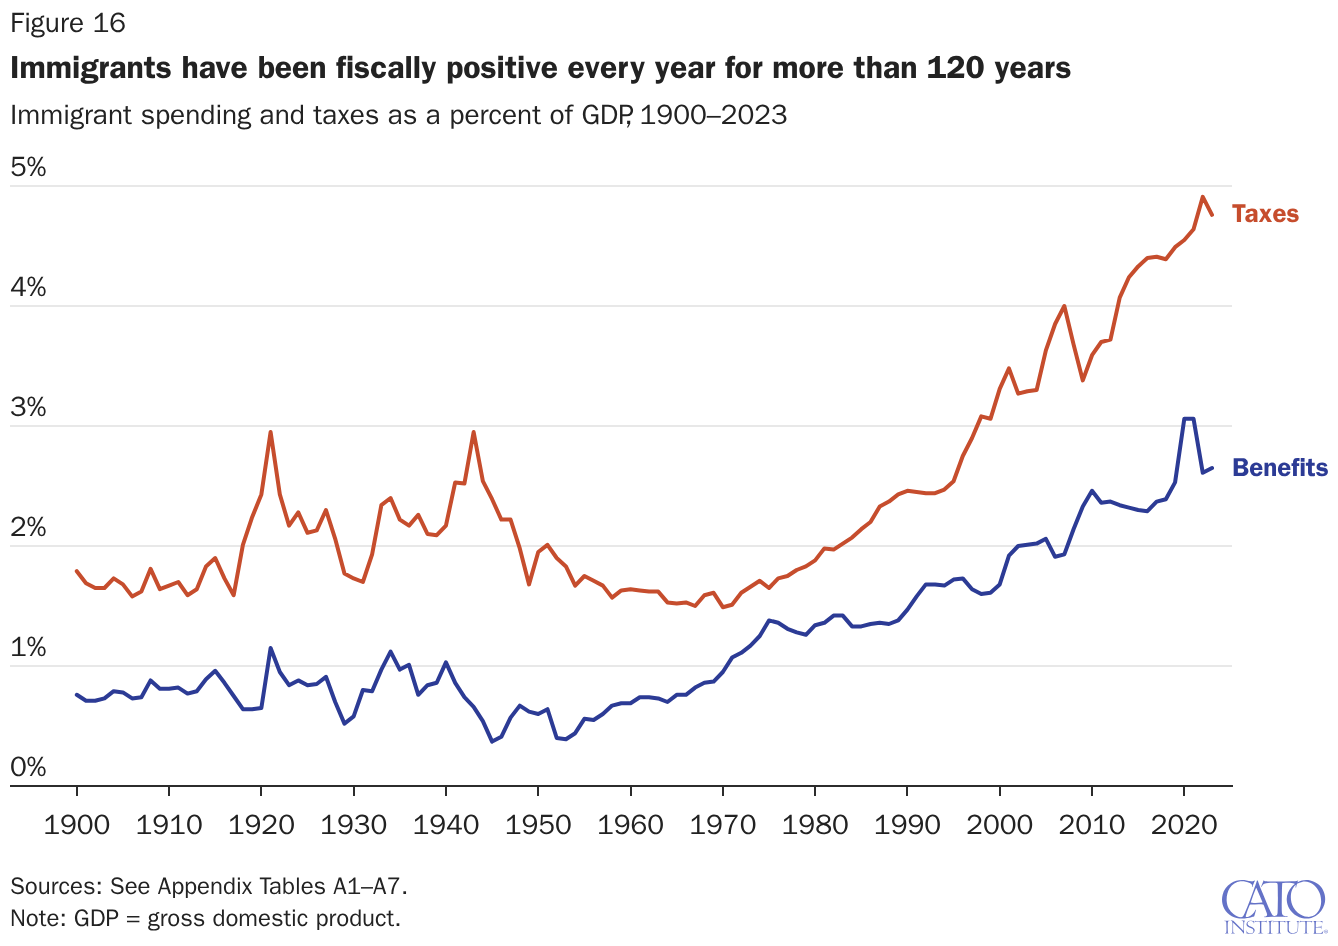
Just accounting for higher tax revenues shows that since 1900, immigrants likely had tax payments about 27 percent higher than those of the average person in the country. Although the tax system has become more progressive since the 1950s, the best evidence indicates that effective tax rates across the income distribution in earlier periods were not sufficiently different from those in the 1990s to undermine the relationship between income and taxes.24 Regardless, this uncertainty is not a serious limitation of this analysis because immigrant tax payments exceeded their benefit spending by a wide margin during the midcentury (Figure 16), so the positive effect of immigration would not be in question even if immigrant taxes were somewhat lower during that period. In any case, there were few immigrants in the United States at the time (Figure 5), and our main comparison is with the early 20th century.
In 1913, the largest single source of government revenues by far was state and local property taxes, which accounted for nearly half of all receipts (Figure 3). “Other” revenue combines various minor sources, primarily excise taxes, tariffs, and sales taxes. In the Cato Institute–National Academies analyses, which leverage the CPS ASEC tax model, immigrants’ share of property taxes also closely tracks their income. As seen in Figure 6, the immigrant share of property taxes more closely tracks the immigrant income share than income taxes do.25 This was also true in the 1970s.26 There is no reason to suspect that using income as a proxy for taxes significantly biases this analysis one way or another.
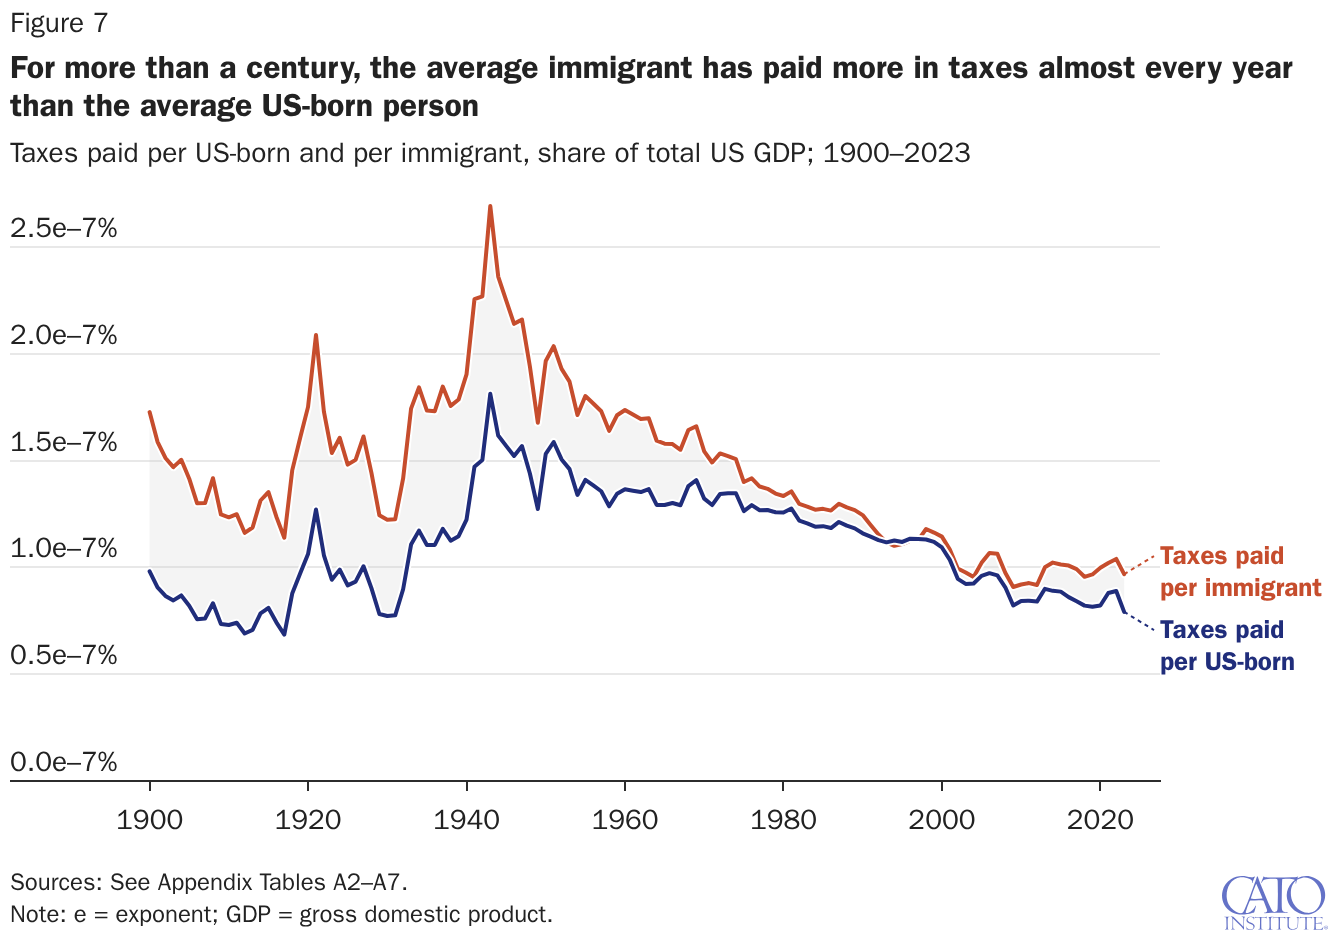
Using the immigrant share of income as a proxy for taxes paid shows that, for almost every year of the 20th and early 21st centuries, the average immigrant paid more in taxes than the average US-born resident (Figure 7).
Of course, taxes are only half the ledger when determining the fiscal effects of immigration. Did immigrants receive a larger-than-predicted share of government benefits? From 1994 to 2023, the Cato Institute–National Academies model finds that the average immigrant used fewer benefits than the average person every year. Recall that benefits are broadly defined to include all government spending that is not pure public goods.
Immigrants in this calculation are deemed to add to spending on everything from welfare (based on value received), to schools (based on enrollment), to highways and parks (at their share of the population). Overall, immigrants used fewer benefits than their population share would predict in every year: 18 percent fewer in 1994 and 25 percent fewer in 2023.
Figure 8 shows the immigrant share of government benefits by type, according to the Cato Institute–National Academies model.27 The three main causes of lower immigrant benefit use from 1994 to 2023 were lower-than-average use of old-age benefits (39 percent of benefits in 2023), educational services (12 percent of benefits), and lastly, prisons, felony police, and felony courts (2 percent). Despite being poorer than average, immigrants have used close to their population share of welfare benefits (31 percent of benefits) and other spending (mainly things such as roads, parks, fire protection, and misdemeanor or civil law enforcement, which are attributed on a per-person basis).
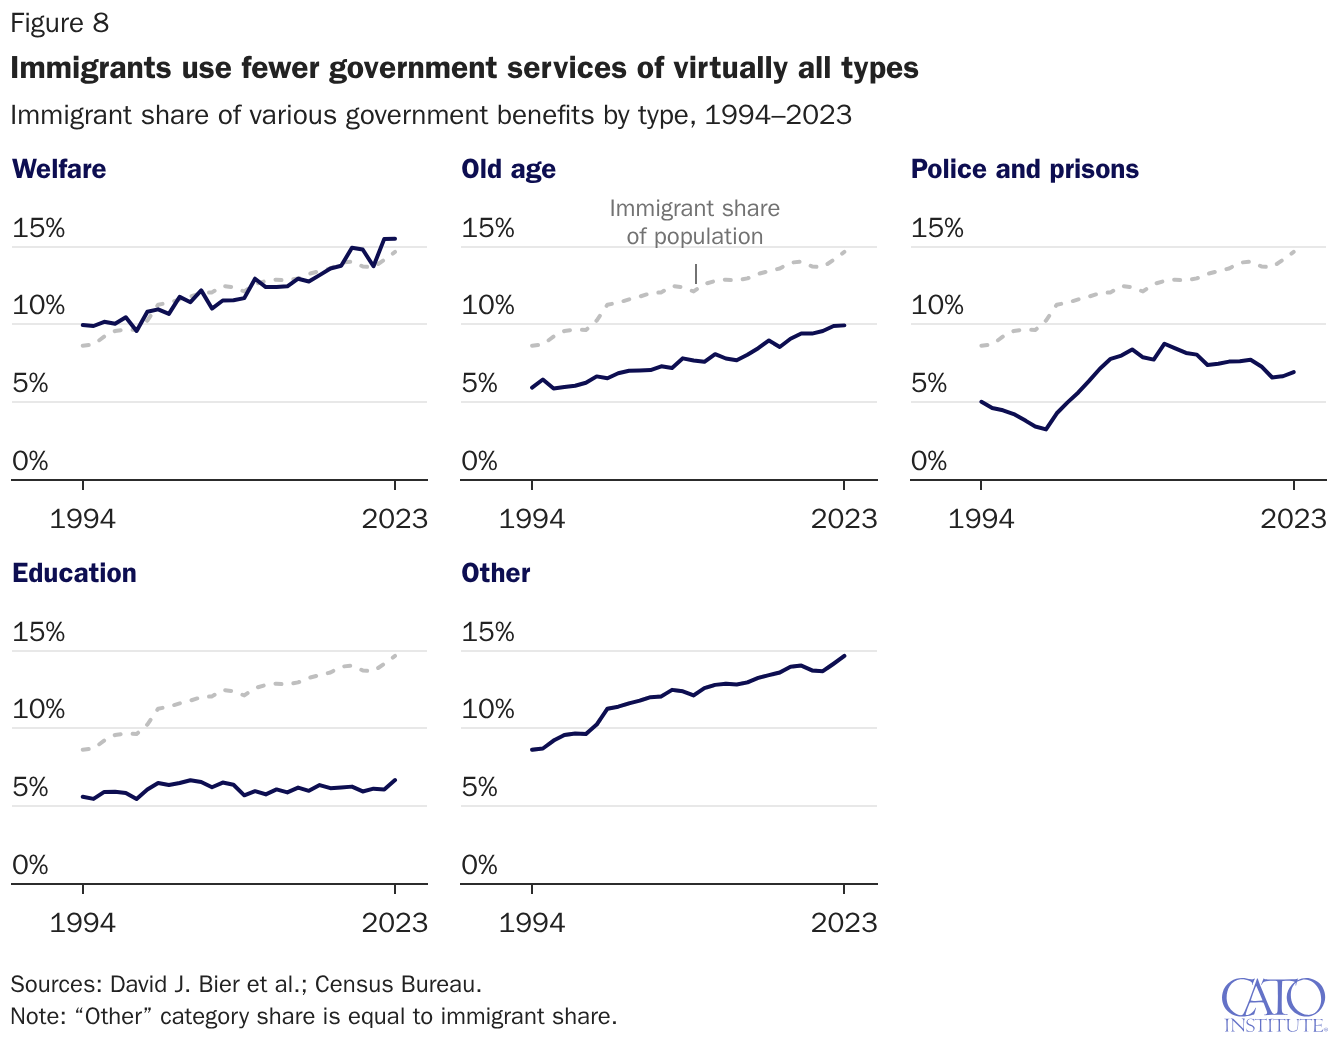
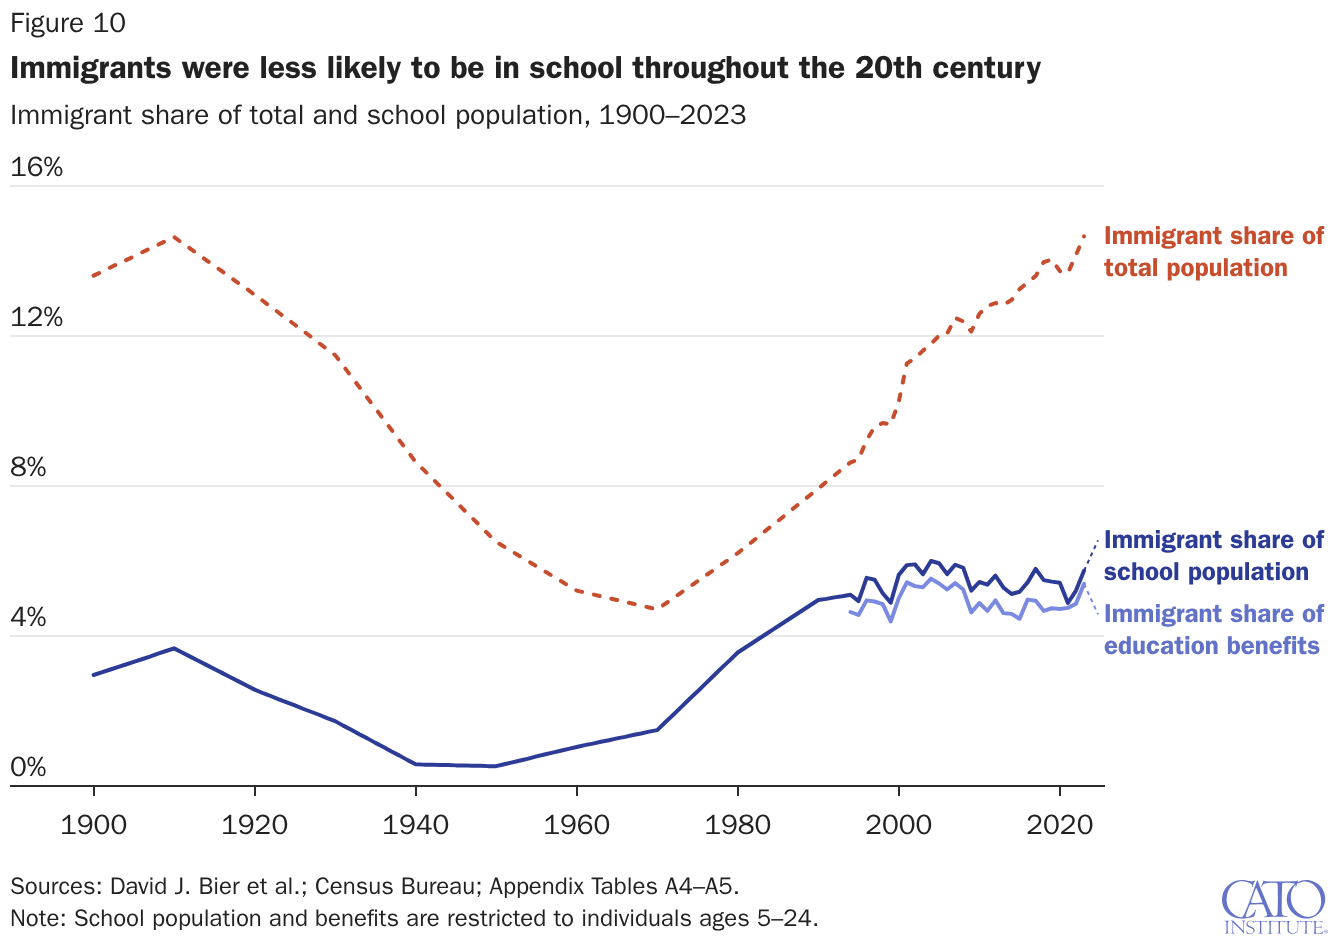
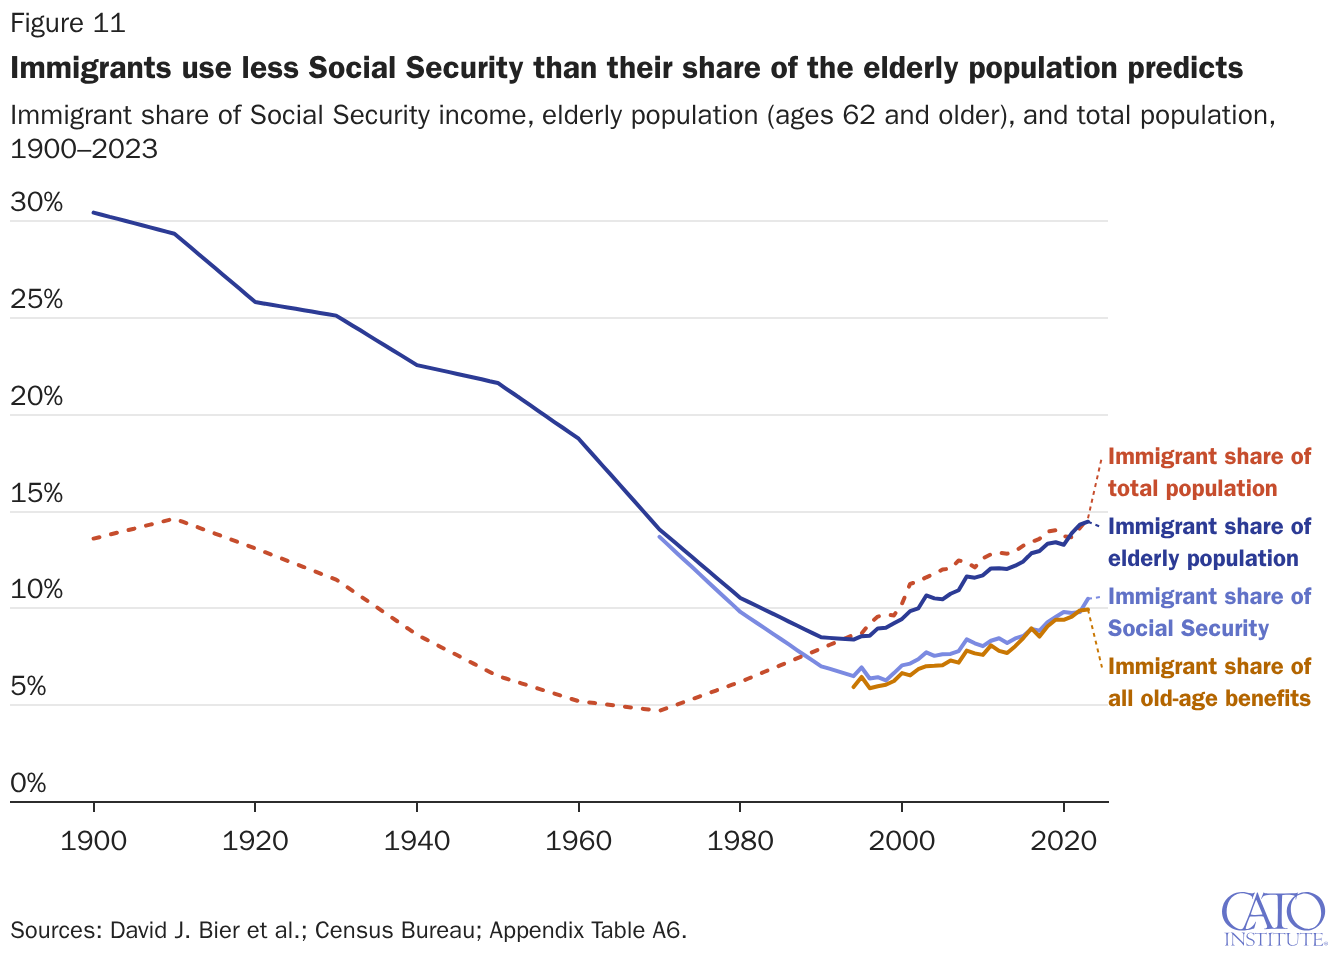
Immigrants have recently used fewer police, court, and prison resources because they have been less likely to commit crimes and end up incarcerated in US prisons (Figure 9).28 Why do immigrants use fewer old-age benefits and educational services? Part of the reason is that more immigrants arrive during their prime working years than when they are school-age children or elderly. Age fully explains the drop-off for educational services (Figure 10).29 But age does not fully explain it for old-age benefits. Although the difference has grown recently, immigrants were significantly less likely to use old-age benefits than their share of the elderly population would predict back in 1994 (Figure 11).30
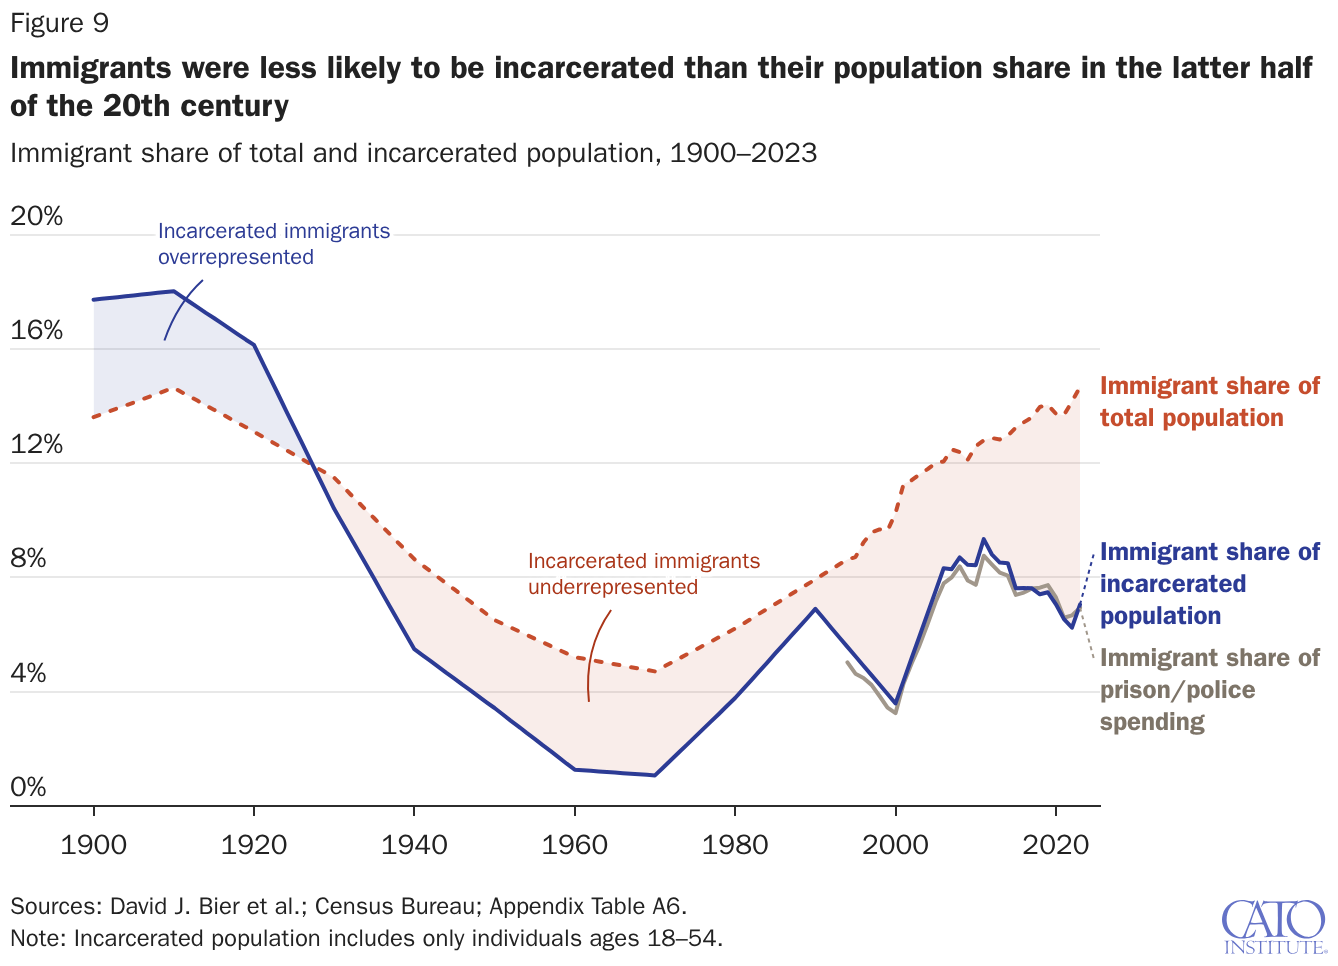
Did these conditions hold in the early 20th century? Generally yes, with some exceptions. Figure 9 shows that immigrant share of the incarcerated population has recently been below the immigrant share of the total US population, meaning that they are underrepresented in prisons, jails, and detention facilities. Data limitations for recent surveys require us to use only prisoners between the ages of 18 and 54, but this accounts for nearly all prisoners.31 From 1960 to 2022, immigrants were between 13 percent and 77 percent less likely to be incarcerated than their population share. But in the early 20th century, they were proportionally more likely to be incarcerated than their share of the population. After controlling for age and sex, early 20th-century immigrants were also less likely to be incarcerated, but the interest here is only in apportioning costs in a specific year, not measuring criminality.32
Immigrants have also been less likely to be in school throughout the century (Figure 10), primarily because they mostly arrived as adults. Although immigrants were more likely to attend private schools in the early 20th century, private enrollment was too small a share of students for this fact to meaningfully affect our analysis.33
In the early 20th century, there were no old-age-specific programs (except for veterans’ pensions, which are included in pure public goods). We have data on Social Security income back to 1970, and as Figure 11 shows, immigrants used benefits in amounts about equivalent to their share of the elderly population in 1970. The share of Social Security income closely approximates the share of old-age benefits more broadly (Medicare and public pensions). Figure 11 also shows that our results are not based on a static illusion, which would reverse if we looked at an individual’s lifecycle, because immigrants were never significantly underrepresented in the elderly population. Moreover, if we reweight the 2023 population using the 1910 census age distribution, it actually increases the net fiscal effect for 2023.
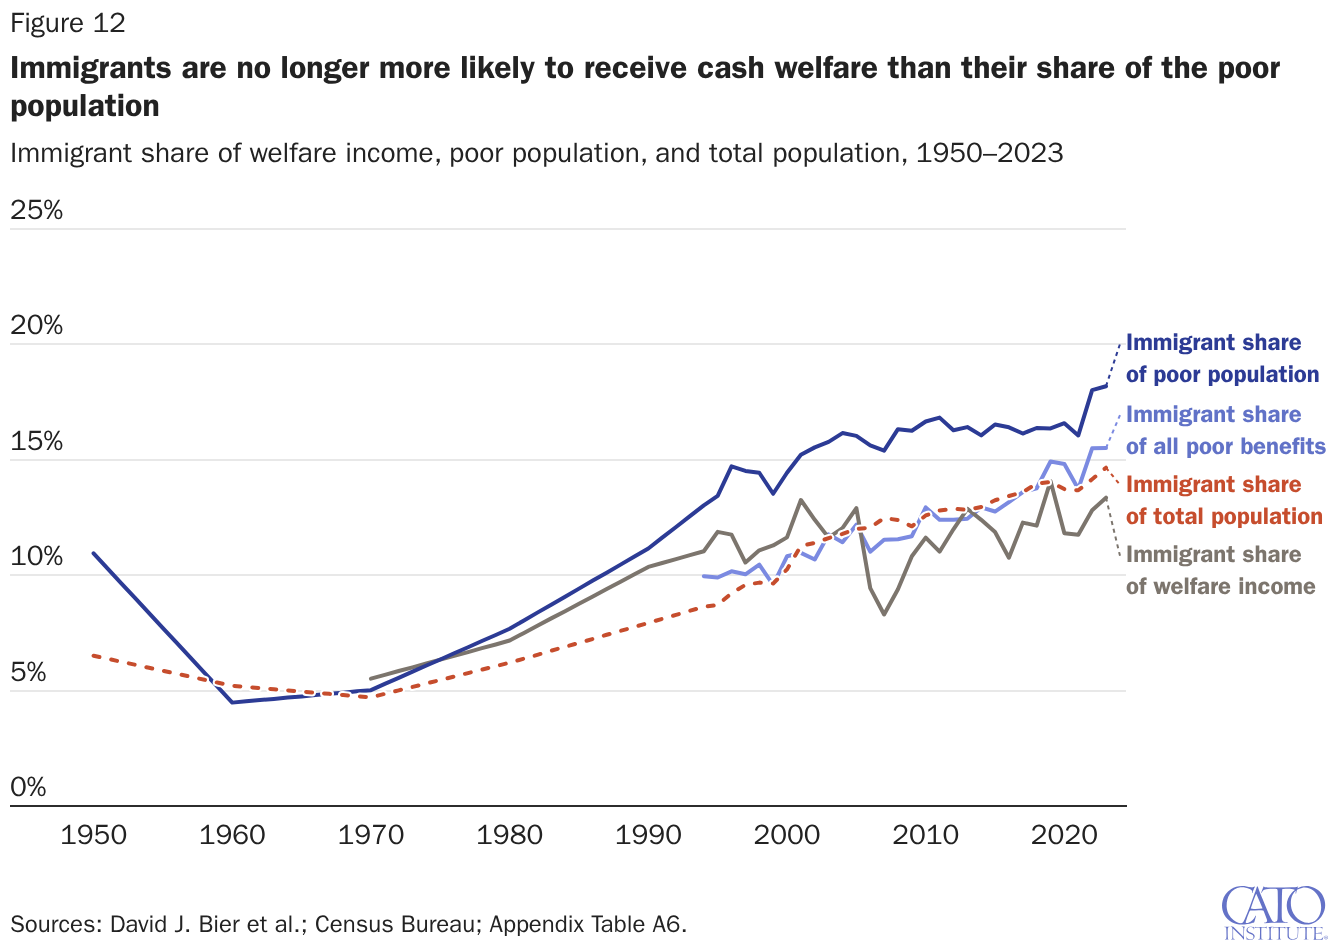
What about welfare for the poor? The evidence from the censuses from 1970 to 1990 shows that immigrants went from being slightly more likely to receive cash welfare in 1970 to being slightly less likely to receive it than their share of the poor population from the 1980s to 1990s (Figure 12).34 Immigration by welfare-ineligible illegal immigrants increased, and welfare rules were restricted for new legal immigrants during their first five years in the country.
In the years before 1940, most welfare was provided at the state and local level through almshouses, asylums, orphanages, homes for the handicapped, and other “benevolent institutions,” and not in the form of cash or noncash transfers. From 1900 to 1940, the censuses show that immigrants were substantially overrepresented at these institutions (Figure 13). This is consistent with a more general investigation of all types of aid in 43 cities in 1908–1909.35
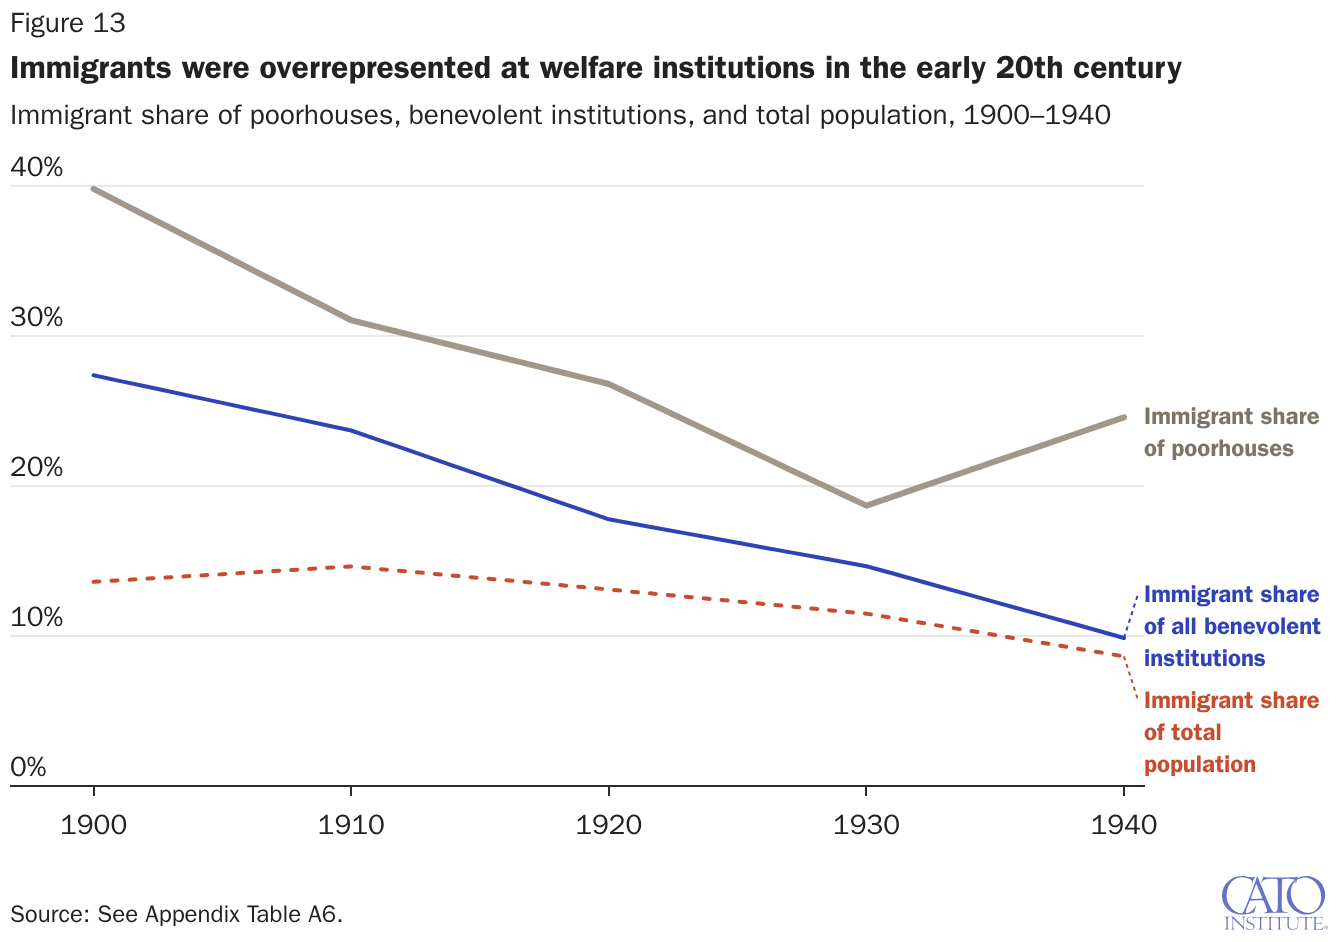
These facts make allocating all US government benefits spending for earlier periods possible. Appendix Tables A5 and A6 give details on how spending was allocated, and Table A4 reports the resulting allocation factors themselves. Educational services can be allocated based on immigrant share of the population in schools—which, as we have seen, is a very good proxy. It is possible to distribute old-age benefits based on Social Security income recorded in the census back to 1970 and the immigrant share of the elderly population before then, but this particular spending stream did not exist in the early 20th century, so it plays little role in the comparison. For prisons, police, and courts, the incarceration rate—which is available in the decennial censuses—provides a proxy for cost. It is an imperfect proxy, but it is the best available, and the expenditure is a relatively small share of spending, so any potential bias either way would have a minimal effect on our results.
For benefits for the poor, welfare income is available back to 1970, and the share of the poor population is available back to 1950. From 1900 to 1940, the share of the population in publicly funded benevolent institutions can be used.36 All other benefits—from roads to parks to libraries (sometimes called congestible public goods)—are assumed to be used proportionally to the immigrant share of the population.
Figure 14 shows how close this result is to the results using the much more specific methodology in the Cato 2026 fiscal model, which used direct survey data on benefit use from the Census Bureau’s Current Population Survey Annual Social and Economic Supplement.37 The indirect estimates are within 1 percent of the more detailed model’s value for the full 30-year period, so the model appears to be an accurate approximation of total spending on immigrants.

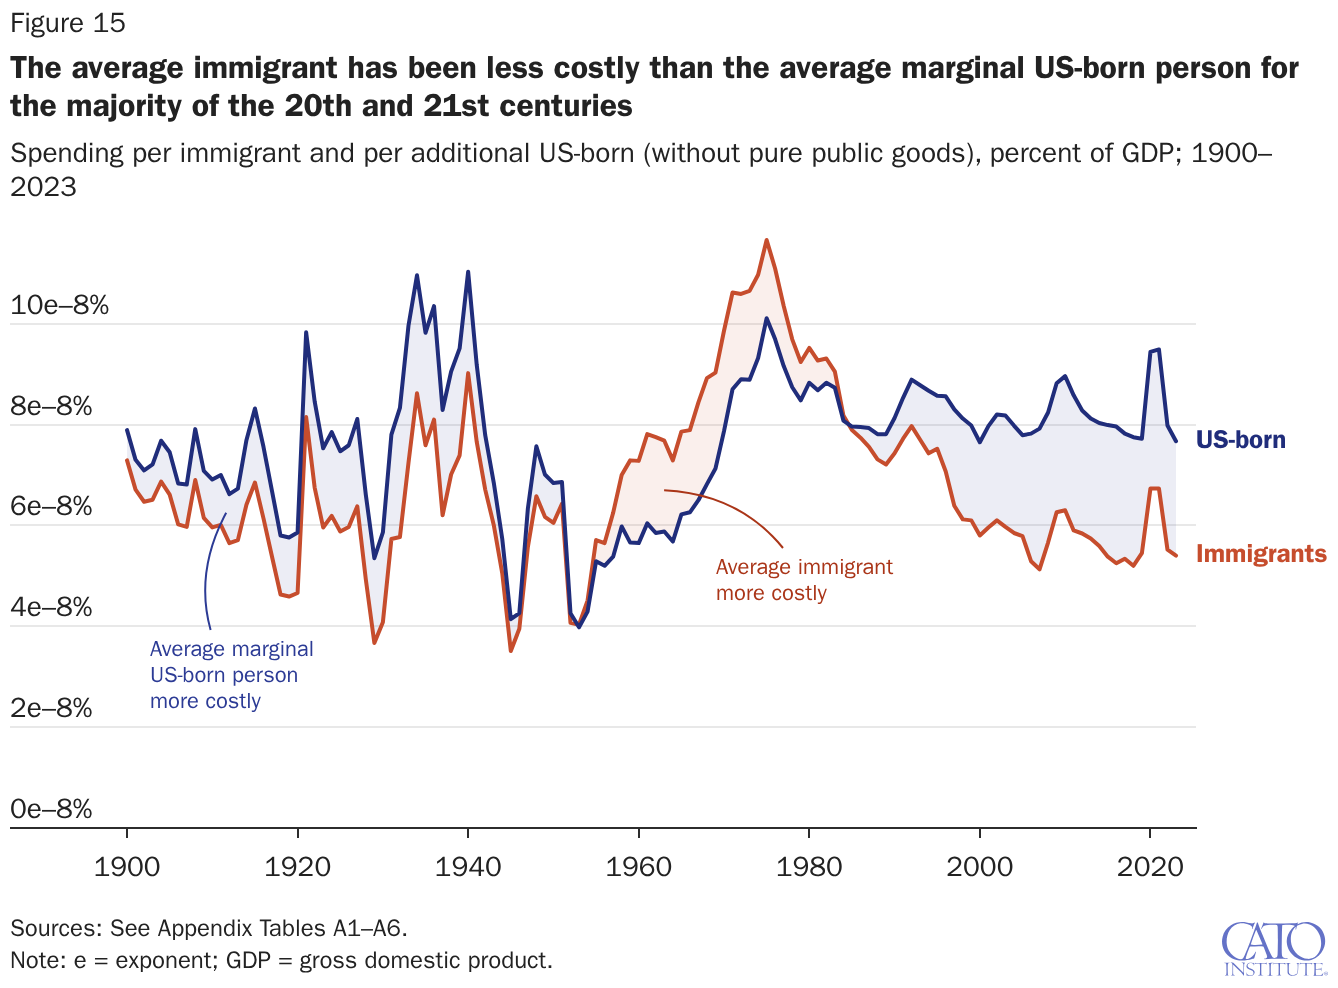
Figure 15 compares marginal and average spending per immigrant to spending per US-born person (including benefits and public goods spending). The upshot is that, except for a period from the 1950s to the 1980s when the immigrant population was smaller and less likely to be of working age than in the other periods, the average immigrant has been less costly on the margin than the average US-born person.
Immigrants’ Net Effect on Budgets
Figure 16 compares immigrant tax and benefits flows across the 20th and early 21st centuries, showing that immigrants have been fiscally positive every single year for more than 120 years. In 2022, immigrants were collectively the most fiscally positive in American history, as a percentage of GDP, with 2023 close behind. The net fiscal gain in 2023 was about 2.1 percent of GDP. In 1913, the net fiscal gain was just 0.8 percent of GDP. In other words, immigrants today are more than twice as much of a fiscal benefit to governments as they were in the early 20th century.
Economist Milton Friedman famously claimed, “You cannot simultaneously have a welfare state and free immigration.”38 On another occasion, he said, “Free immigration was a good thing before 1914, and free immigration is a bad thing today” because people now are “entitled to a prorated share of the pot … or even to a low level of the pot.”39 Friedman clarified that he was speaking about legal immigration specifically, stating that illegal “immigration over the border is a good thing” because illegal immigrants “do not qualify for welfare.”40 Unfortunately, the Census Bureau data do not distinguish by legal status, and about 27 percent of the immigrant population was here illegally in 2023.41 But we have previously estimated that 84 percent of the positive fiscal effect from 1994 to 2023 came from legal immigrants.42
Nonetheless, Friedman was correct to identify 1913—the year the current individual federal income tax was passed—as a critical juncture in US fiscal policy. Therefore, to respond directly to Friedman’s assessment that there was a fundamental change in the fiscal situation for immigrants since 1914, Table 1 and Figure 17 break down the budget numbers for 2023 and 1913, just before the radical change in governmental taxes and spending that followed institution of the current income tax.
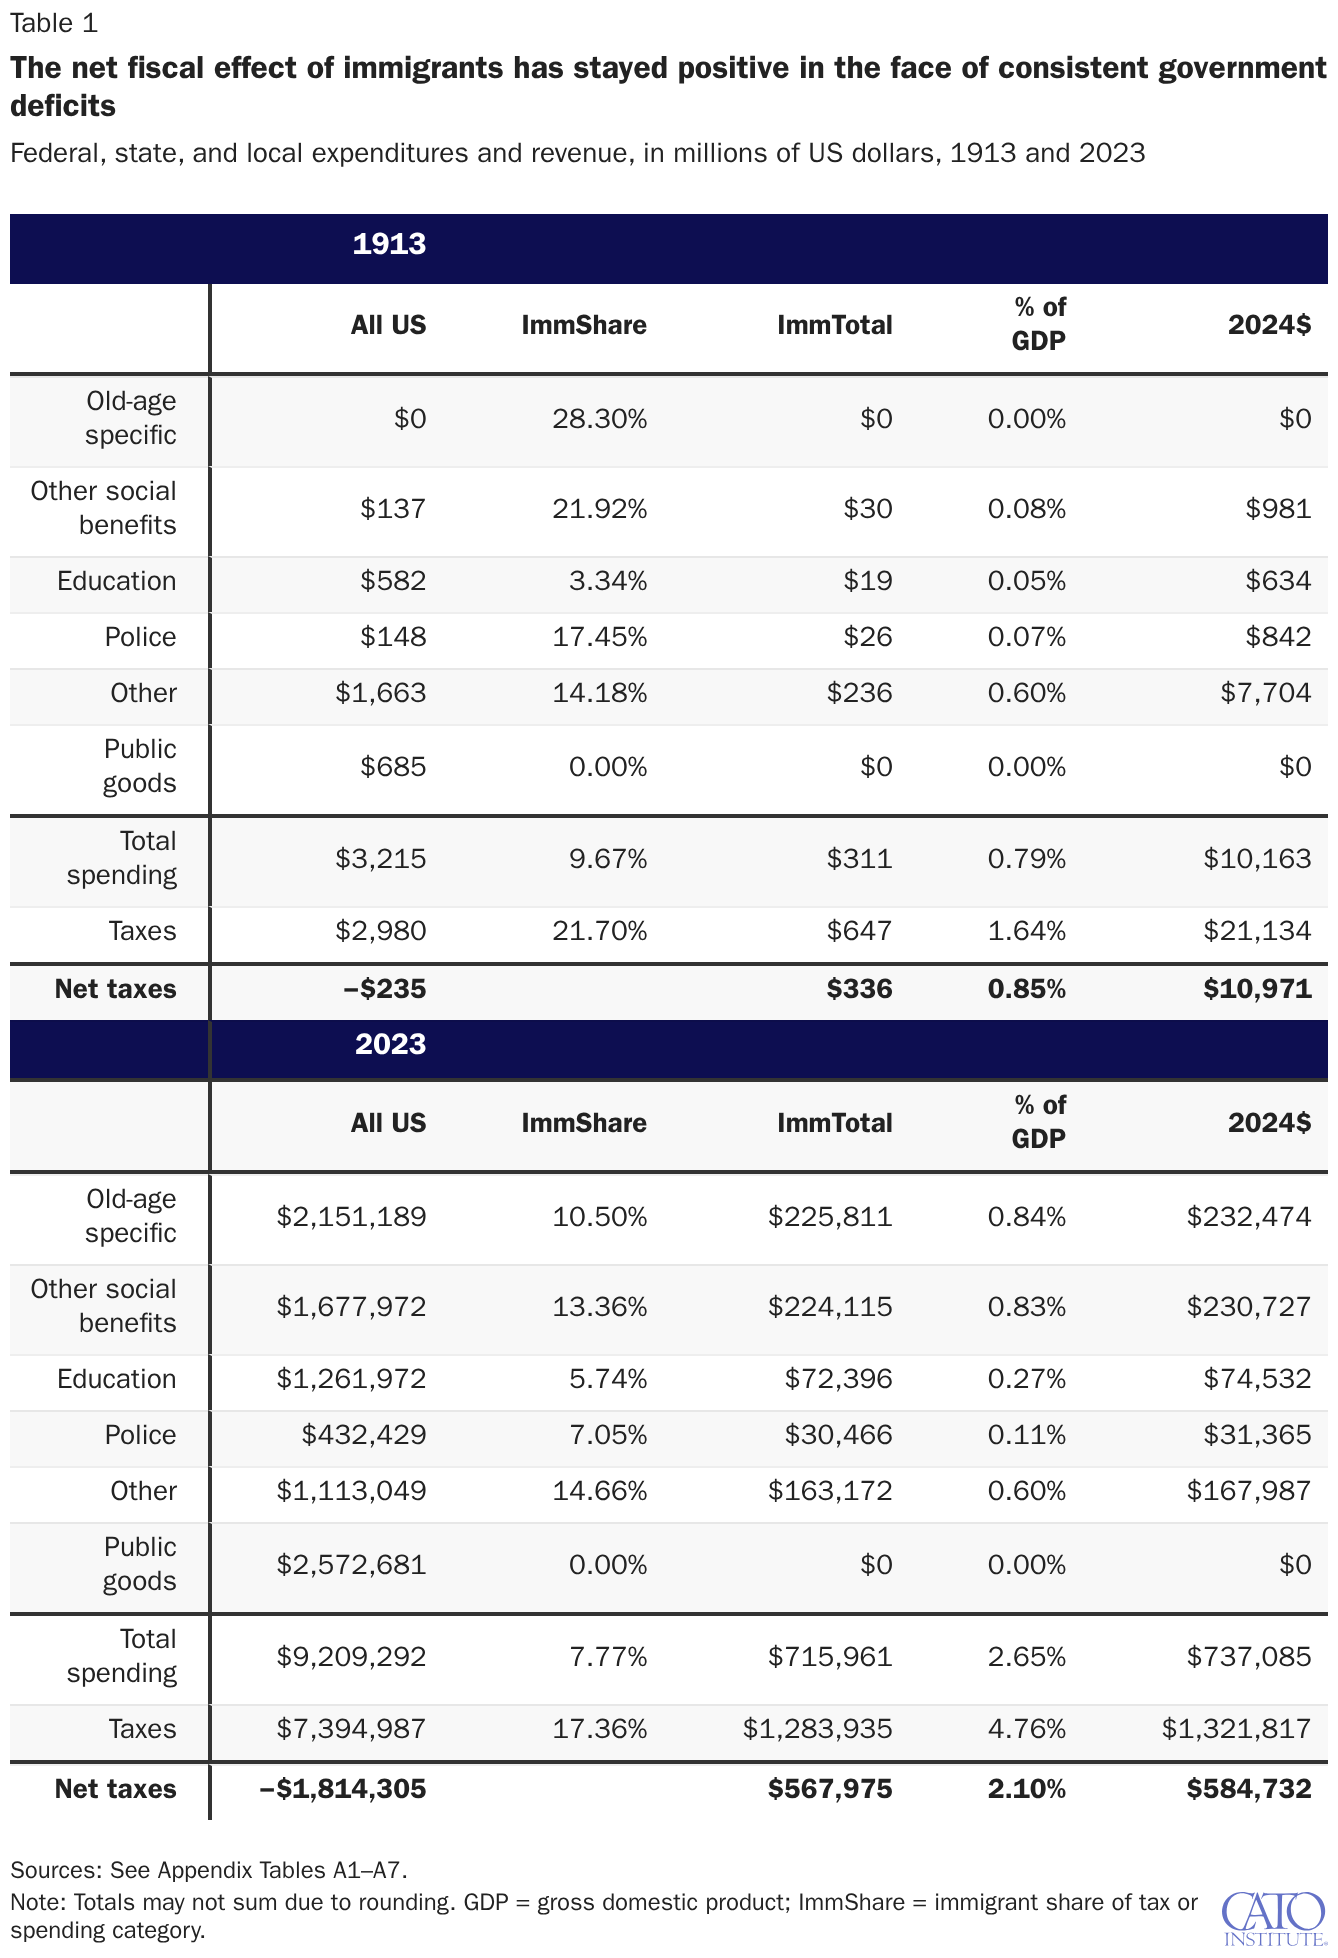

In 1913, all levels of government cumulatively ran a deficit in the nominal amount of $235 million, but pure public goods spending exceeded the deficit, so the marginal person was fiscally positive. Immigrants accounted for 9.7 percent of total spending and 21.7 percent of total taxes. Their net effect was a nominal $336 million—0.8 percent of GDP—or $11 billion in 2024 dollars. In 2023, all levels of government ran a cumulative deficit of $1.8 trillion, but again, public goods spending exceeded the deficit, meaning the average additional person had a positive effect. Immigrants were responsible for 7.8 percent of spending and 17.4 percent of revenue, for a cumulative fiscal boost of nearly $585 billion, compared to $11 billion in 1913.43
But Figure 17 dramatically understates the positive fiscal effect of immigrants. The more important perspective is the effect of immigrants compared to the population without immigrants. While some groups of immigrants do receive more in benefits than they generate in taxes, this fiscal flow is less fiscally negative relative to their contributions to GDP than that of the US-born population. Immigrants also reduce the deficit-to-GDP ratio, which improves the US fiscal situation because the economic burdensomeness of debt depends directly on the size of the economy.
Figure 18 shows the immigrant surplus relative to US GDP, compared to America’s fiscal deficit relative to GDP. From 1913 to 2023, the immigrant surplus more than doubled as a share of GDP, but at the same time, the US federal, state, and local combined deficit without immigrants widened from negative 1.4 percent to negative 8.8 percent, a sixfold increase. This means the fiscal gap between immigrants and the US-born population has grown fivefold, from 2 percent to 11 percent of GDP, or $3.04 trillion. Milton Friedman failed to consider that the worse the fiscal situation of the United States, the more beneficial new immigrants become.

However, controlling for GDP biases the analysis in favor of early 20th-century immigrants. America is continuously becoming more productive, which means that each immigrant is—in real terms—having a much more positive effect today than in the early 20th century. They produce more for Americans today than they did then, and that production results in more tax revenue. Two percent of GDP represents far more new goods and services produced today than 2 percent of GDP in 1910. Comparing the immigrant surplus in real terms—controlling for inflation rather than GDP—is more revealing about how much more fiscally beneficial immigrants are today.
Figure 19 depicts this. In real inflation-adjusted terms, immigrants in 2023 were about 53 times more valuable to the government than immigrants in 1913 (using a consistent methodology throughout). In 1913, immigrants contributed about $11 billion more in taxes than they received in benefits, compared to roughly $585 billion in 2023 (again, using consistent methods). Their cumulative effect is enormous. In real terms, immigrants have contributed $14.6 trillion more in taxes than they have received in benefits since 1900. On a per-person basis, the average immigrant provided a fiscal benefit of $796 in 1913, compared to $11,899 in 2023.
The Effect of US-Born Children
Our main interest in this paper is whether immigrants have increased the debt or whether the debt has risen exclusively through spending on the US-born population. Obviously, immigrants also have children in the United States, and those children impose costs and ultimately grow up and pay taxes. However, including all the descendants of immigrants in our analysis would effectively include nearly all Americans. Even limiting the analysis to the second generation obfuscates the comparison of immigrants between periods, because costs from the elderly children of immigrants who arrived in the early 20th century would be attributed to the immigrants of the 21st century.
For these reasons, we will incorporate only the US-born dependent children of immigrants into this analysis. If estimating the total effect of immigration or comparing immigrants with the US-born were our goal, this choice would be inappropriate since it would automatically exclude all children of immigrants the moment that they become independent economic contributors—artificially increasing costs without accounting for their economic and fiscal contributions. However, the primary purpose of this paper is to compare the effects between immigrants of different periods, so using only dependents creates an internally valid comparison. We also use only the children of two immigrant parents because mixed-nativity households raise an unresolved allocation problem: If a child has one native and one immigrant parent, there is no principled way to assign that child’s schooling costs or tax contribution to one parent over the other. Limiting the sample to two-immigrant-parent families avoids this ambiguity.44
As Figure 20 shows, immigrants accounted for about 15 percent of the population in 1910, and their dependents accounted for 6.3 percent of the population—a 2.3‑to‑1 ratio of immigrants to dependents. By 2023, immigrants were again about 15 percent of the population, but their dependents were just 3.8 percent of the population—a 3.8‑to‑1 ratio of immigrants to dependents. In other words, dependents were a much larger portion of the population in 1910 because immigrants in those days had larger families than today.
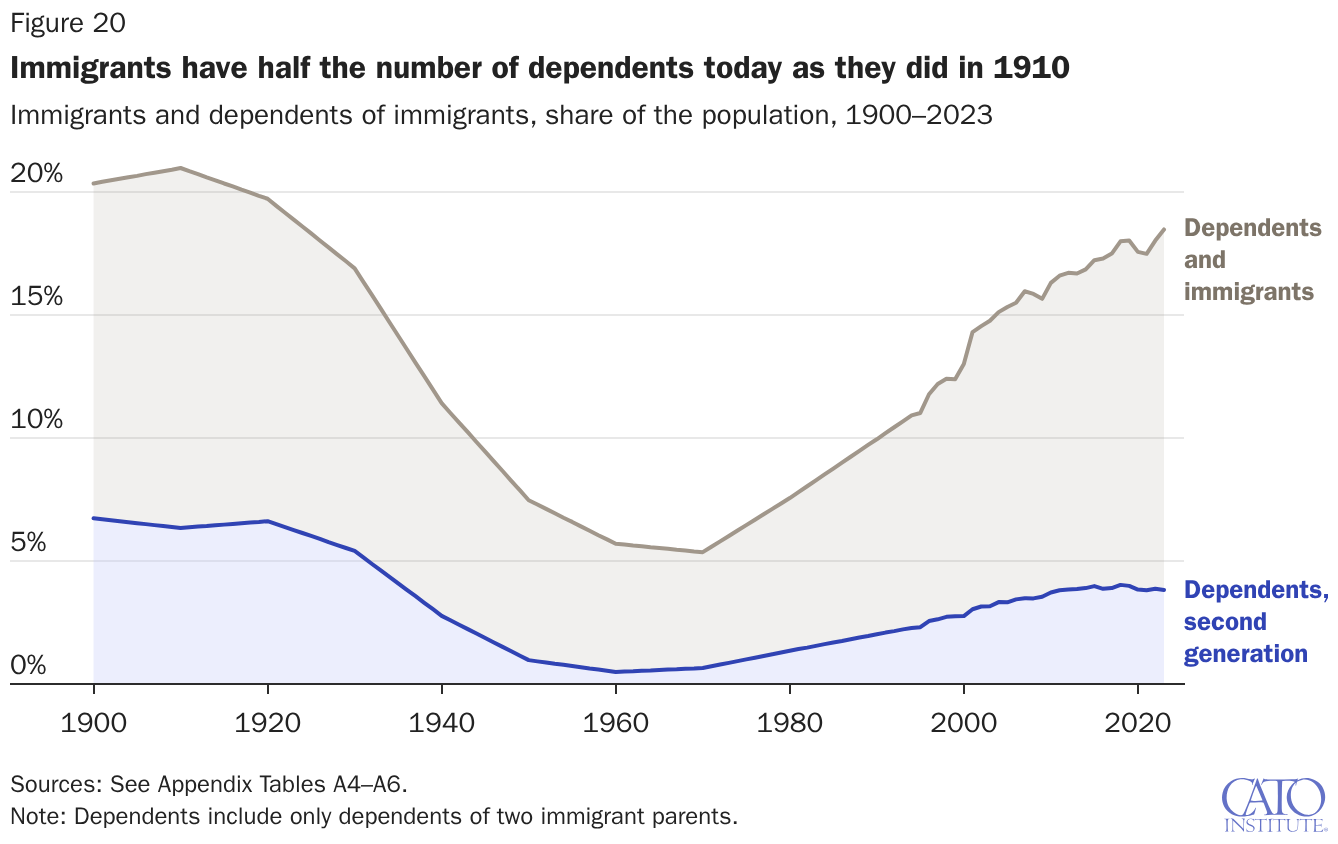
Adding dependents into the calculation increases substantial costs for education and some costs for welfare, but it has minimal effect on criminal justice and no effect on the largest government expenditures on programs for the elderly. Because old-age benefits are the largest benefits category and the one where immigrants’ underuse is unaffected by adding dependents, they now account for a larger share of the immigrant fiscal advantage, which is reinforced by immigrants’ continued tax advantage from working at higher rates, which dependents also leave untouched. Regardless, the effect of adding dependents into the calculation changes the picture more for the early 20th-century immigrants than the early 21st-century immigrants.
The total net fiscal effect of immigrants and their dependents was positive $6.3 trillion from 1900 to 2023, lower than the $14.6 trillion for immigrants alone. This lower amount makes sense because dependents almost exclusively add fiscal costs, not benefits, unlike when they are adults. The net effect of immigrants alone was a positive 0.8 percent of GDP in 1913, compared with 2.1 percent in 2023. It was 0.4 percent with dependents in 1913, compared with 1 percent with them in 2023 (Figure 21). In other words, even with dependents, immigrants were more than twice as fiscally positive in 2023 as they were in 1913.

When we compare immigrants and their dependents today against the US population without them, the difference is even more dramatic: The US population without immigrants and their dependents was fiscally negative 1 percent of GDP in 1913 and negative 8 percent in 2023. That means the fiscal gap between immigrants and their dependents versus the US population overall grew from 1.4 percent in 1913 to about 8.7 percent in 2023 (Figure 22). By this metric, immigrants and their children were relatively six times more fiscally beneficial in 2023 than in 1913 as a share of GDP. The net fiscal effect of immigrants and dependents in inflation-adjusted terms grew 49-fold, rather than 53-fold without dependents.

Conclusion
Milton Friedman was right that immigrants at the turn of the 21st century were legally entitled to more benefits than they had been at the turn of the 20th century. But immigrants today are more productive and pay higher taxes than in the past. This study demonstrates that immigration has remained fiscally positive, collectively, at all levels of the US government for more than a century. Indeed, immigration has never been as fiscally and economically positive as it is today.
Of the $14.6 trillion in immigrant fiscal surplus, 86 percent has accrued since 1965 and the creation of the modern Great Society welfare state. The effect of immigrants on early 20th-century budgets must be estimated indirectly, but the facts are so clear that minor methodological changes would not reverse any of this paper’s substantive conclusions. Of course, the effect could change in the future if taxes are significantly reduced, benefits are increased, or the composition of the immigrant population becomes radically different. However, the fiscal effect is not anywhere close to negative, and the positive effect is rising quickly. It would take a dramatic reversal for the immigrant population to harm government budgets. One of the few methods to turn the immigrant fiscal effect negative would be to prohibit new immigration until most current immigrants were elderly retirees.
Immigrants were much more fiscally positive in 2023 than they were in the early 20th century. This conclusion is robust against alternative methodologies, such as including the children of immigrants. Congress has built immigration policy largely on the premise that legal immigration economically harms Americans, so it should be strictly limited. Less than 4 percent of the applicants for green cards—or lawful permanent residence—were approved in 2023.45 A better policy would be built on the assumption that immigrants will benefit the country fiscally and economically. Prior to 1921, more than 98 percent of immigrant applicants were approved to receive permanent residence. That system better reflected American traditions and economic reality. Congress should return to the presumption of openness and reauthorize peaceful immigrants to come to the United States legally.
Appendix
The primary sources for distributing spending and taxes between immigrants and the US-born are the Census Bureau’s decennial censuses and, since 1994, the Census Bureau’s Current Population Survey Annual Social and Economic Supplement, both available via IPUMS (originally Integrated Public Use Microdata Series), a collection of social science data housed at the University of Minnesota’s Institute for Social Research and Data Innovation.46 The main series for spending and revenues for this paper comes from the Bureau of Economic Analysis’s (BEA) National Income and Product Accounts (NIPA) for 1929 to 2024 and from the Census Bureau’s Historical Statistics of the United States for 1900 to 1928.47 The BEA does not provide details on defense expenditures prior to 1959, so data from the Office of Management and Budget (OMB) on defense outlays were used. Generally, the difference between “outlays” and “current expenditures” is small, but from 1941 to 1945 the difference is so large (given World War II military expenditures) that total outlays must be used instead of the BEA’s total current expenditures. Otherwise, the spending components will become larger than the total amount. Pre-1929 spending is more compatible with the OMB approach, but the differences are not important for the 1913 to 2023 comparison. Appendix Tables A1 and A2 provide the nominal values underlying the figures in this paper. Table A4 reports the resulting allocation factors themselves: the annual share of each spending or tax category attributable to first-generation immigrants and to their second-generation dependents, separately, for every year from 1900 to 2023.48
Table A5 explains how each factor in Table A4 is constructed—that is, which proxy variable stands in for that factor and over what period—since several factors switch proxies across the century as better data become available. The factors in Table A4 are shares, so multiplying one by the corresponding total in Table A1 or A2 converts it into a dollar figure, a share of GDP, or a per capita amount.


Take the education factor as an example. In every year, it is built from the immigrant (or dependent) share of the school population: If first-generation immigrant children are listed as 3 percent of all students enrolled in 1913, Table A4 reports 3 percent as that year’s education factor for first-generation immigrants, and Table A5 records “share of school population” as the proxy used to build it, for all years. To find immigrants’ dollar share of education spending in 1913, multiply that 3 percent factor by total nominal education spending in 1913 from Table A1. Dividing the result by 1913 GDP, from Table A2, expresses it as a share of GDP instead of a dollar figure. And dividing it by the immigrant population in 1913 gives the marginal, or per capita, cost, where immigrant population itself is obtained by multiplying the “other spending factor” in Table A4 (the immigrant share of total population) by total US population in Table A2.
Years falling between two proxies are filled by linear interpolation, splicing the series together. Table A6 reports the underlying variables and samples used to construct each of the spending proxies listed in Table A5, and Table A7 reports the same for the earned-income proxy that underlies the tax revenue factor, following the approach economist Michael Clemens uses for estimating earned income from the available historical variables.49
Table A3 reports the sources and construction notes underlying the nominal series in Tables A1 and A2.
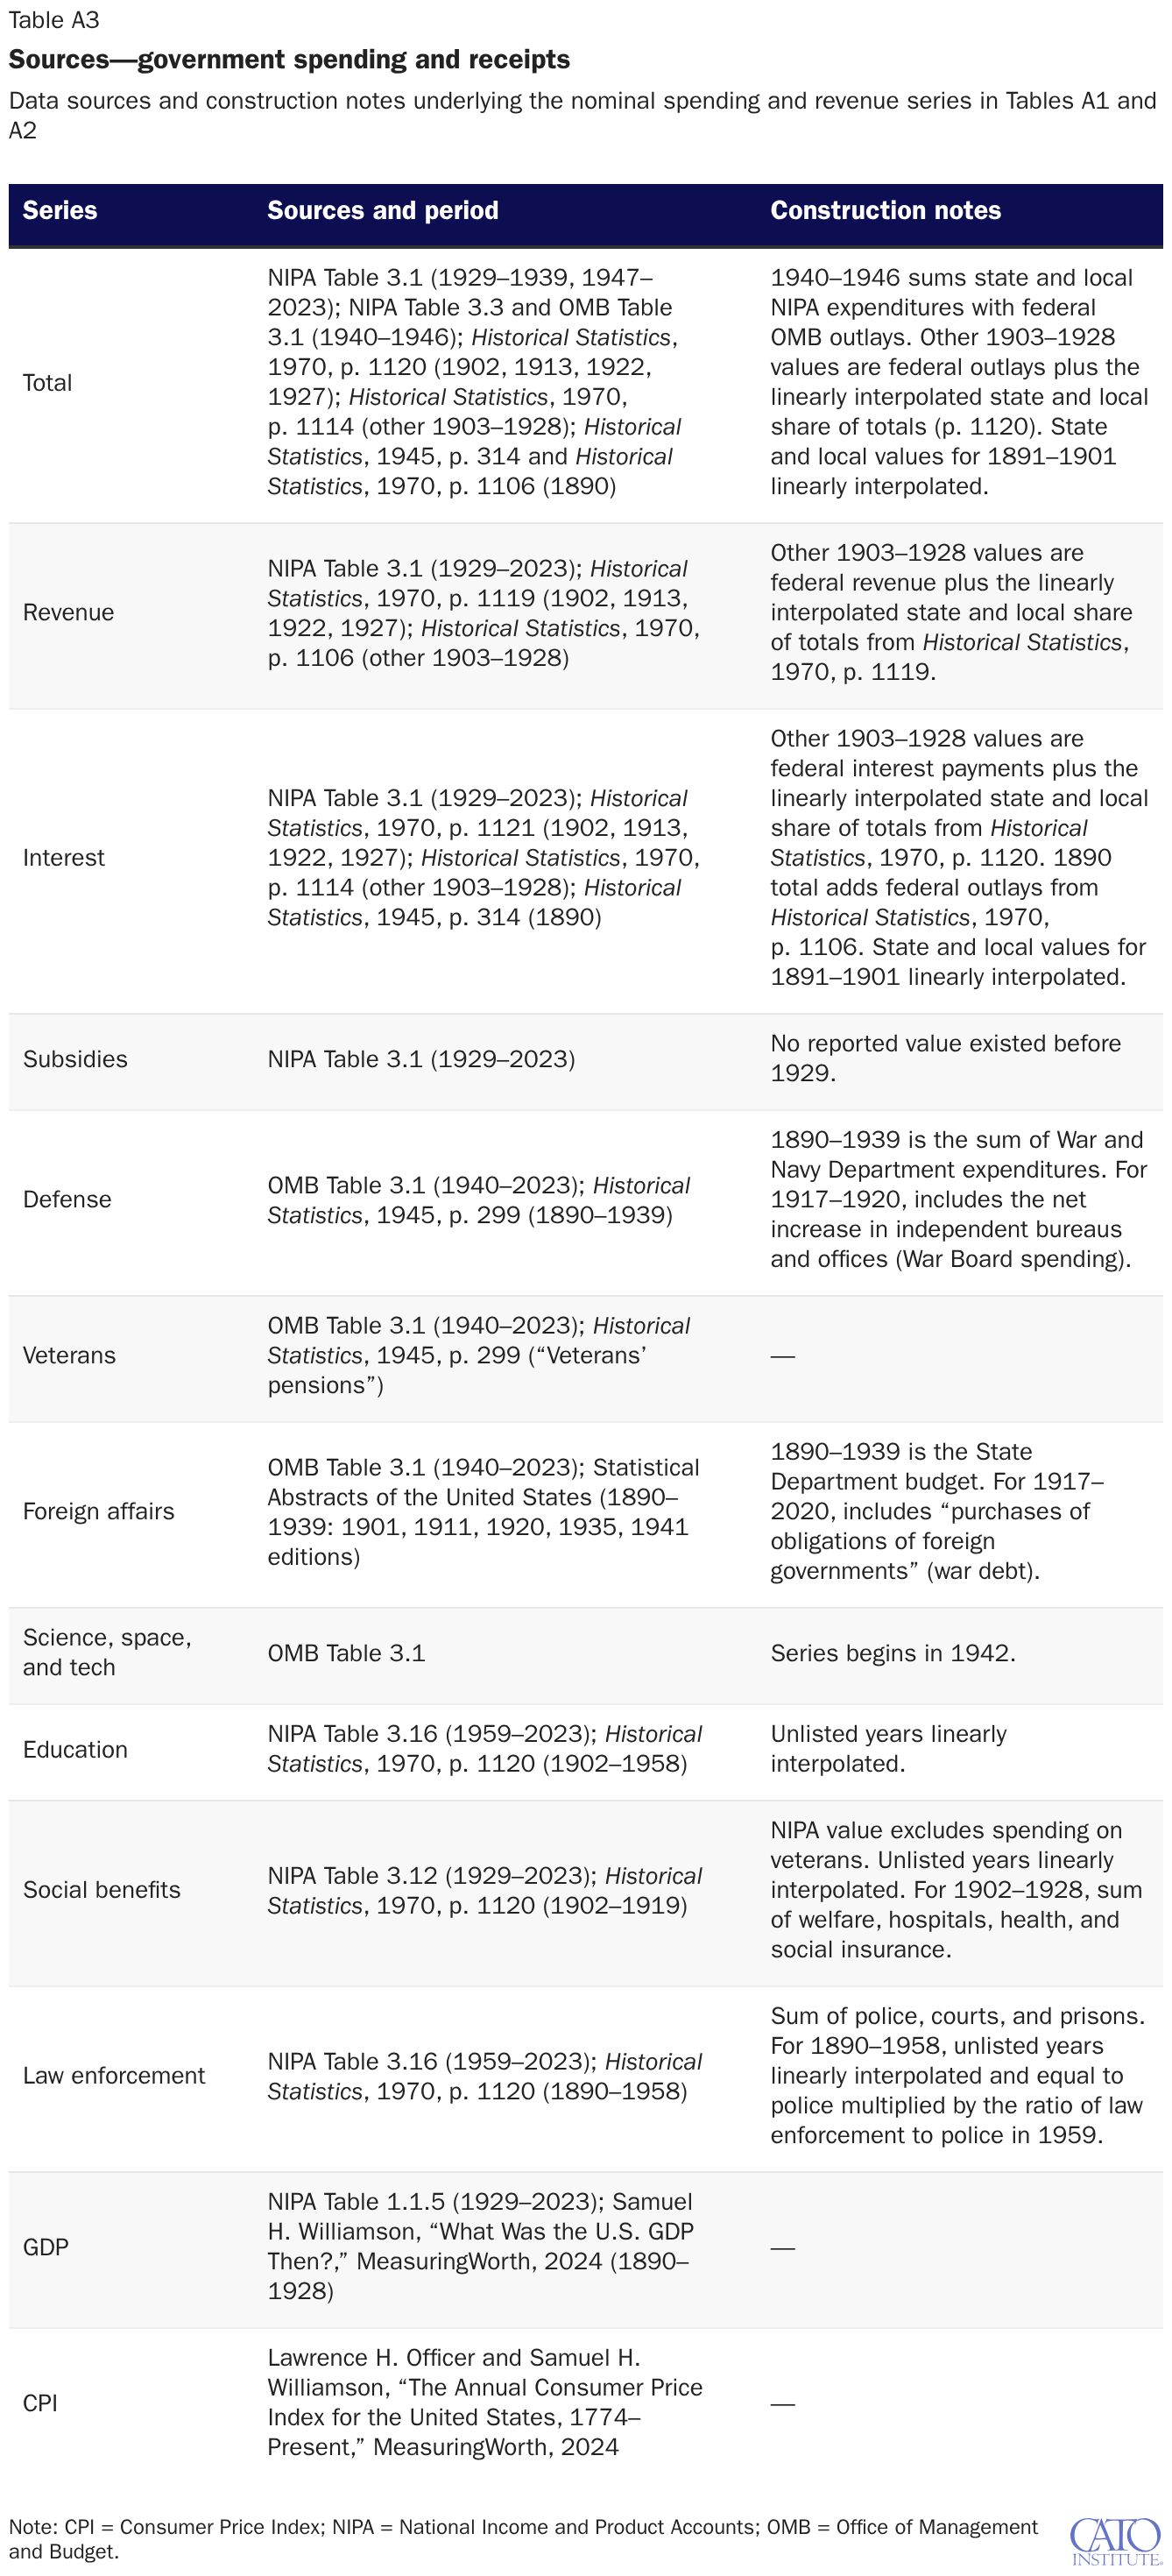

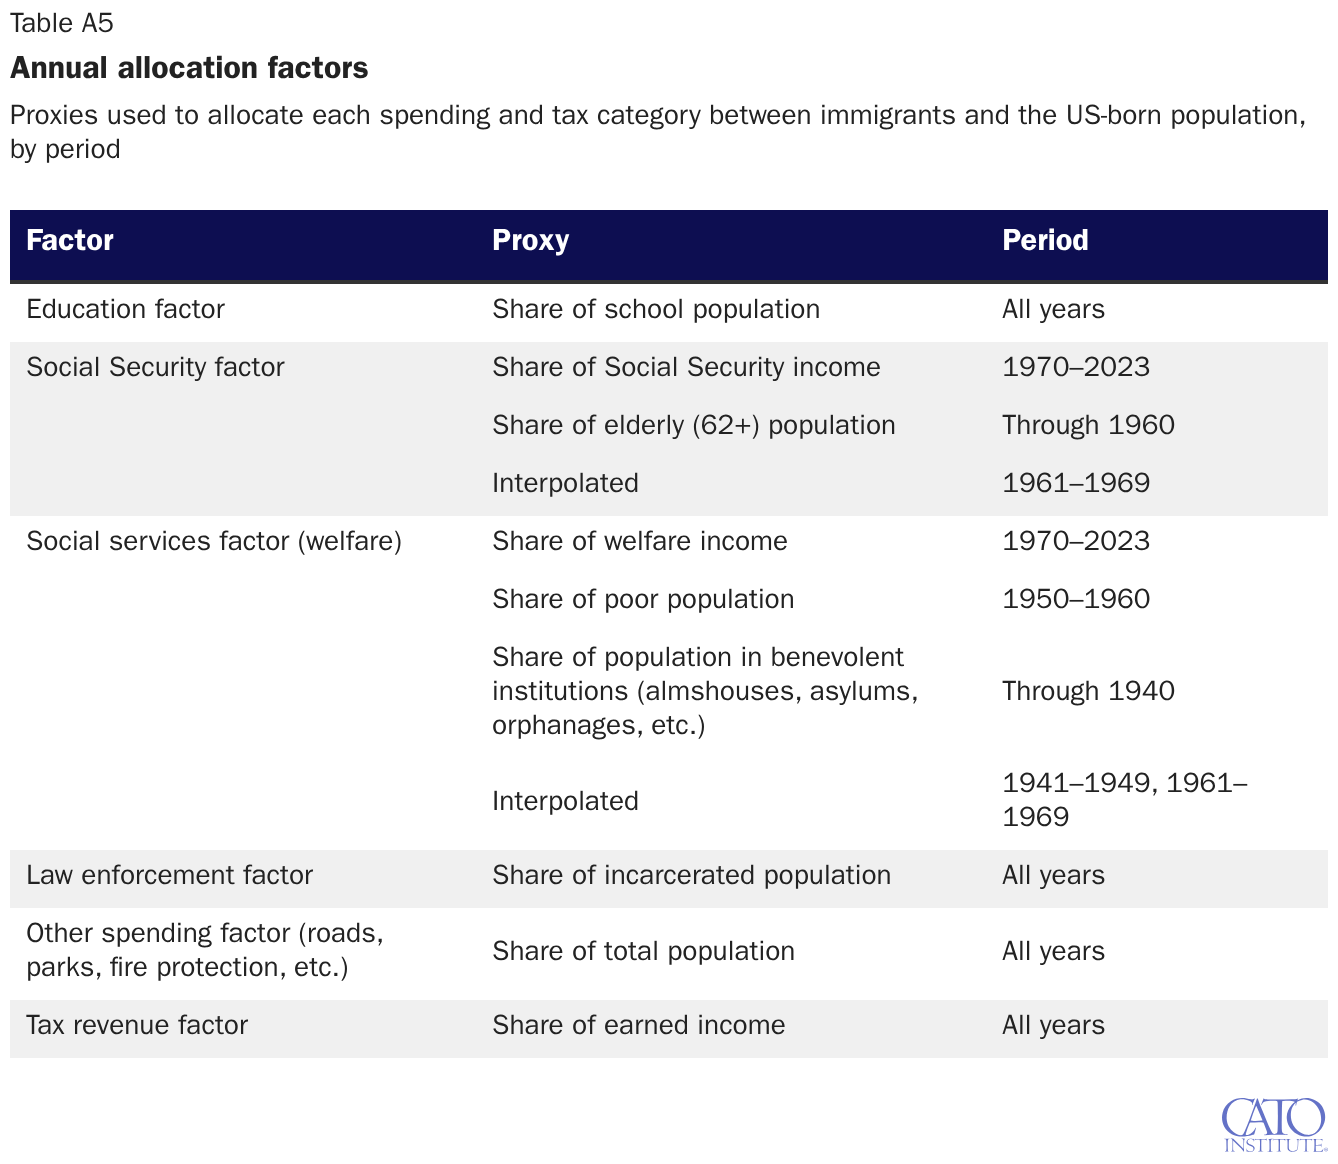
Table A6 reports, for each variable used to allocate spending and tax categories between immigrants and the US-born population, the census and survey samples that were drawn upon, the underlying variables, the construction logic, and the population weight applied in each period.
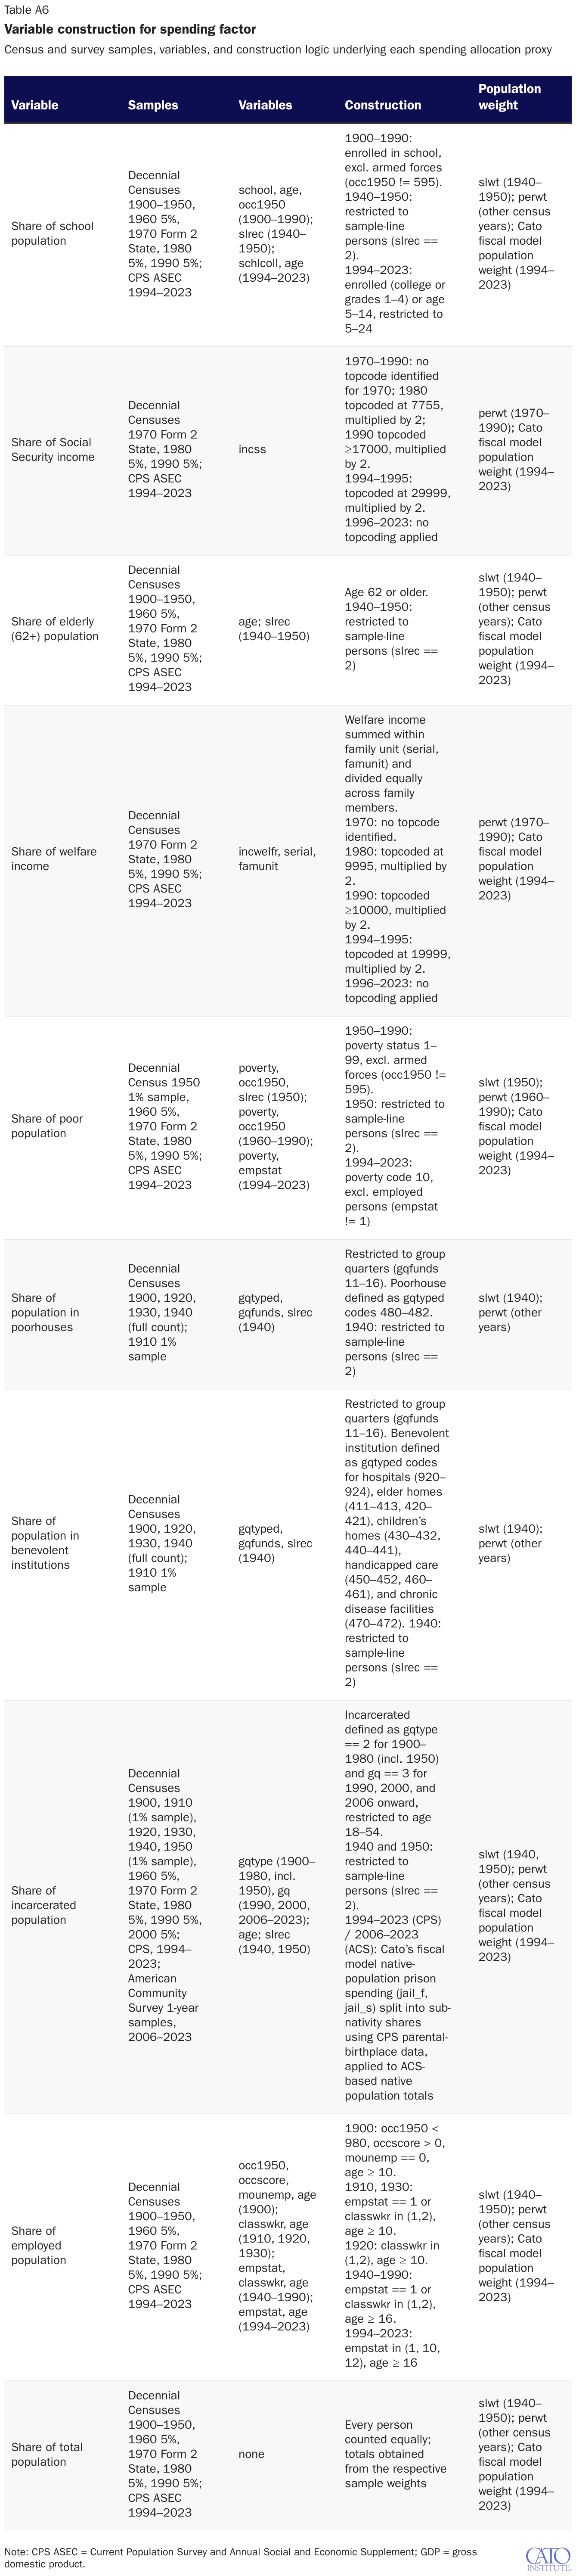
Samples and population weights for this proxy are identical to the school and total population proxies from Table A6: Decennial Censuses 1900–1950, 1960 5 percent; 1970 Form 2 State, 1980 5 percent; 1990 5 percent; CPS ASEC 1994–2023; slwt—sample-line weight (1940–1950); perwt—person weight (other census years); and Cato fiscal model population weight (1994–2023).
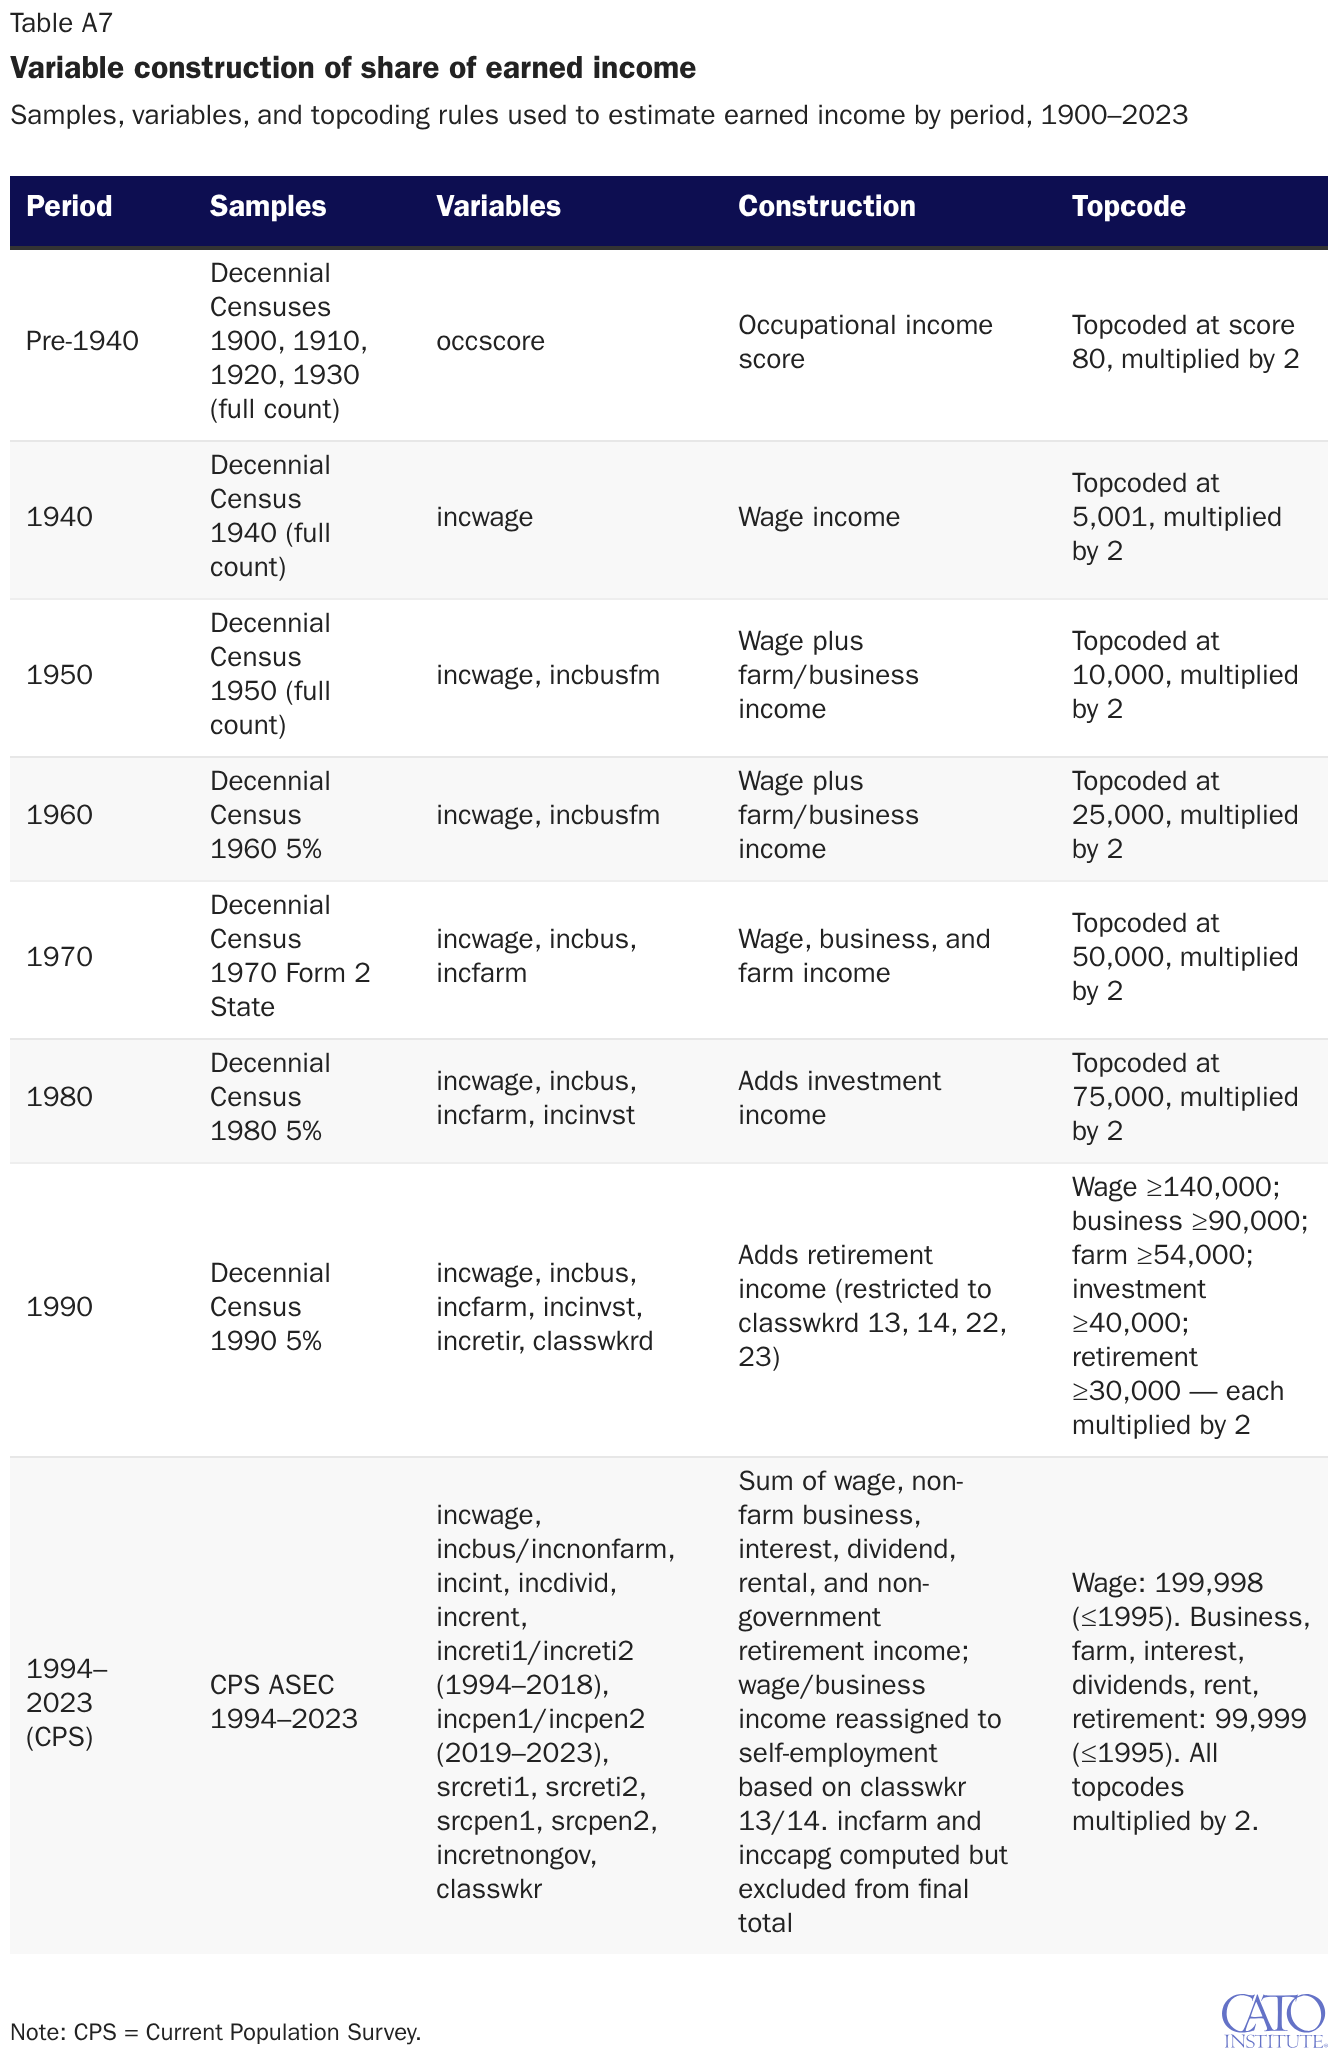
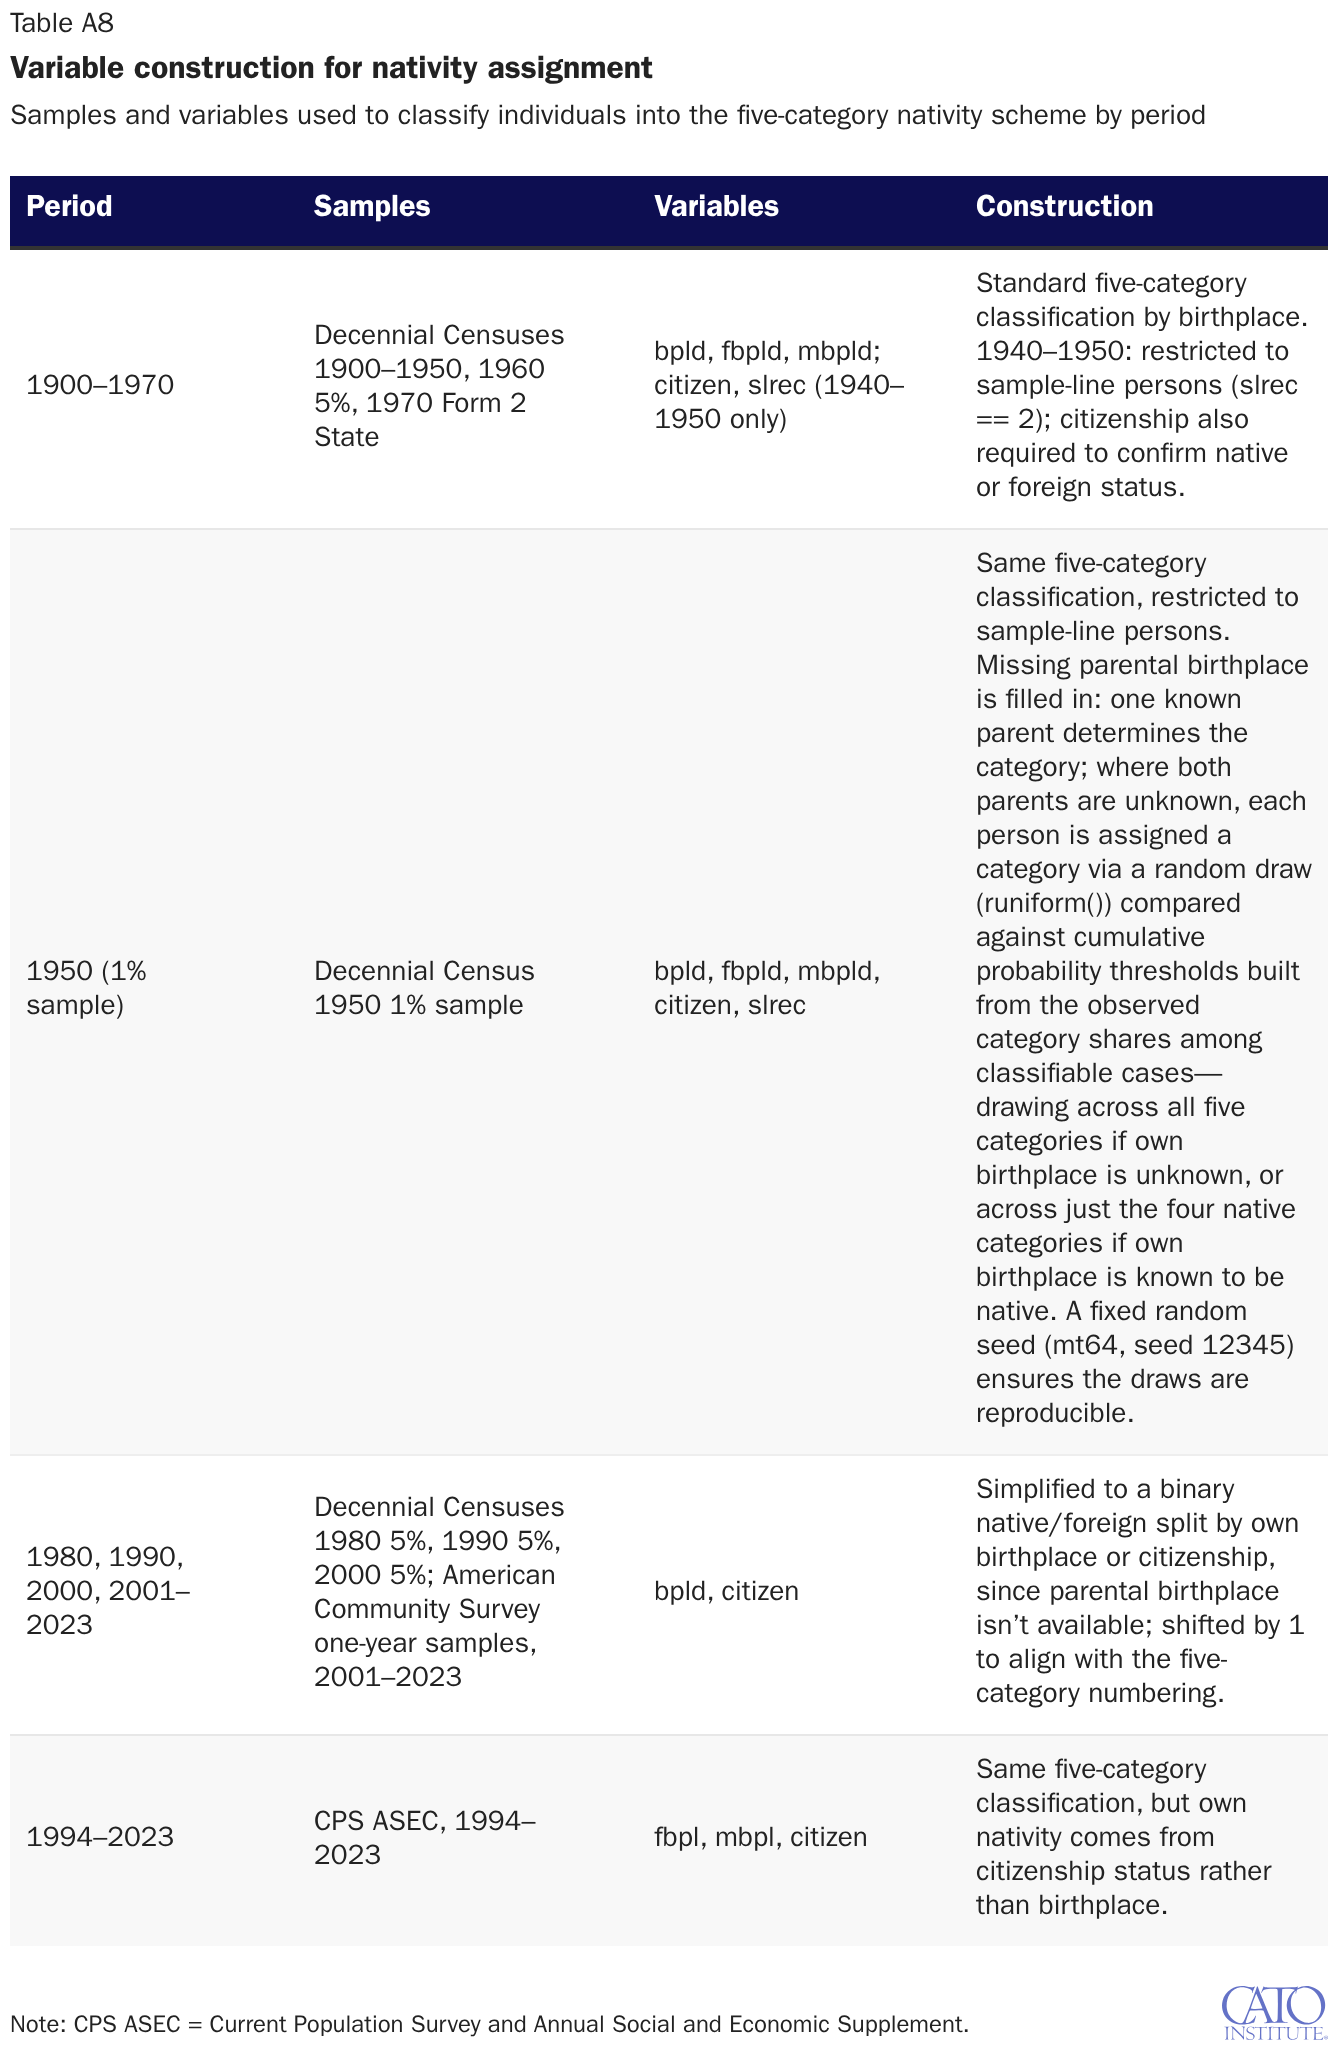
Nativity is assigned using five categories, following the structure of IPUMS’s standard nativity variable, but it is reconstructed here using own birthplace, mother’s and father’s birthplace, and citizenship status where available, since these underlying variables offer a more consistent basis for classification across census years than the prebuilt nativity variable itself. The five categories are: foreign-born; native-born with both parents foreign-born; native-born with foreign-born father and native-born mother; native-born with foreign-born mother and native-born father; and native-born with both parents native-born (Table A8).
Dependents are defined as anyone under age 18, or anyone age 18–21 who is enrolled in school. A household’s reference person (the householder) is reclassified as an independent rather than a dependent in the case where every member of their household would otherwise be counted as a dependent, since a household cannot consist entirely of dependents with no independent adult.
For 1971–1993, a two-stage approach is used to reconstruct population and income levels by nativity subcategory. First, each native subcategory’s share of the combined native total (third-generation and second-generation split by which parent was foreign-born) is computed for the surrounding anchor years and linearly interpolated across the gap. Second, those interpolated shares are multiplied by the actual native population or income total for each year—itself separately reconstructed by interpolating a binary foreign-versus-native split between real anchor points in 1970, 1980, 1990, and 1994. Dependents are computed and netted out of totals at each stage to avoid double-counting, then added back in afterward.
Citation
Bier, David J., and Julián Salazar. “Immigrants’ Historical Effects on Government Budgets: 1900–2023,” Policy Analysis no. 1024, Cato Institute, Washington, DC, November 17, 2026.

About the Authors


This work is licensed under a Creative Commons Attribution-NonCommercial-ShareAlike 4.0 International License.