
Recent increases in immigration have rekindled concerns about their effects on government budgets. This paper updates a model of these effects first developed by the National Academies of Sciences, Engineering, and Medicine (NASEM) to shed light on how immigrants, both legal and illegal, and their children affect government budgets. This analysis is the first to estimate the cumulative fiscal effect of immigrants on federal, state, and local budgets over 30 years.
The government first began gathering detailed information on benefits use by citizenship status in 1994. The data show:
- For each year from 1994 to 2023, the US immigrant population generated more in taxes than they received in benefits from all levels of government.
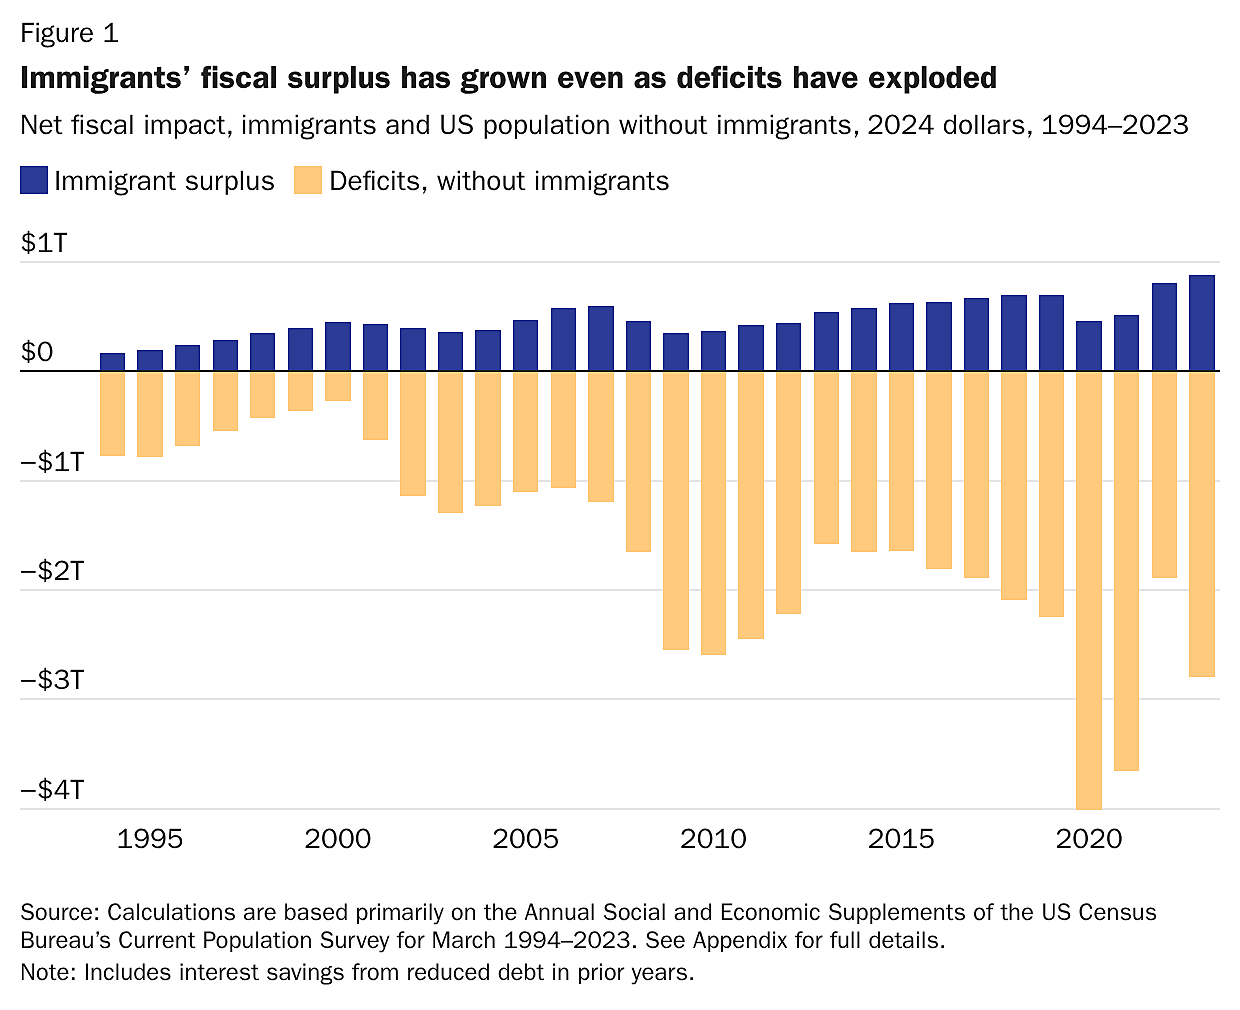
- Over that period, immigrants created a cumulative fiscal surplus of $14.5 trillion in real 2024 US dollars, including $3.9 trillion in savings on interest on the debt.
- Without immigrants, US government public debt at all levels would be at least 205 percent of gross domestic product (GDP)—nearly twice its 2023 level.
These results, which do not account for any of immigration’s indirect, tax-revenue-boosting effects on economic growth, represent the lower bound of the positive fiscal effects. Even by this conservative analysis, immigrants may have already prevented a fiscal crisis.
Introduction
This report is an update of a 2017 report by the National Academies of Sciences, Engineering, and Medicine (NASEM) on the fiscal effects of immigration.1 The NASEM authors shared their model with the Cato Institute, which allowed for further expansion and refinement. The model provides a comprehensive estimate of the fiscal flows to and from immigrants, both legal and illegal, in the United States and utilizes the highest quality data available from the US government. It accounts for current government expenditures and receipts (revenue), both direct and indirect spending, as well as all levels of government (federal, state, and local).
The primary data source for the NASEM–Cato model is the Annual Social and Economic Supplement from the US Census Bureau’s Current Population Survey.2 In this report, we make a few methodological refinements and data improvements to the NASEM model. Among other things, we use the most up-to-date research on the distribution of corporate tax payments between workers and owners of corporations,3 and we account for how immigration increases property values and therefore property tax revenue.4 We also incorporate all nontax revenues; improve the methodology for identifying benefits’ use in mixed-status (i.e., containing both citizens and noncitizens) households; improve the estimates for Medicare and Medicaid benefits received; and provide evidence supporting the NASEM estimates that do not assume immigrants increase spending on pure public goods (e.g., the military). The Appendix (and specifically the List of Variables in the Fiscal Effects Model) exhaustively detail our full methodology and data sources.
In this report, we update the NASEM historical analysis through 2023, the most recent year for which all the data were available when we prepared this analysis. Our purpose is only to report what has actually happened with government budgets and immigrants to this point. Cato Institute research has previously produced forward-looking estimates of the fiscal effects of immigrants, which are compatible with our conclusions here.5 Whatever the future holds—and we believe our estimates show it is bright—most Americans incorrectly believe that immigrants have already caused US budget deficits,6 and this belief appears to contribute to negative views about immigrants.7
The NASEM–Cato model shows the following:
- Every year from 1994 to 2023, immigrants have paid more in taxes than they received in benefits.
- Immigrants generated nearly $10.6 trillion more in federal, state, and local taxes than they induced in total government spending.
- Accounting for savings on interest payments on the national debt, immigrants saved $14.5 trillion in debt over this 30-year period.
- Immigrants cut US budget deficits by about a third from 1994 to 2023, and fiscal savings grew to $878 billion in 2023 (Figure 1).
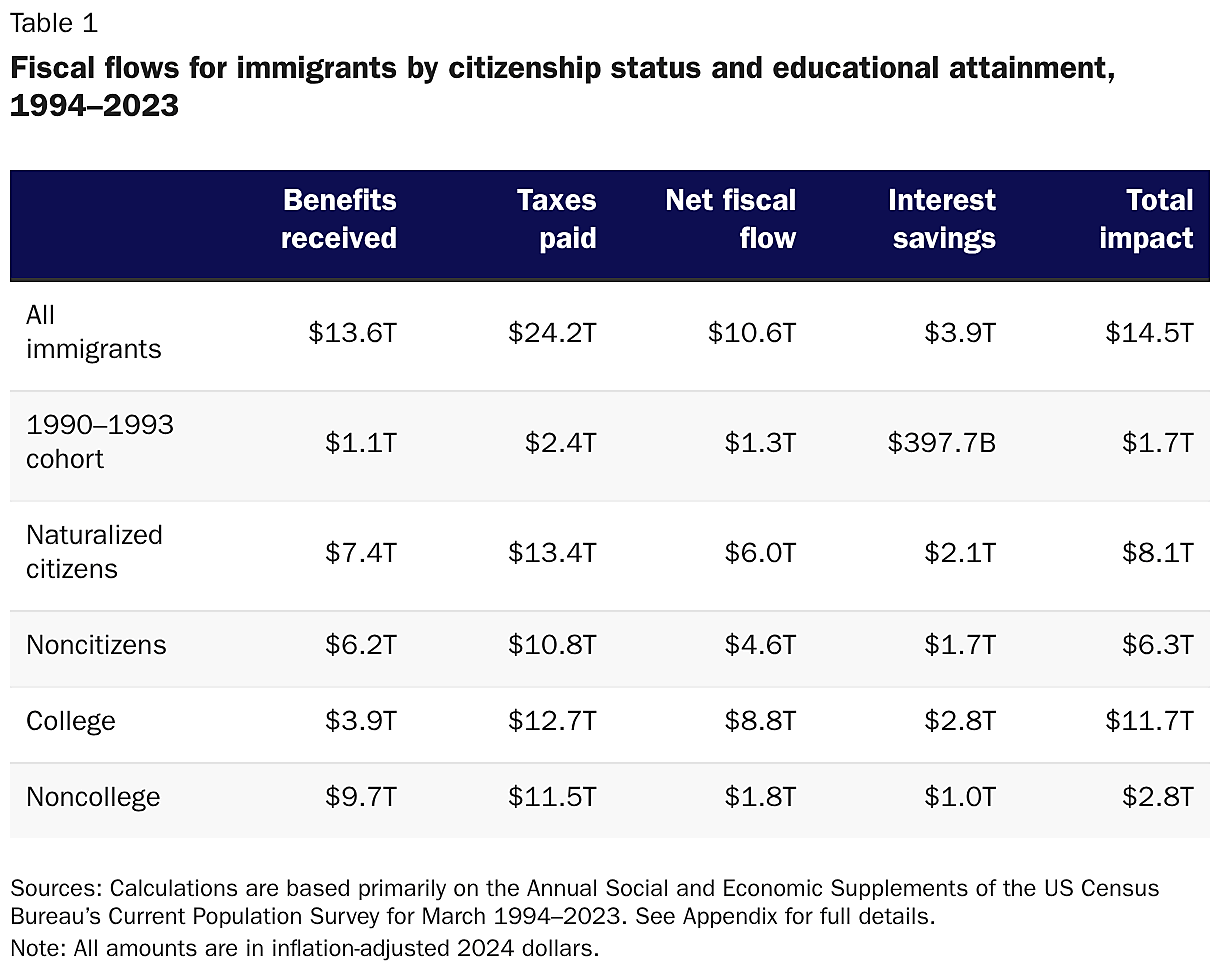
- Noncitizens accounted for $6.3 trillion of the $14.5 trillion debt savings.
- College graduate immigrants accounted for $11.7 trillion in savings, while non–college graduates accounted for $2.8 trillion.
- The cohort of immigrants entering from 1990 to 1993, just before data collection began in 1994, was fiscally positive $1.7 trillion, and was still positive after 30 years in 2022–2023 (Table 1).
- Even including the second generation (see Box 1 for definitions), who are mostly still children who will become taxpayers soon, the fiscal effect of immigration was positive every year.
- Immigrants in all categories of educational attainment, including high school dropouts, lowered the ratio of deficit to gross domestic product (GDP) during the 30-year period.
- Without the contributions of immigrants, public debt at all levels would already be above 200 percent of US GDP—nearly twice the 2023 level and a threshold some analysts believe would trigger a debt crisis.8
Our results represent the lowest possible fiscal surplus that immigrants provide to US government budgets. This is because the NASEM–Cato model is a static accounting model that does not include indirect economic effects of immigration, such as improving the productivity of US workers.9 For instance, the Congressional Budget Office (CBO) estimates that one-third of the fiscal surplus from the surge of immigration from 2021 to 2024 came from indirect economic effects,10 but none of these revenues can be attributed to immigrants in the NASEM–Cato model, as we are only tracing accounting payments to and from immigrants, not modeling the entire economy. The model also does not account for how accruing less debt would have reduced interest rates on debt, enhancing the savings on interest payments.11
Why Immigrants Were Fiscally Positive
The US government spends more than it receives in taxes and other revenue, so many people believe that deporting a person with average characteristics would improve the deficit. They reason that, with fewer US residents, there would be a commensurate decrease in government spending and thus a lower deficit.
However, a significant portion of government spending consists of items that do not causally increase or decrease with population. For instance, the US military, nuclear arsenal, and NASA spaceflight would remain the same regardless of whether the US population grew or shrank by a million people. In this analysis, we call these items “pure public goods” and refer to all other spending as “benefits.” Pure public goods are mainly national defense and interest payments on debt accrued before the immigrants arrived.12 As we explain in more detail in the Appendix, immigrants may benefit from this spending, but they do not require the government to spend more on these items. Indeed, immigrants may even decrease these costs for the US-born by lowering interest rates and decreasing military recruitment costs. And they certainly ease the fiscal load on the US-born, because immigrant taxpayers help shoulder the fiscal burden of these expenditures.
Immigrant Public Revenues and Expenditures
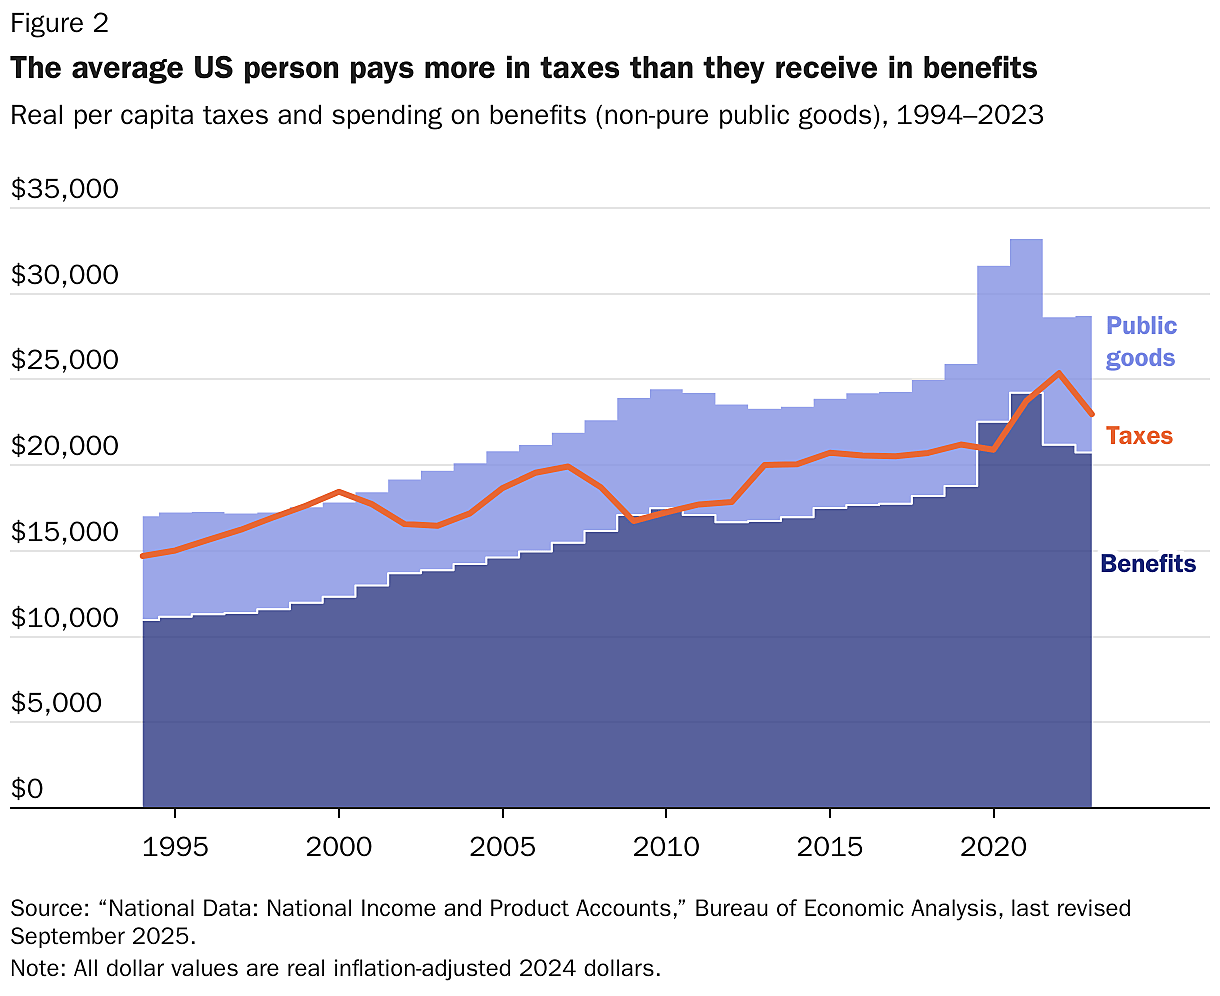
From 1994 to 2023, per capita tax revenue outstripped per capita spending on government benefits—that is, spending excluding pure public goods (Figure 2). Thus, an additional person with average characteristics was fiscally positive, generating more revenue than spending in each of the 30 years except four (2009, 2010, 2020, and 2021). Therefore, as long as government expenditures and receipts for immigrants were not significantly different from the average person, that person must also have been fiscally positive. In fact, the NASEM–Cato model shows that immigrants generate higher-than-average tax revenues overall and trigger lower-than-average government expenditures.
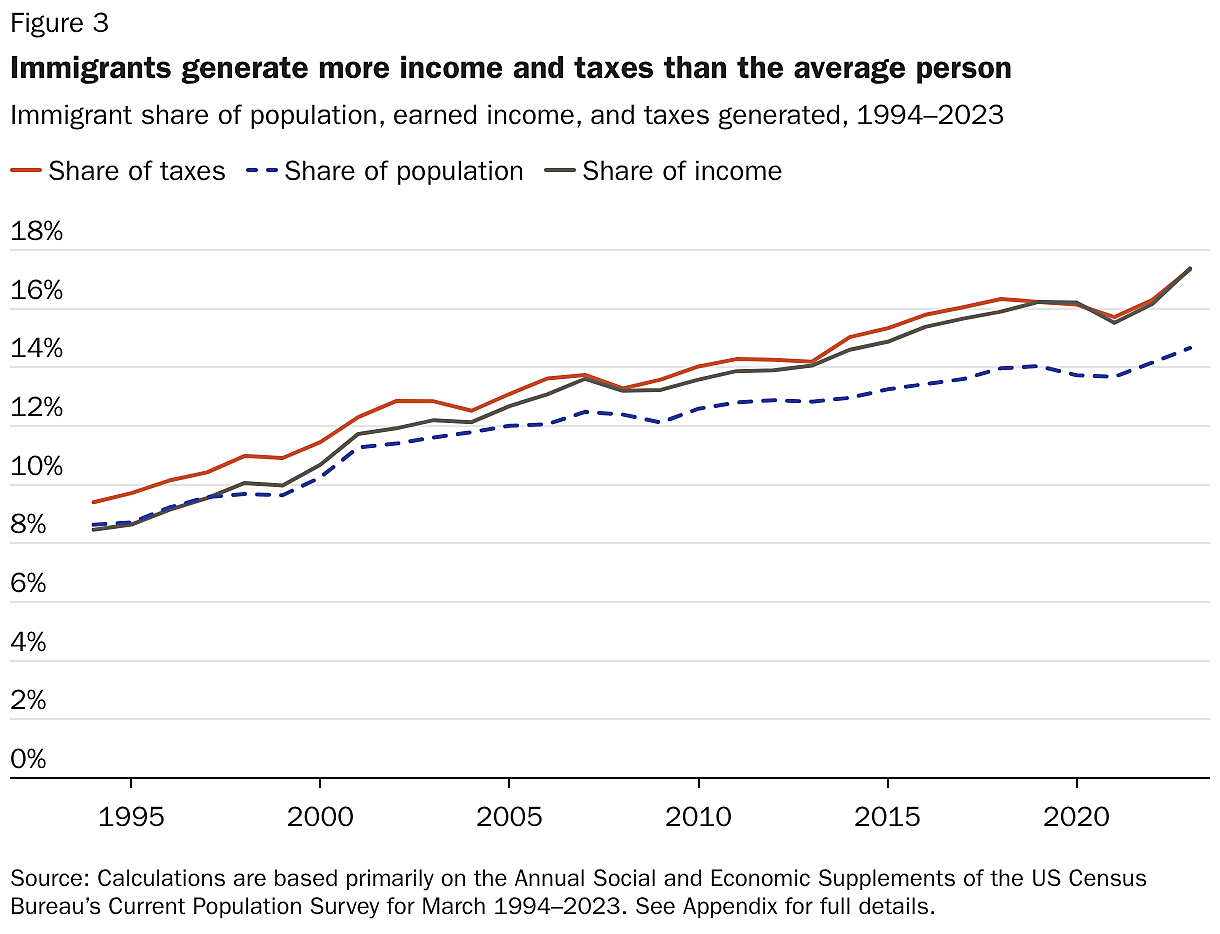
Tax revenues: For tax receipts, immigrants accounted for a higher share of revenue than their share of the population, indicating that they generated more taxes than the average person, who, as noted earlier, already pays more in taxes than they receive in benefits. The primary reason per capita immigrant tax revenues were higher than average was that they accounted for a disproportionately higher share of total earned income (Figure 3).13 This gap has developed and grown over the last 30 years.
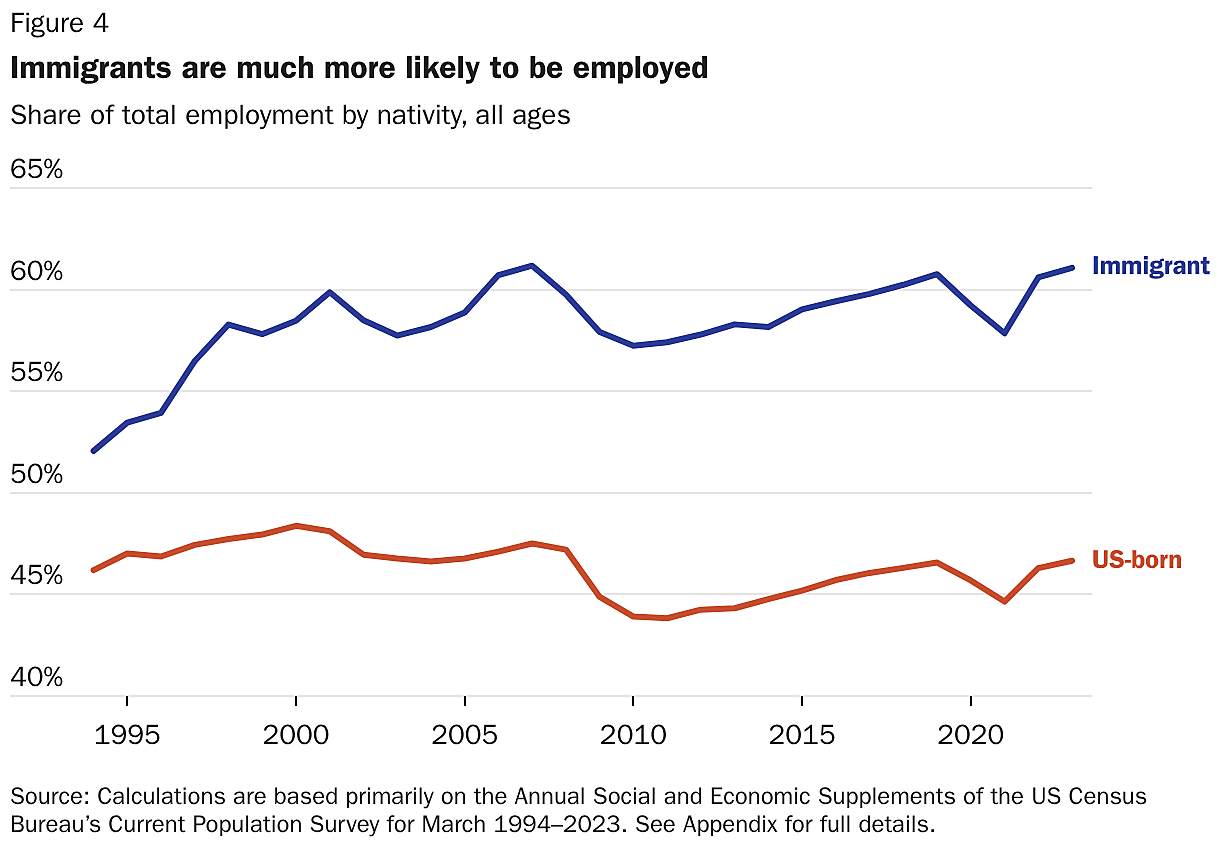
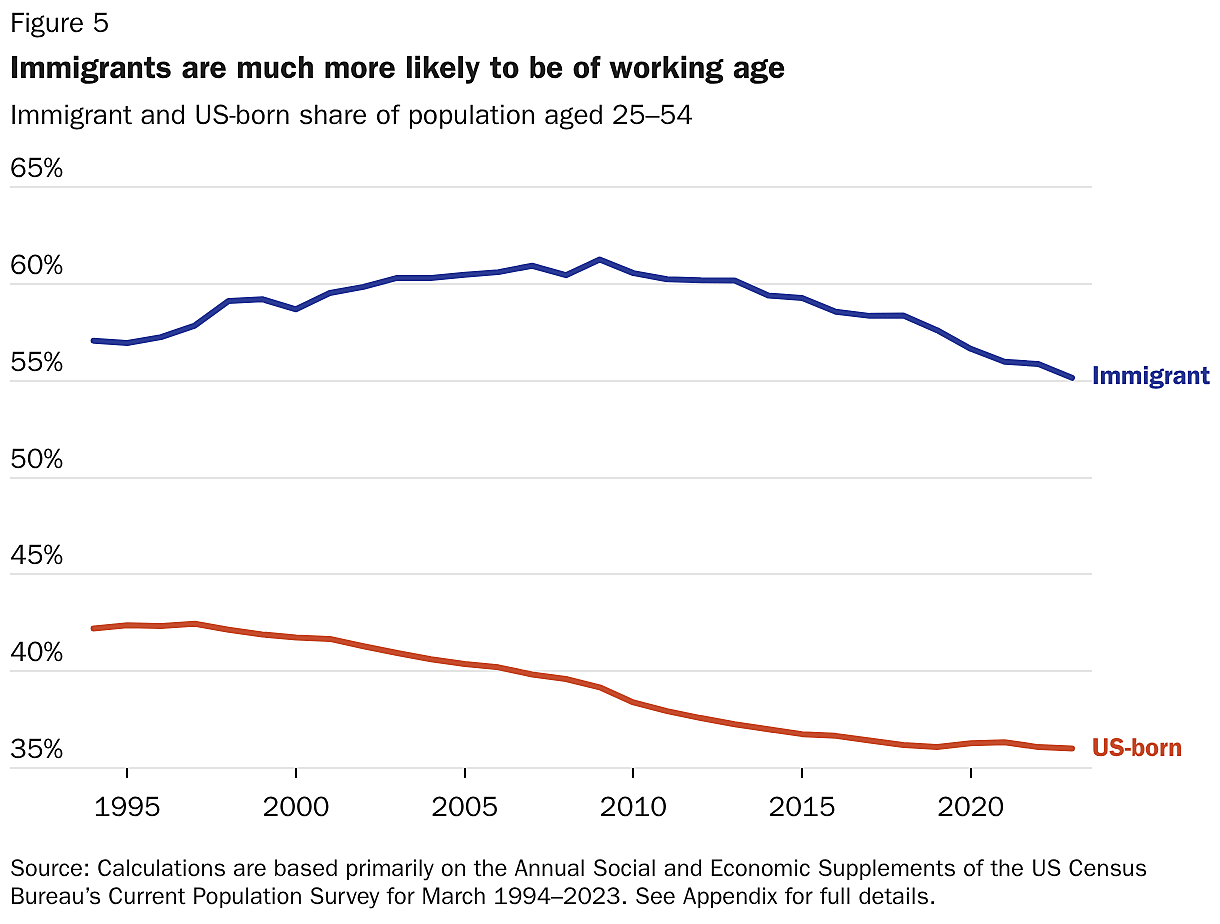
Immigrants accounted for more US income and generated more revenue for the government because they were, on average, over 12 percentage points more likely to be employed than the US-born population (Figure 4). This means that even if immigrants earn lower hourly wages, they can still account for more total income per capita than the US-born population by working cumulatively more hours. This higher employment rate was driven by the fact that immigrants were, on average, 20 percentage points more likely to be of working age (Figure 5). Immigrants usually arrive in the US as young adults and often leave before retirement.
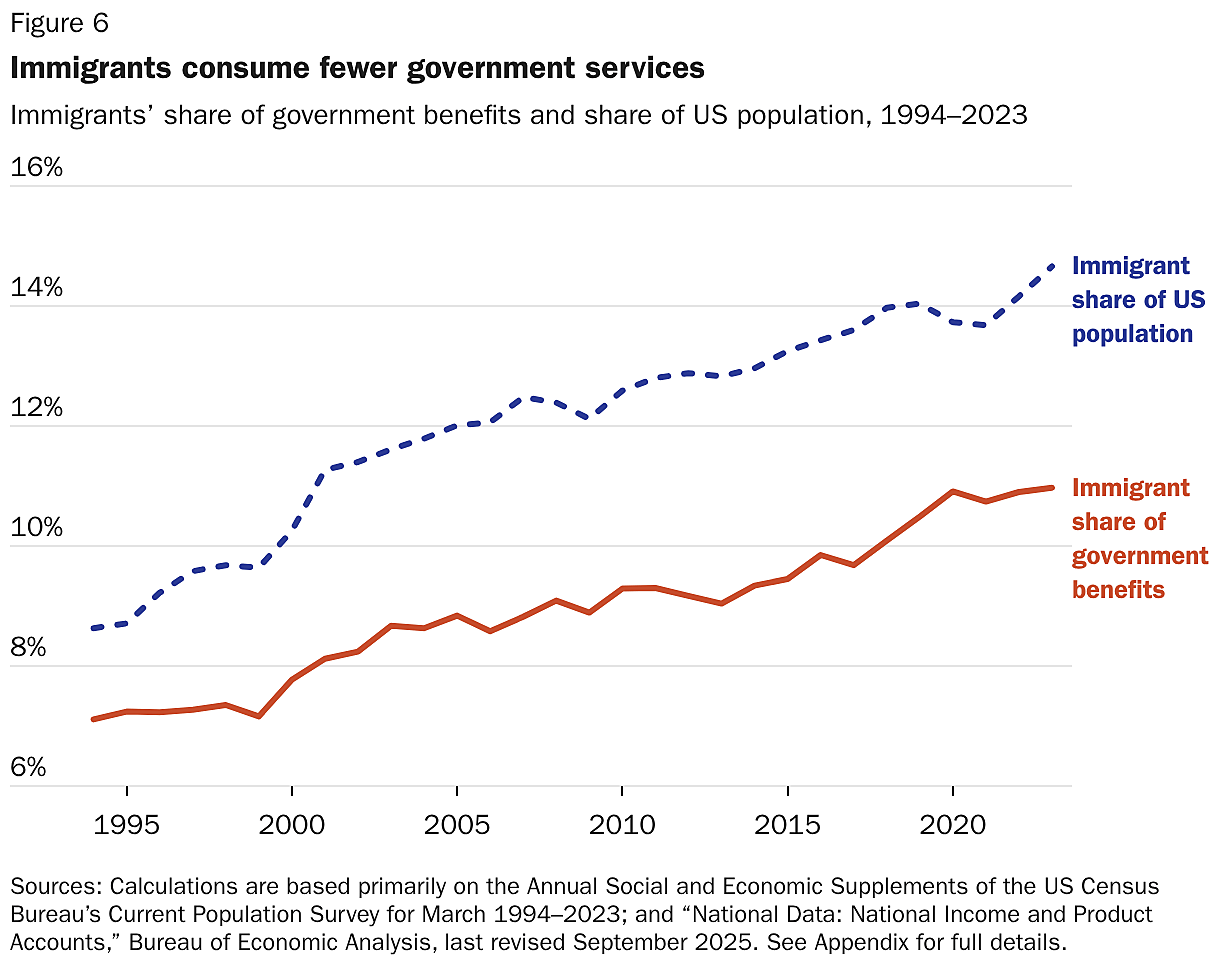
The NASEM–Cato model shows that throughout the entire 1994–2023 period, immigrants consumed much less in government benefits than their share of the population would predict, and the gap has grown (Figure 6). In 1994, the immigrant share of government expenditures was 18 percent below their share of the population; in 2023, it was 25 percent below.
In fact, the average immigrant consumes about the same as, or less than, the average US citizen for every broad type of government expenditure throughout the entire 30-year period. Federal, state, and local government spending can be divided into the following six categories:
- pure public goods (29 percent of spending from 1994 to 2023);
- old-age benefits (28 percent);
- needs-based benefits (16 percent);
- education (14 percent);
- felony policing, courts, and prisons (3 percent); and
- all other spending (10 percent).14
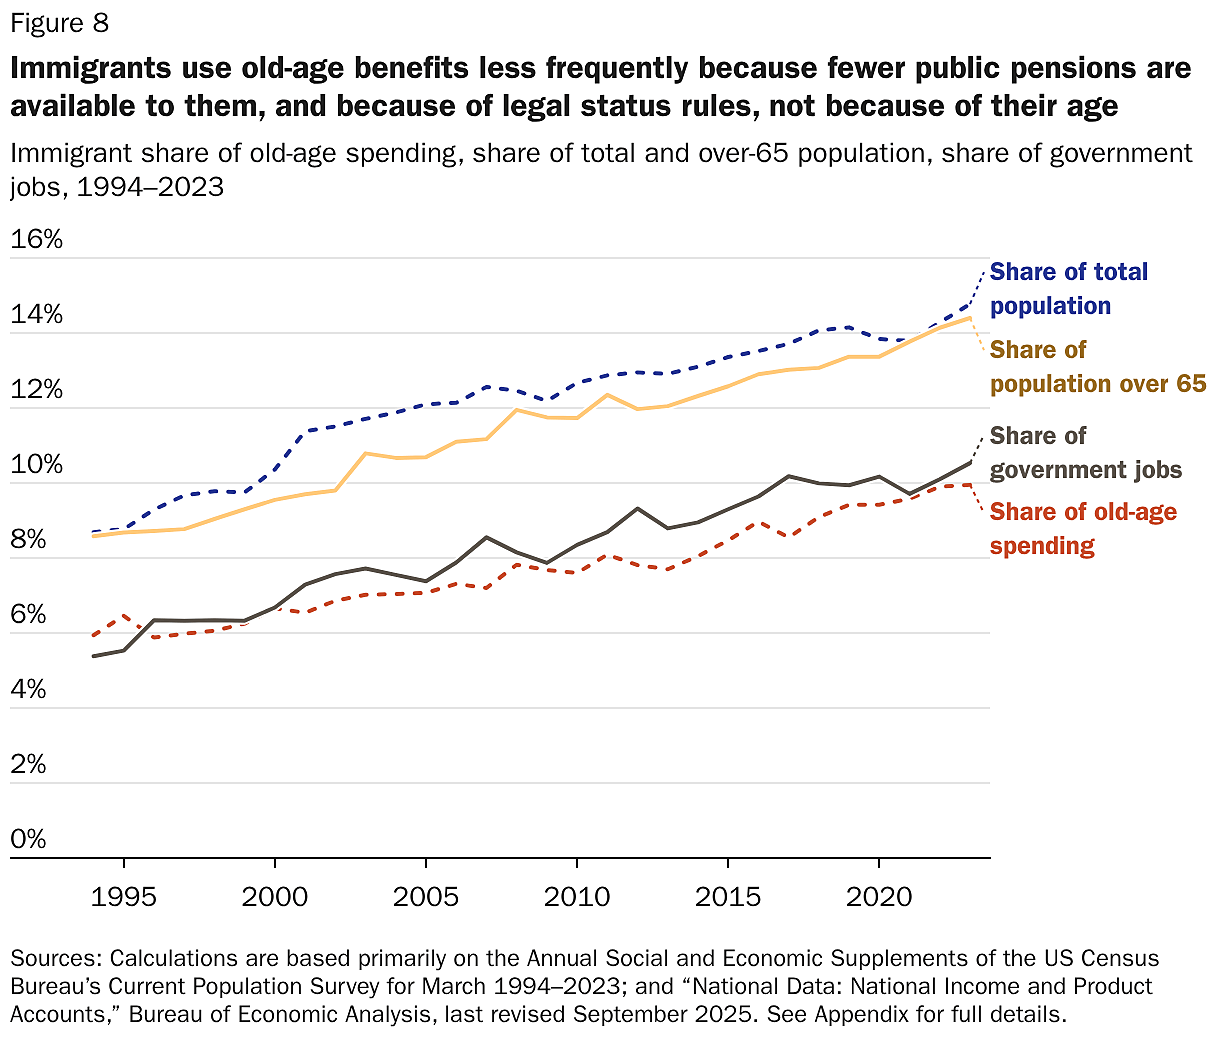
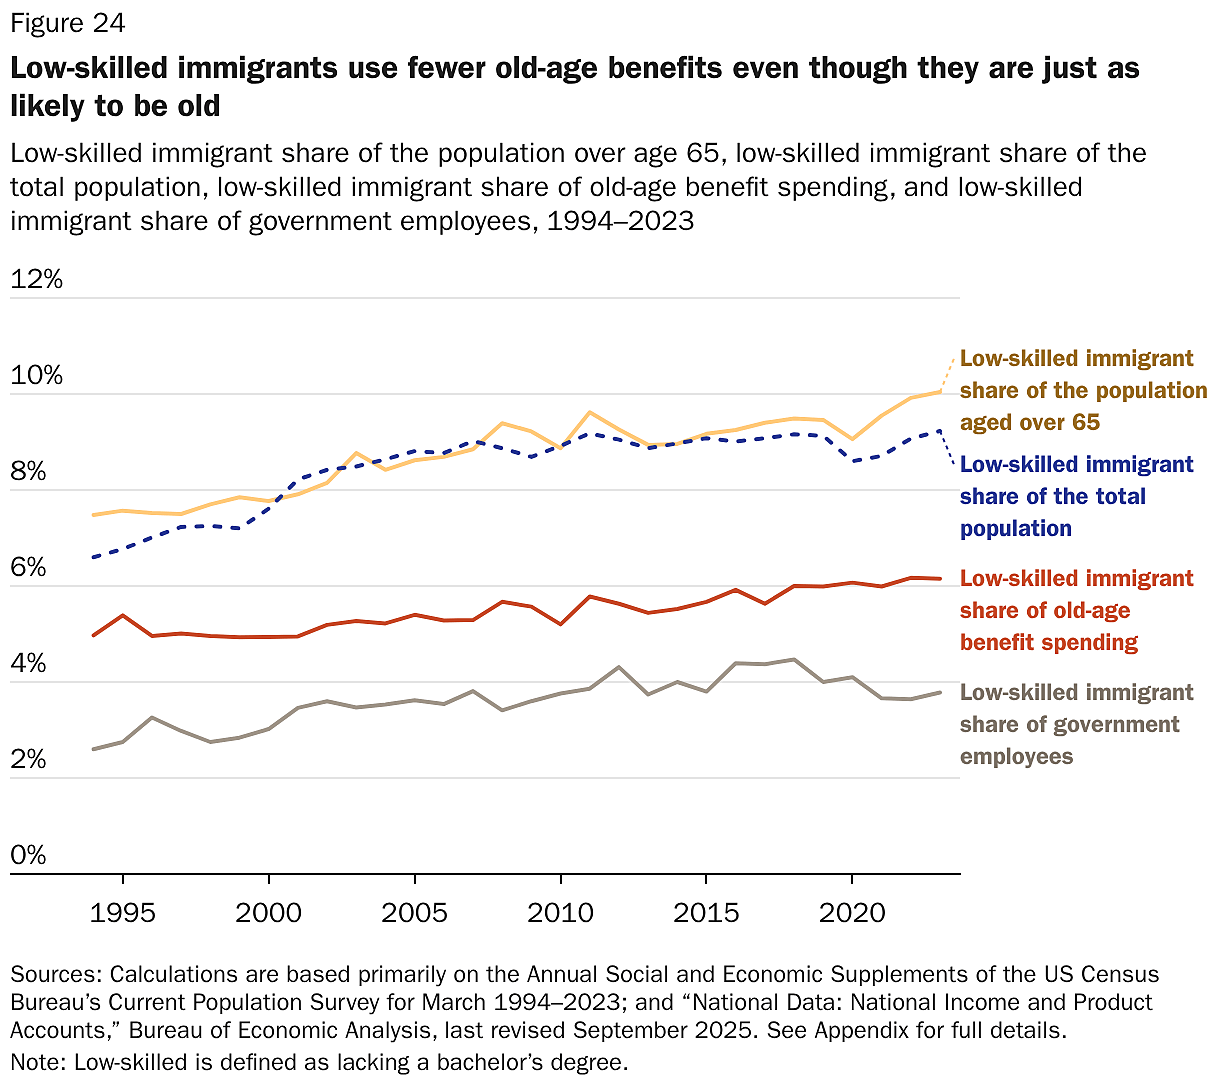
As explained earlier, immigrants do not add anything to the costs of pure public goods—the single largest category of spending, defined as costs that do not increase with population growth. In addition, immigrants impose significantly lower costs associated with old-age benefits, education, and prisons (Figure 7).
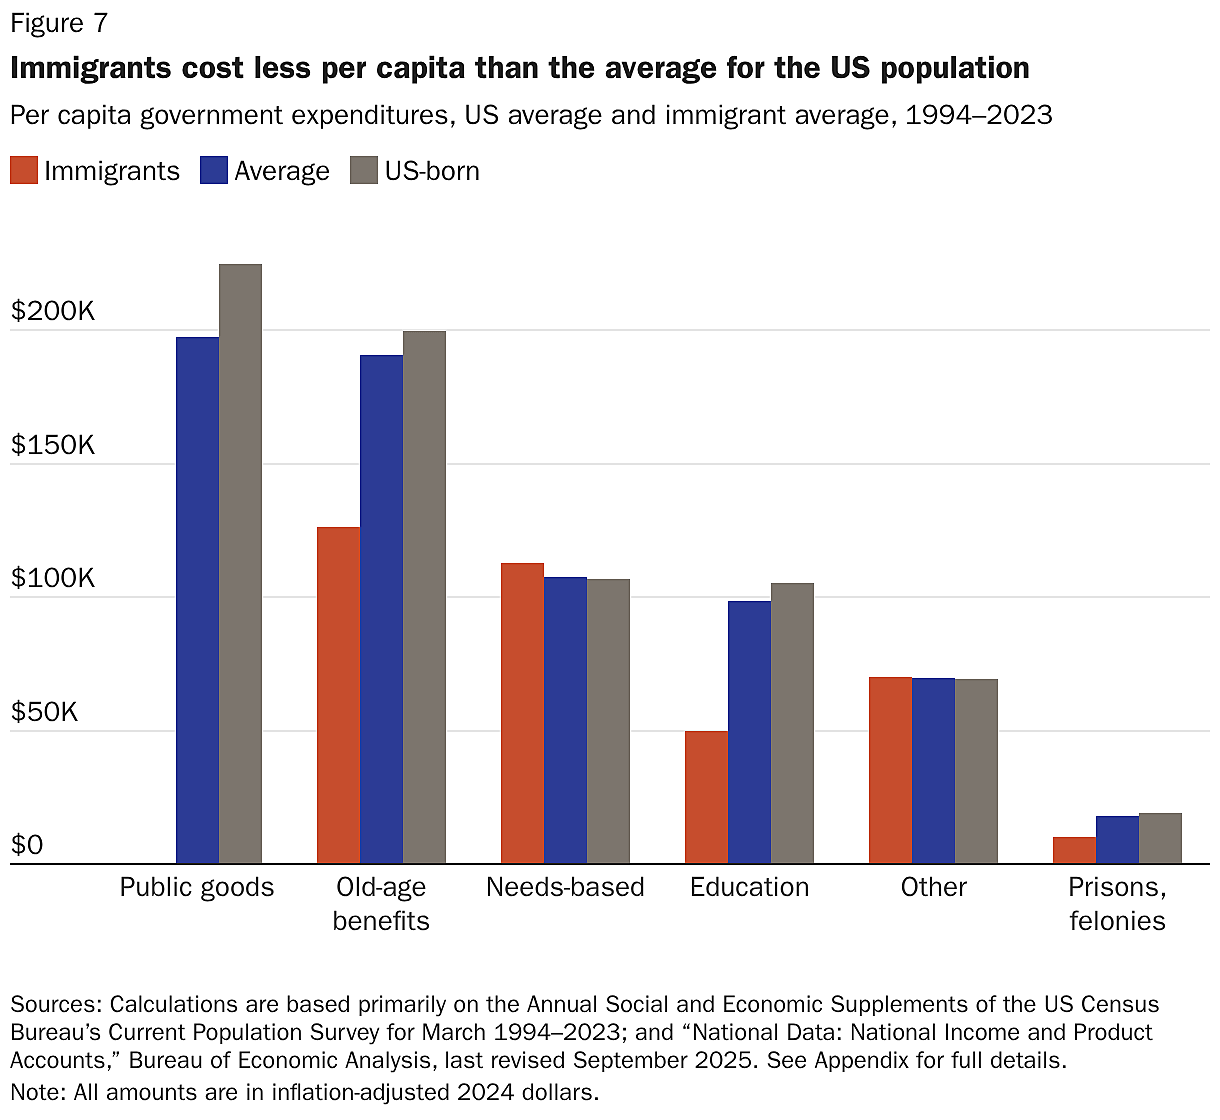
Old-age benefits: Immigrants imposed 34 percent lower costs per capita than the US average for old-age benefits: Social Security (31 percent less), Medicare (20 percent less), and government pensions and retirement (64 percent less). Immigrants were only slightly underrepresented among the over-65 population (Figure 8), so the main explanation for the gap is that the law limits Social Security and Medicare to those with a qualifying work history in the United States who are also lawfully present in the United States.15 Many immigrants arrive after already having reached working age. Almost as important is the fact that immigrants were only about half as likely to work for the government, so they consume 64 percent less of exceedingly expensive government pensions than the average resident.16 Finally, immigrants consume 20 percent less Medicare per capita, partly because of immigration status requirements and work history, but also because immigrants are in better health than the US-born population.17
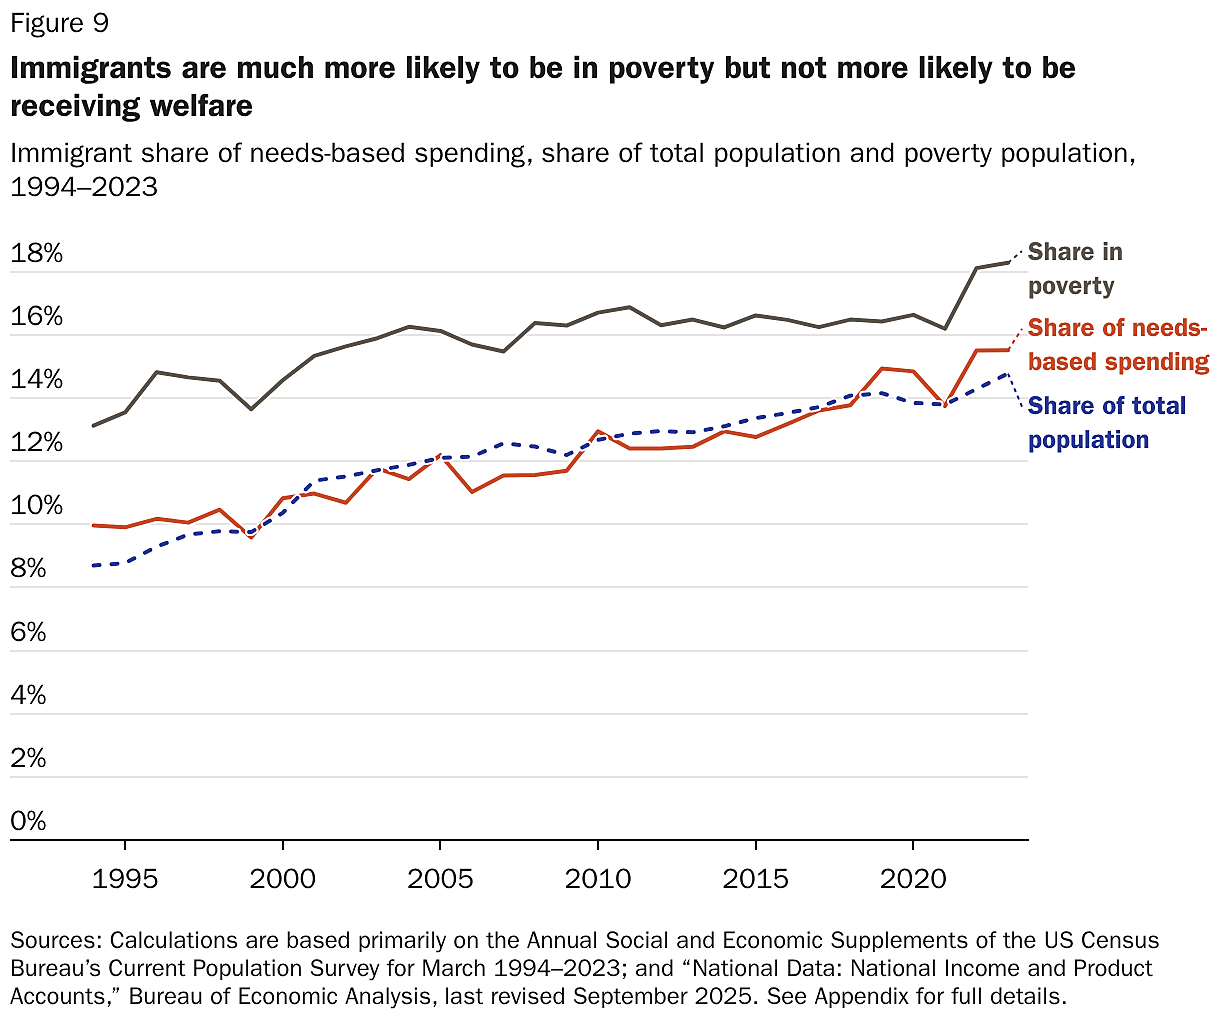
Needs-based benefits: Immigrants imposed close to the average cost for needs-based programs, with Medicaid, food assistance, unemployment insurance, and refundable tax credits being the largest components.18 In the absence of immigration status rules, immigrants would likely have cost the government more in needs-based spending. This is because they were more likely to be living in poverty (Figure 9), and there were also special benefits provided only to refugees and some asylum seekers. However, immigrants must generally have lawful permanent residence for at least five years to qualify for these programs, at least at the federal level, and most states maintain that limit as well.19 Again, immigration status requirements are effective in reducing immigrants’ use of benefits, and the One Big Beautiful Bill (Public Law 119–21), enacted in July 2025, will further limit benefits to noncitizens.20
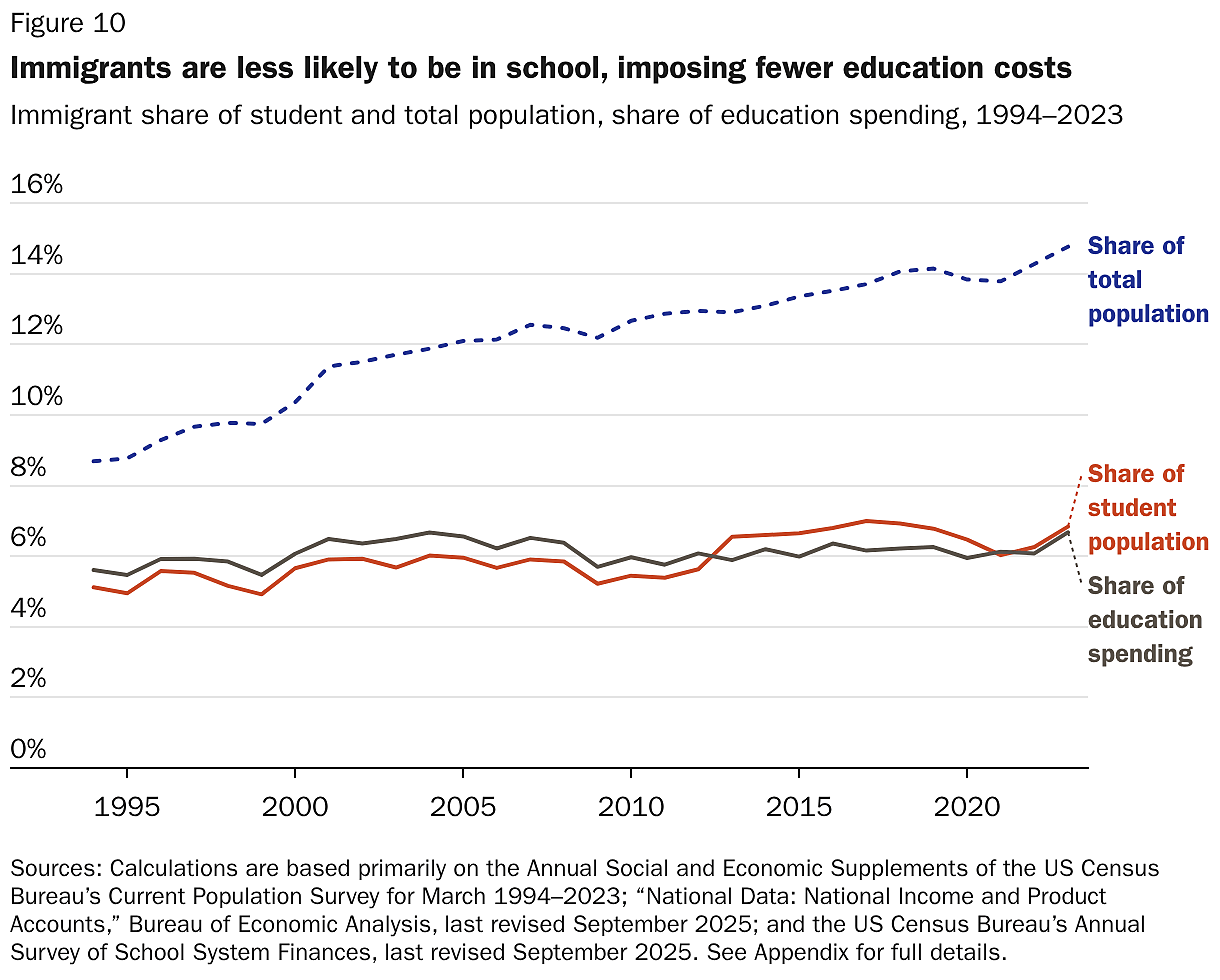
Education: Immigrants cost the US education system 50 percent less per capita than the US population overall. Because of special programs for English-language learners, immigrants in school can be more expensive than other students in school. But because immigrants are much less likely to be in school, they cost the system much less overall. Most immigrants arrive in the US after they have completed their schooling. Moreover, in higher education in most states, illegal immigrants usually must pay full tuition.21 At the same time, most noncitizens enrolled in institutions of higher education are international students,22 and each international student at public universities covers the cost of enrolling two other students.23 As a result, immigrant students impose lower costs per student in higher education (Figure 10).
Throughout this paper, we use “immigrants” to refer only to people who were noncitizens at birth. Of course, immigrants have US-born children who attend schools, but those children are natural-born Americans, not immigrants; attributing their costs to the “immigrant” category would be inaccurate and would incorrectly lower the cost of the US-born population. It would also obscure the comparison with the US-born population. Finally, treating the second generation as immigrants would lead to an inaccurate perception regarding the ability of Congress to restrict benefits to immigrants specifically. Regardless, as we show in a later section, the second generation is America’s most fiscally positive generation at any given age, meaning that children of immigrants will pay for their costs in the future once they graduate. In any case, we also show that despite the initial net costs of their children, immigrants with their children still reduced the deficit significantly during the period 1994–2023.
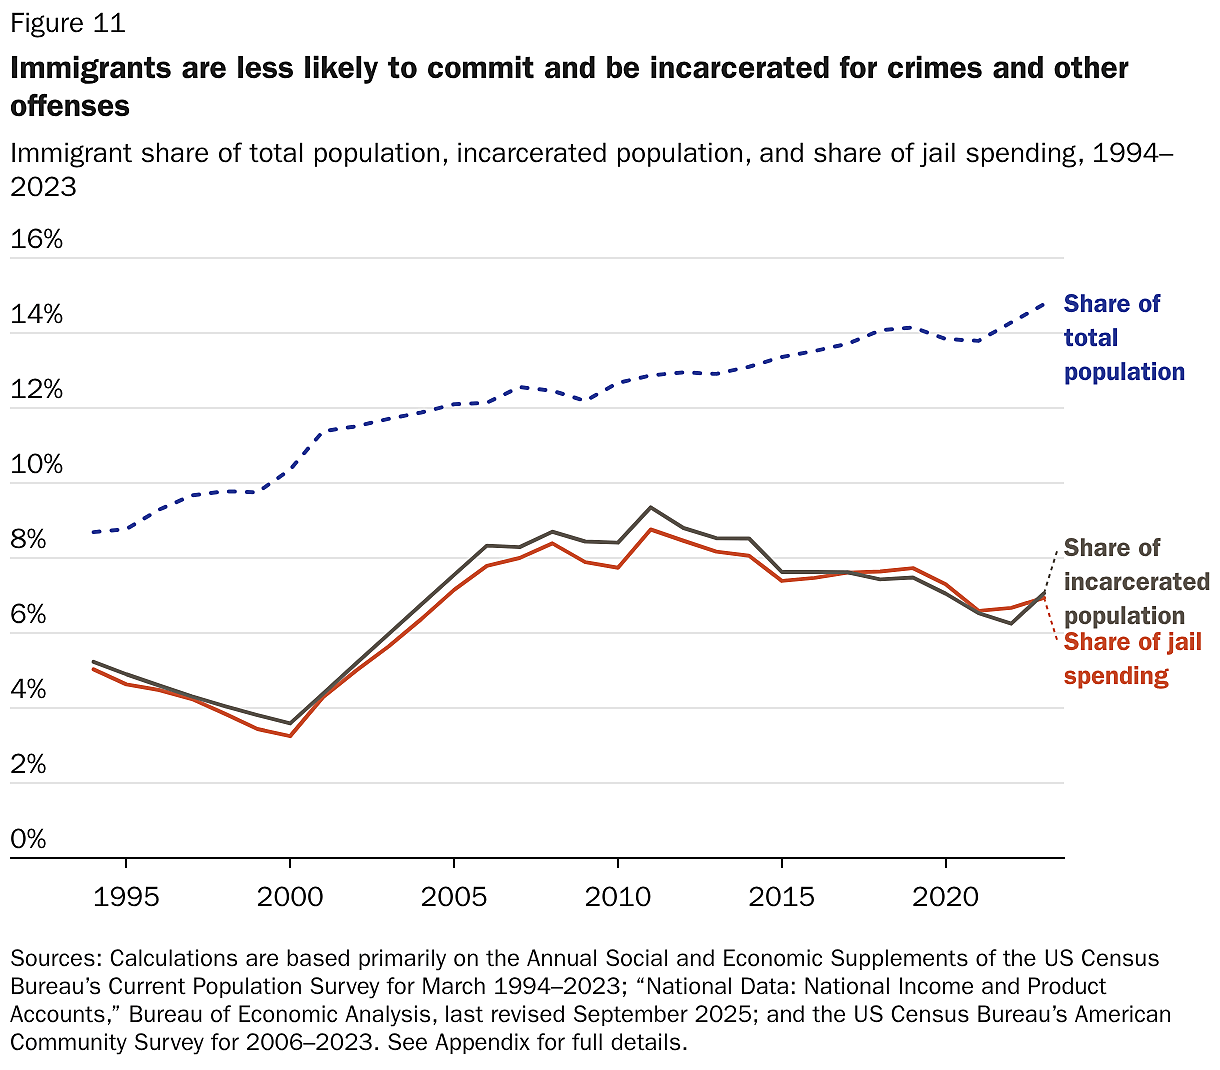
Felony policing and prisons: Immigrants impose 44 percent lower costs per capita on prisons, felony policing, and courts than the average person (see the Appendix for how we estimated felony policing and court costs). From 1994 to 2023, immigrants were about half as likely to be incarcerated as the US-born population, reducing the burden on courts and policing for serious crimes (Figure 11).24 This is despite the fact that a significant portion of incarcerated immigrants are incarcerated or detained for immigration offenses that the US-born population cannot commit.25 Although important within the context of law enforcement spending, this effect has modest savings compared to the savings on education, old-age benefits, and pure public goods.
All other spending: The NASEM–Cato model estimates that, for all other public spending—that is, spending on what are sometimes called “congestible public goods”—immigrants consume the same amount per capita as other US residents. These costs include everything from tax collection and fire protection to transportation and parks. To calculate this amount, the model takes the per capita spending for this category and multiplies it by the immigrant population.
Summary
Given the above considerations, immigrants produced a net fiscal benefit because:
- The United States collected more in taxes from the average person than it spent on benefits (excluding pure public goods).
- Immigrants paid higher-than-average taxes because their higher-than-average employment rate led to higher-than-average incomes.
- Immigrants cost the government less than average because they did not add to the cost of the government’s largest expenditure (pure public goods) and received lower-than-average benefits for other major items, particularly old-age benefits and education.
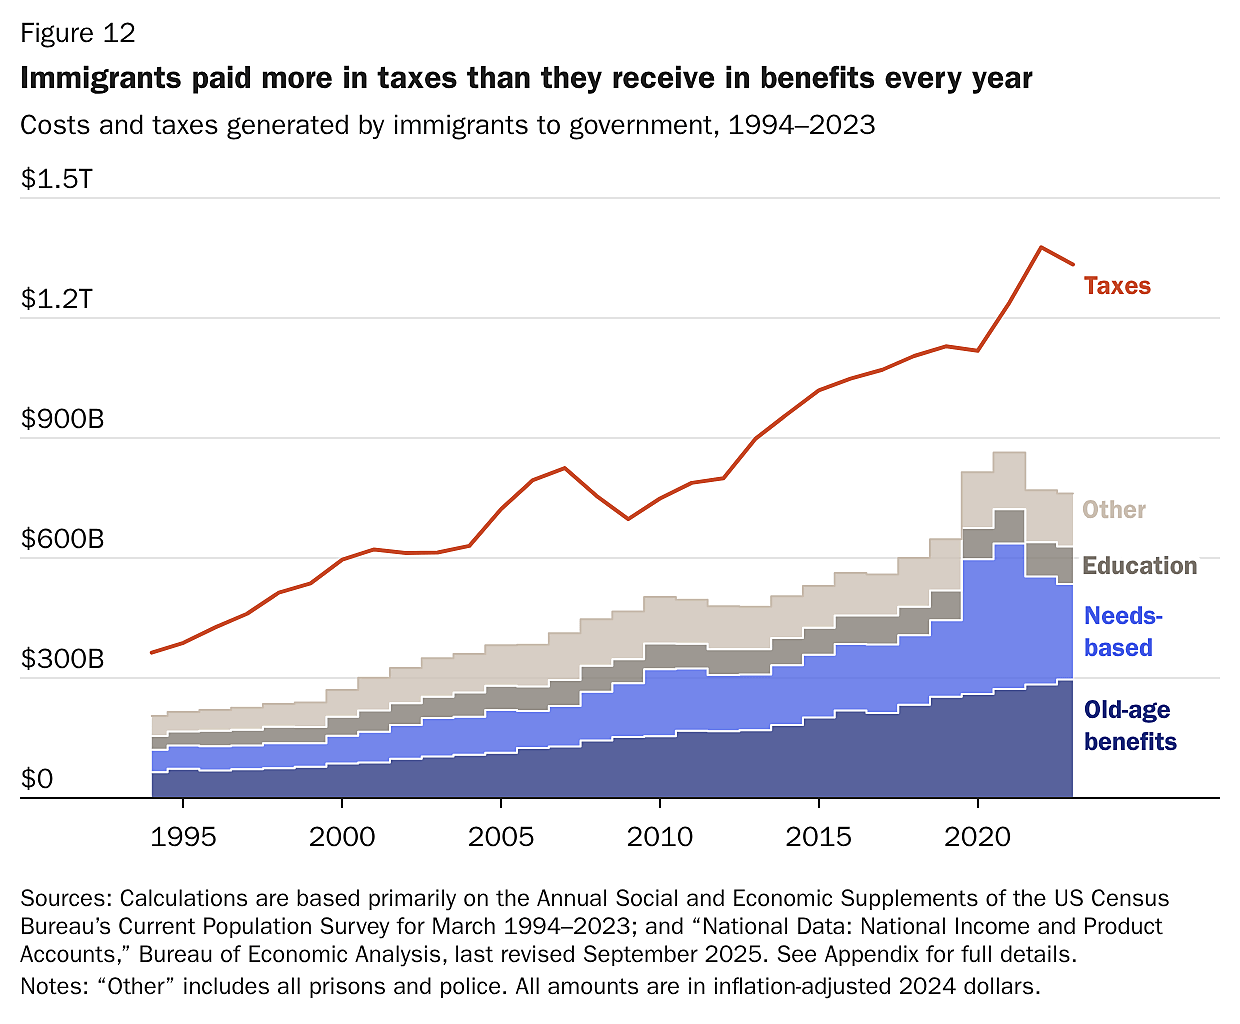
Figure 12 shows that the difference between immigrants’ taxes paid and benefits received has grown from $158 billion to $572 billion in real terms since 1994. In 2023, immigrants paid $1.3 trillion in taxes and received $761 billion in benefits.
Immigrants’ Net Effect on Government Revenue and Spending
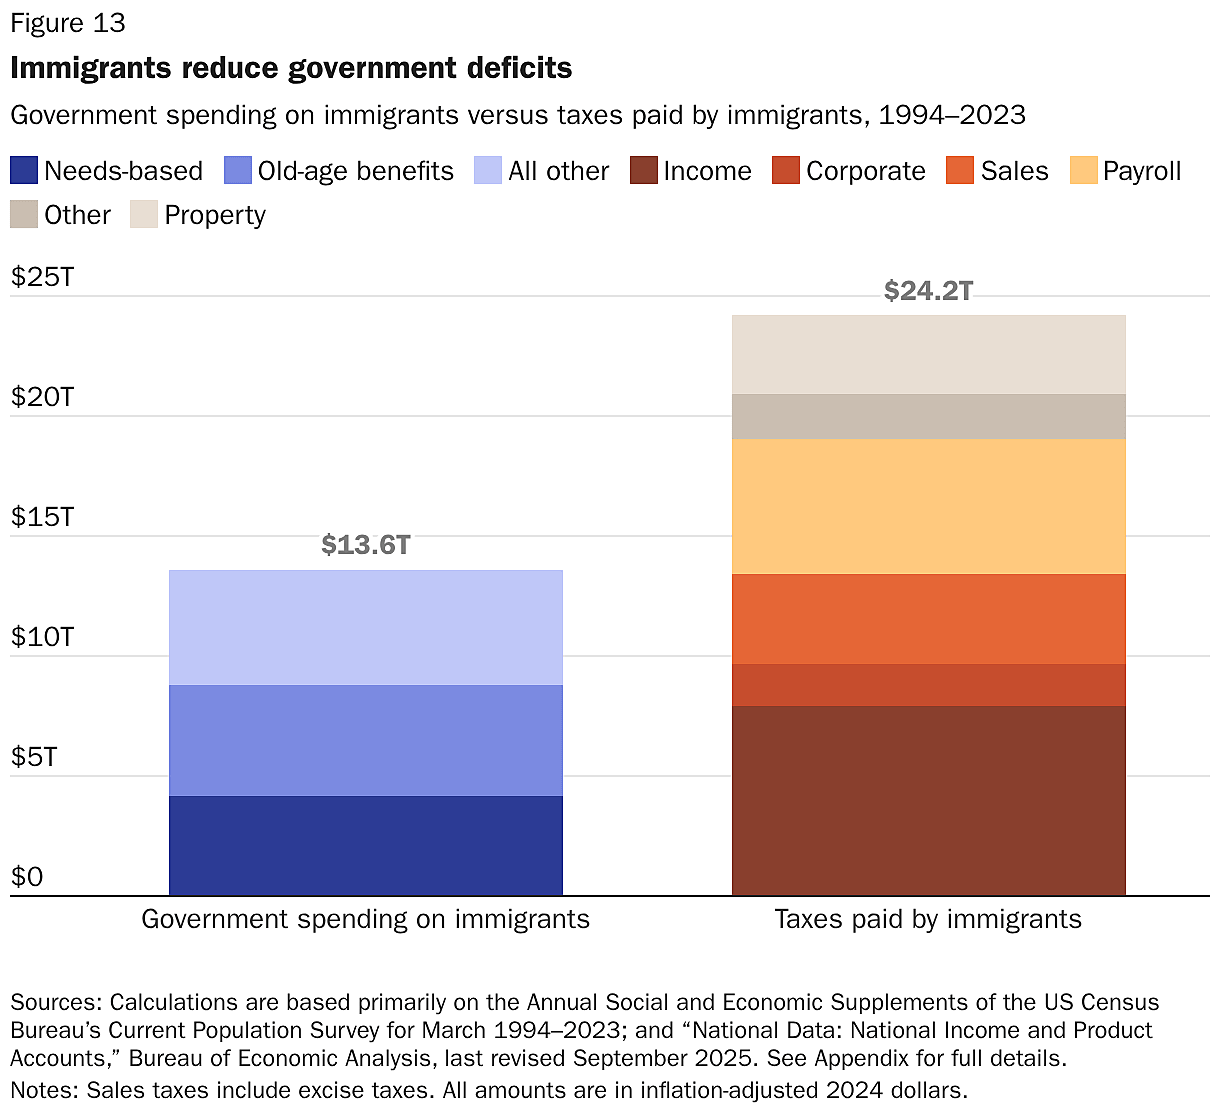
From 1994 to 2023, immigrants reduced US budget deficits substantially. Immigrants generated $24.2 trillion in taxes and triggered $13.6 trillion in costs, producing a net fiscal gain of $10.6 trillion (Figure 13). This was not the only fiscal benefit. The gain meant government did not have to borrow as much money to offset its deficit spending over the period; the resulting smaller interest payments on the avoided debt reduced government borrowing costs by $3.9 trillion. Hence, immigrants produced a total savings of about $14.5 trillion.
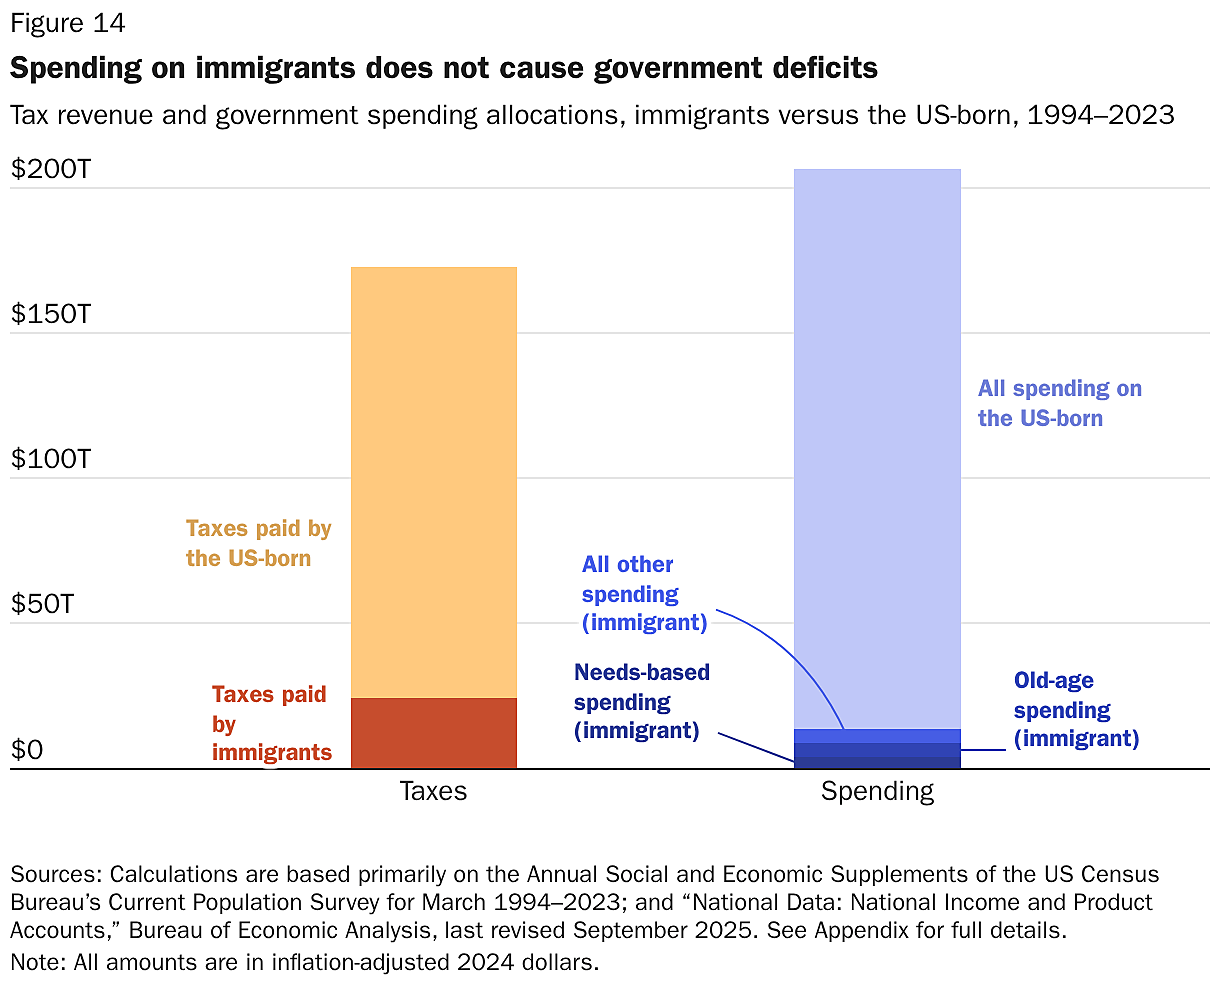
Although it has become commonplace for politicians to blame immigrants for the US budget deficit, Figure 14 shows how impossible it would have been for policymakers to close the budget gap by slashing immigration over the last 30 years. Even eliminating all spending on immigrants—while somehow keeping all their tax revenue—would not even cut the deficit in half. All government spending on immigrants represented just 40 percent of the budget deficits from 1994 to 2023. Transfer payments (old-age benefits and needs-based assistance) for immigrants were only 26 percent of the deficit. “Welfare” or needs-based assistance for immigrants, including all refundable tax credits and unemployment benefits, was just 12 percent of the deficit. Governments can easily increase the value of immigration by cutting these expenses without losing the upside from immigrants’ tax revenues.
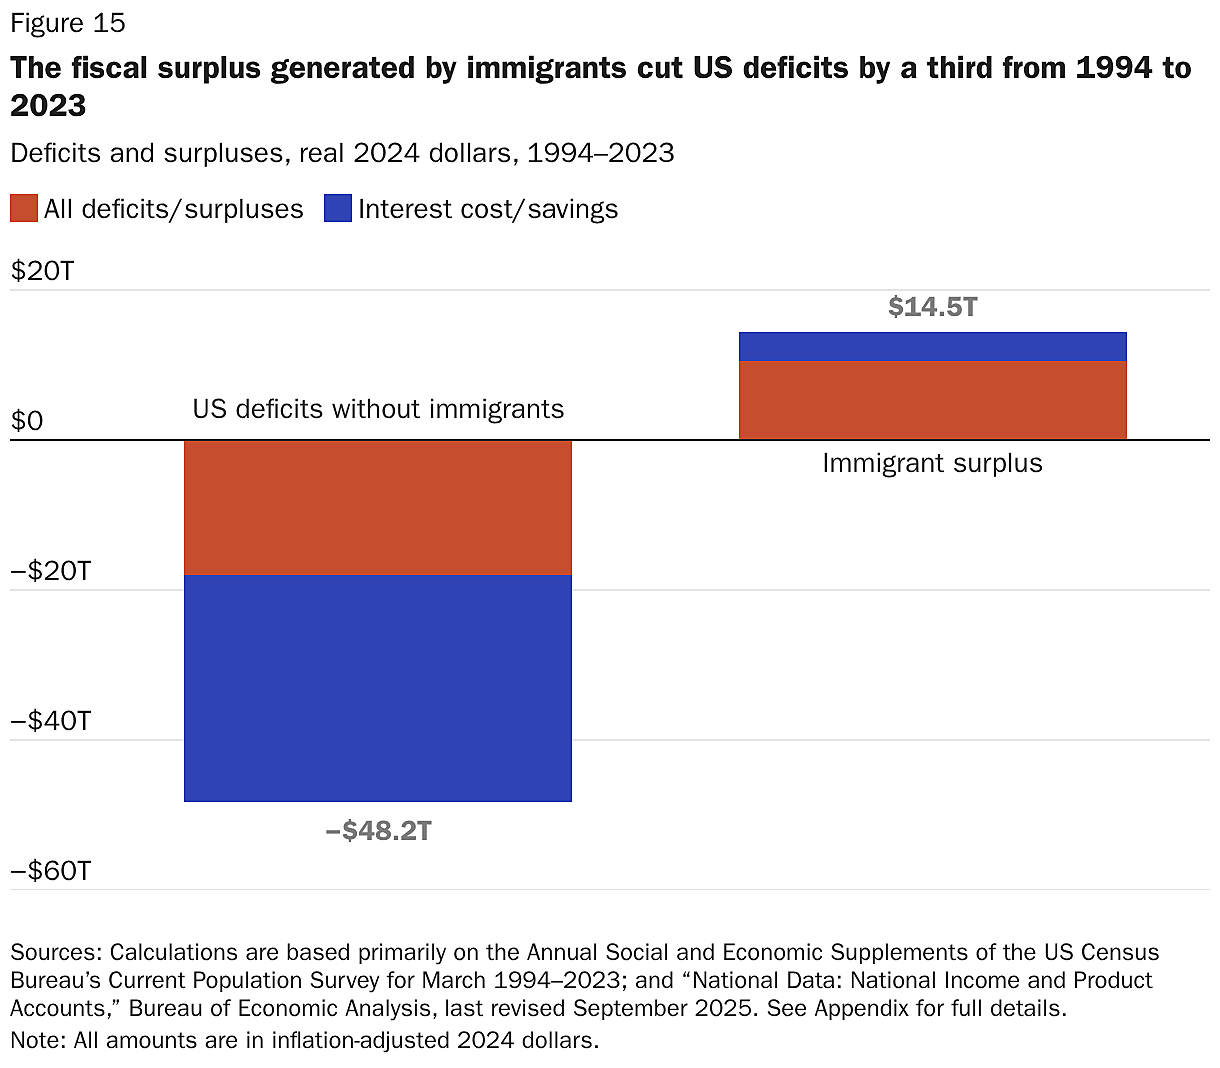
Immigrants have created an enormous fiscal surplus for the US government in a time when deficits have grown substantially. The $14.5 trillion in savings from immigrants is the equivalent of 33 percent of the total inflation-adjusted combined deficits from 1994 to 2023 without immigrants.26 Immigrants saved the US government $14.5 trillion, while the US population without immigrants cost the US government $44.4 trillion on net (Figure 15). In other words, immigrants cut the US budget deficits by nearly one-third in real terms.
From 1994 to 2023, on a per capita basis, immigrants paid nearly $100,000, or 17 percent, more taxes than the average US-born person (Table 2). This was predictable based on immigrants’ higher employment rates and higher per capita incomes, which will naturally lead to more tax revenue. Immigrants generated more than the US-born per capita for every type of government revenue except federal and state nontax revenues and supplemental medical insurance payments. Payroll and sales taxes are the most important drivers of the difference in tax revenue. One novel aspect of our model—accounting for overall indirect property tax revenue generated through immigration’s effect on housing prices—explains about 4 percent of immigrant taxes.

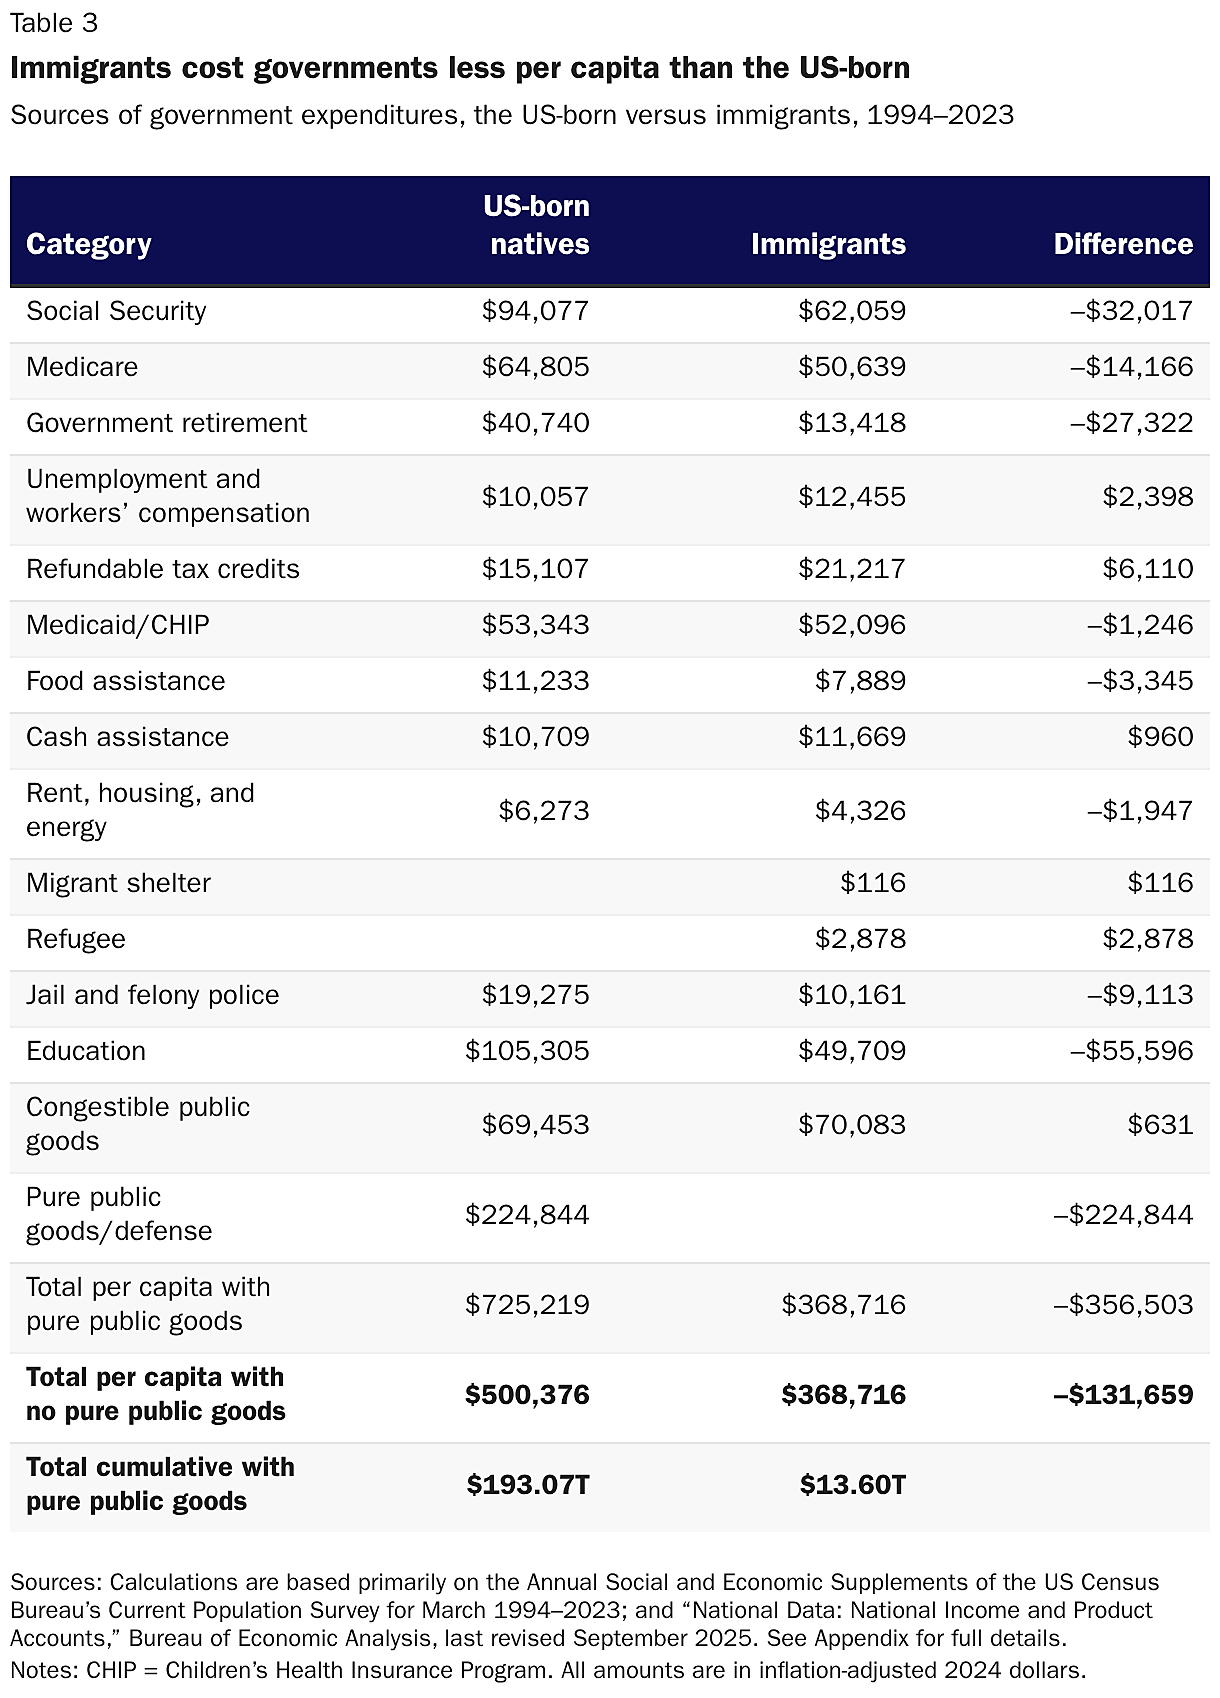
Immigrants cost all levels of government a total of $13.6 trillion from 1994 to 2023. On a per capita basis, immigrants cost the government roughly half as much as everyone else over the entire period. The other way to look at the cost of the US-born is to examine only the cost of benefits, excluding pure public goods. Even excluding these costs—which must be borne by the US population with or without immigrants—immigrants still resulted in $131,659, or 26 percent, lower costs per capita than the US-born over the 30-year period (Table 3). Notably, migrant shelter costs, which briefly strained some city budgets in 2023, are a rounding error in this 30-year nationwide exercise. The Appendix Variables List has a fuller breakdown by spending categories.
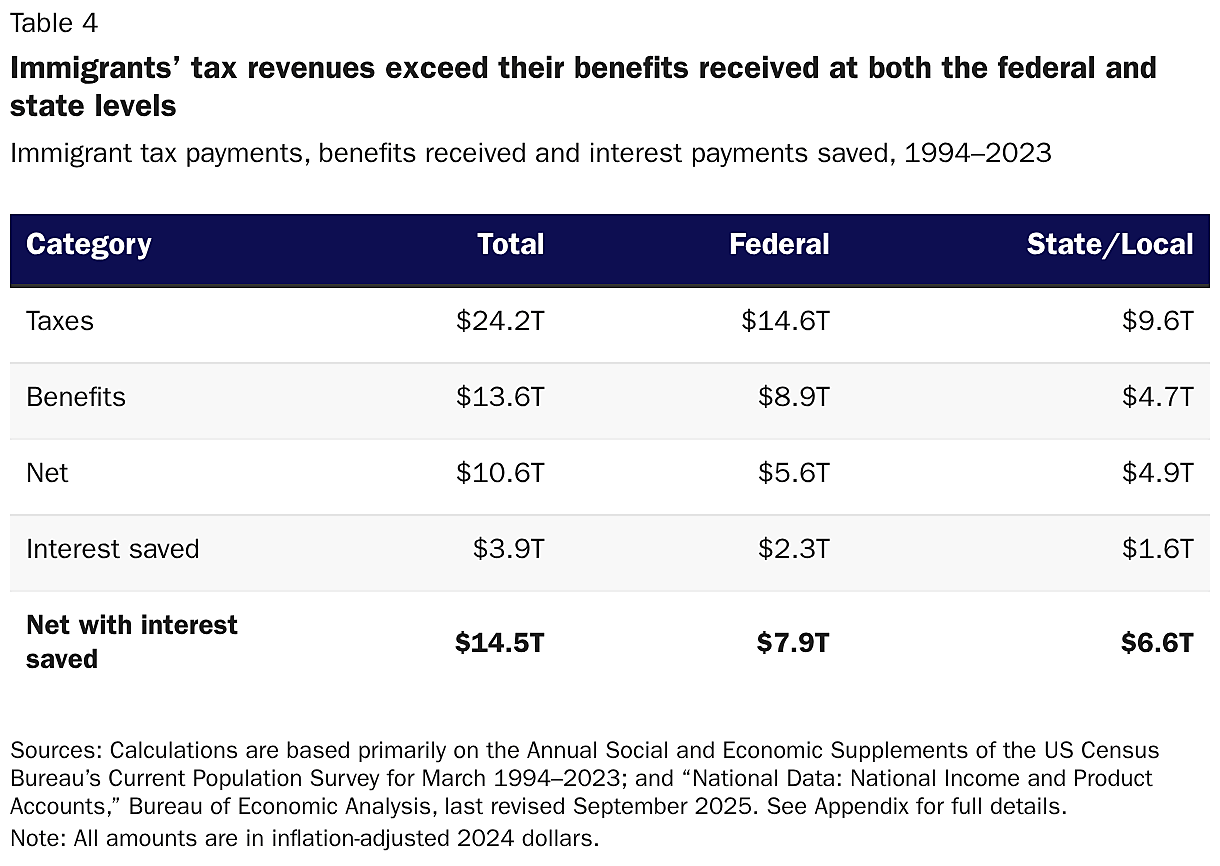
Therefore, the net effect of immigrants for all levels of government was positive $14.5 trillion from 1994 to 2023 (including interest savings). Immigrants were fiscally positive for both the federal government and the state and local governments. The net federal effect was $7.9 trillion, only slightly more than the net for states and localities. Immigrants paid $9.6 trillion in taxes to state and local governments but cost those governments only $4.7 trillion—primarily because immigrants consumed less in education, government pensions, and policing. This resulted in a total fiscal surplus of $6.6 trillion at the state and local level (Table 4).
Why Noncitizens Are Fiscally Positive
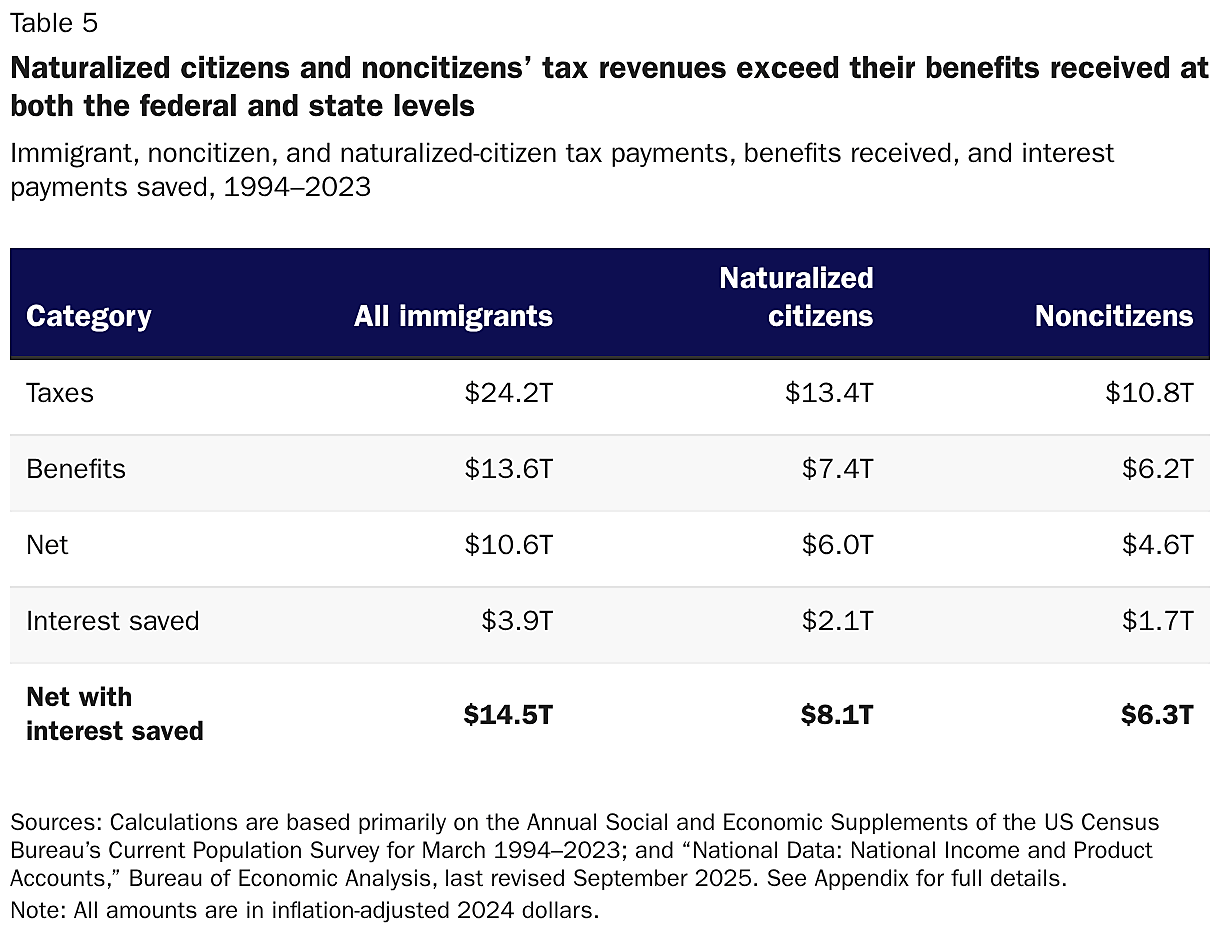
Noncitizen immigrants—about half of whom were in the United States illegally—were also fiscally positive to all levels of government.27 Indeed, immigrants without US citizenship accounted for nearly half (44 percent) of the positive net fiscal contribution from all immigrants from 1994 to 2023: $6.3 trillion in real terms including interest savings (Table 5). Unlike the immigrant population generally, noncitizens have lower-than-average incomes, so the sole reason for noncitizens’ positive net fiscal contribution is lower-than-average benefits receipt.28
Our findings for noncitizens mirror the pattern for immigrants overall: They reduced government deficits because they cost the government significantly less than the average amount it spent per person.
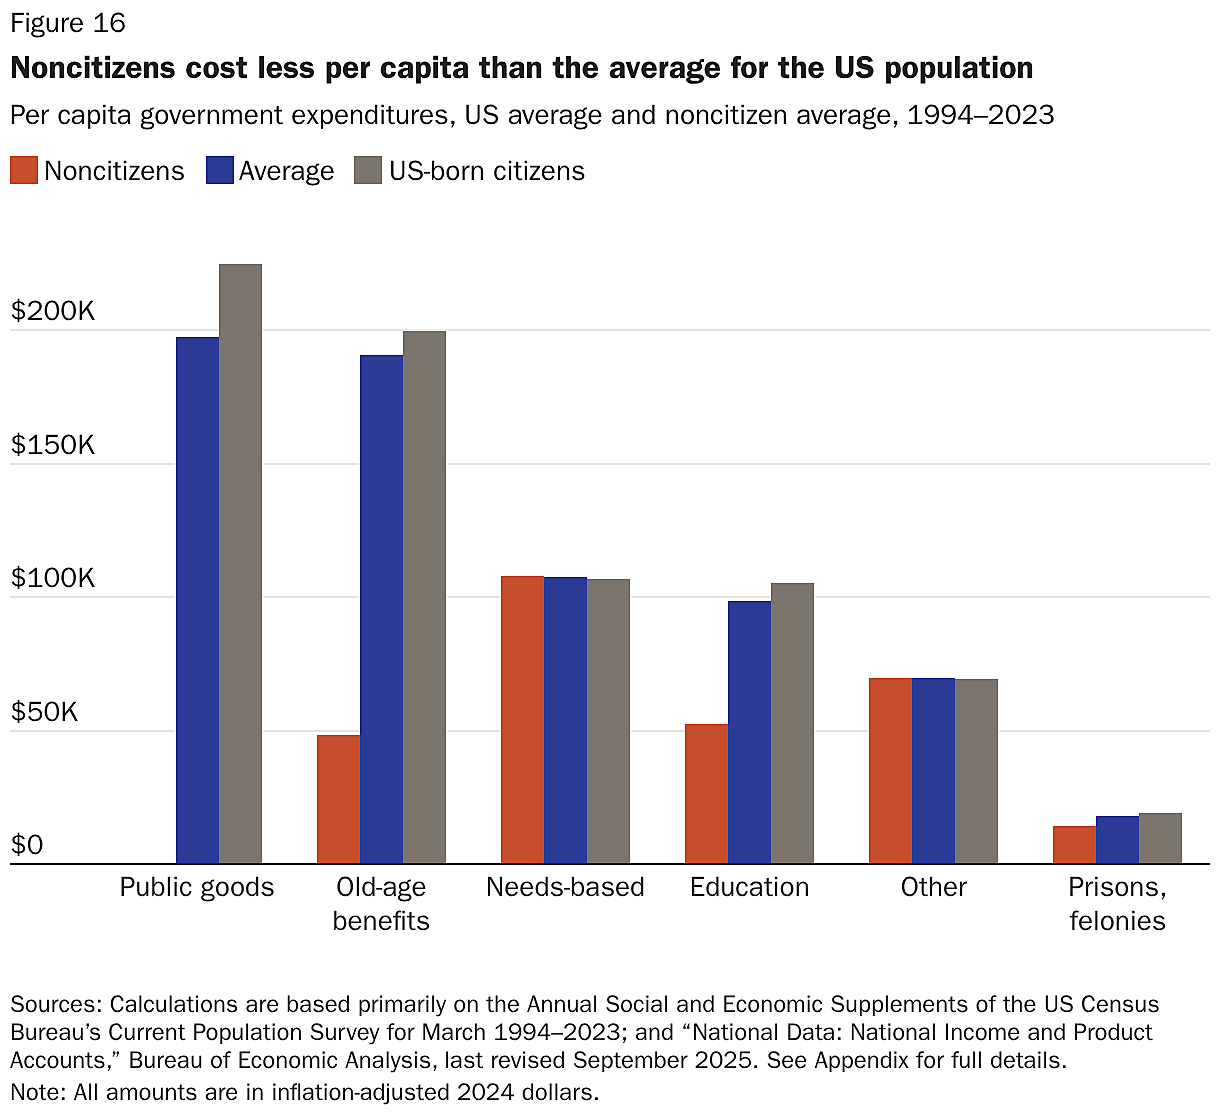
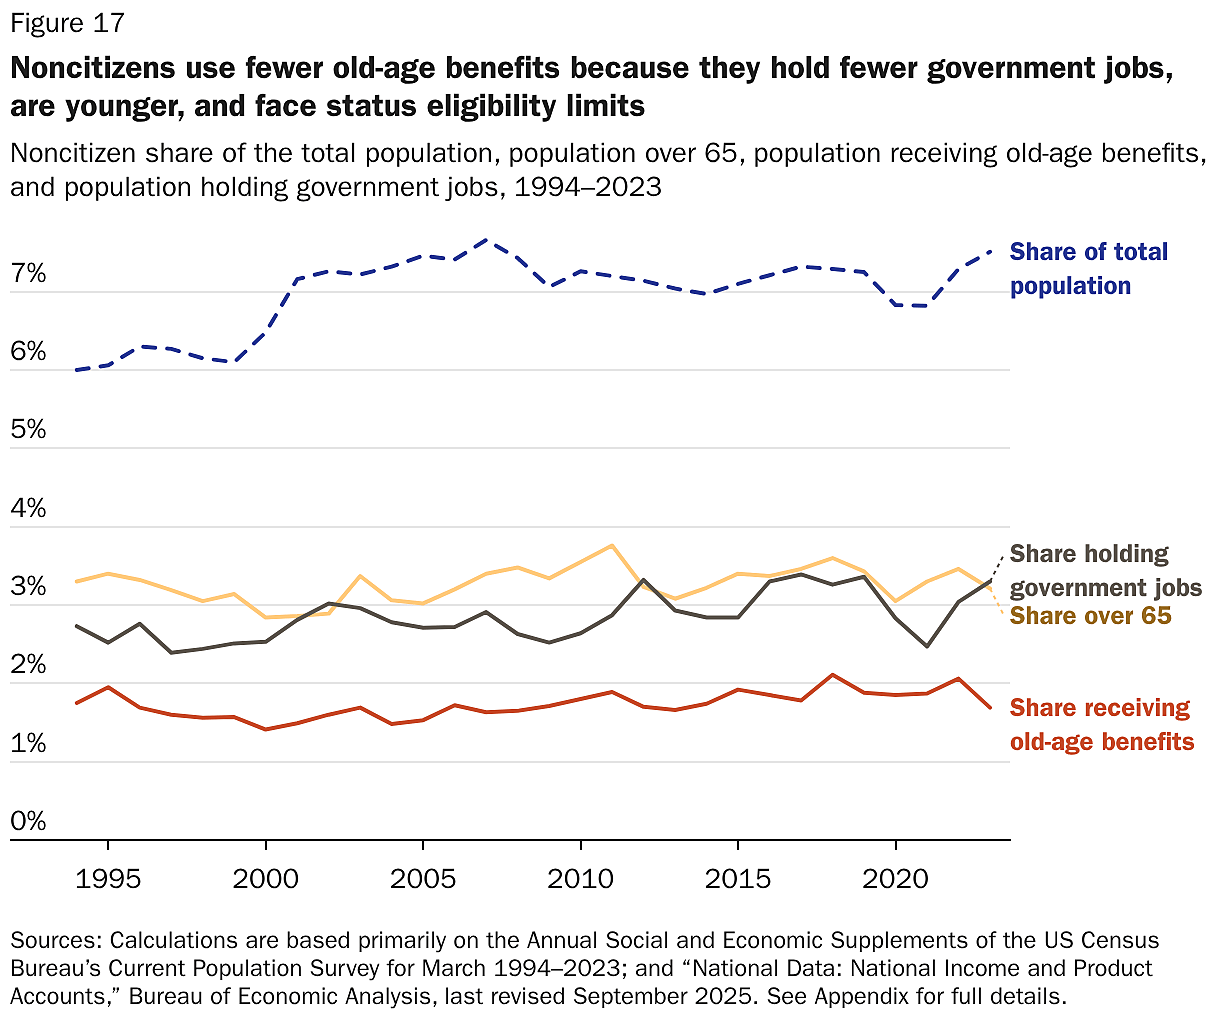
Again, noncitizens added nothing to the cost of pure public goods by definition, reducing the per capita cost of those items (past debt, military, etc.) to the government. Noncitizens also received 75 percent less in old-age benefits than the average US resident; were roughly even with other residents on needs-based programs; used half as many educational resources; and were 21 percent less costly per capita for prisons and felony policing over the 30-year period (Figure 16).
Old-age benefits: Noncitizens were half as likely to be over age 65 throughout this period (Figure 17). But even among the elderly population, noncitizens received below-average government old-age benefits, accounting for just 1.7 percent of spending on those programs (Social Security, Medicare, and government pensions). Therefore, noncitizens’ low receipt of old-age benefits also stems from legal barriers to access for illegal immigrants and others without sufficient US work history.29 Noncitizens were also significantly less likely to work for the US government, making them ineligible for expensive government pensions.
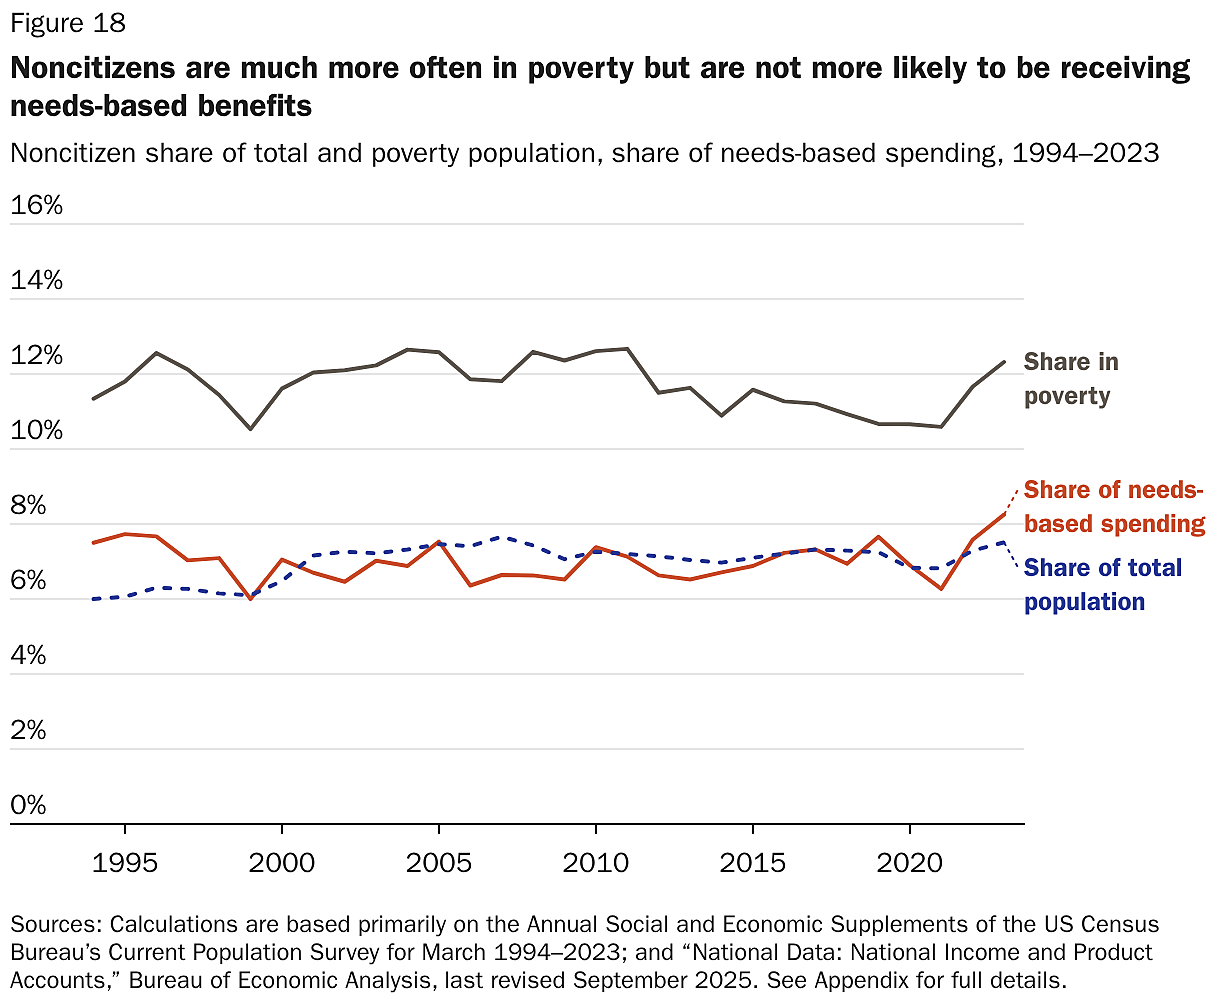
Needs-based: Noncitizens were about 76 percent more likely to be in poverty during this period (Figure 18), and since they were more likely to be of working age, they were more likely to qualify for unemployment insurance and the earned income tax credit. Some noncitizen refugees and asylum seekers were also eligible for special assistance. Nonetheless, noncitizens received only about 7 percent of the needs-based benefits, comparable to their share of the population. Immigration status eligibility restrictions played a large role in preventing noncitizens from using these programs at much higher rates. This effect will grow as a law enacted in July 2025 will impose even stricter limits for noncitizens.30
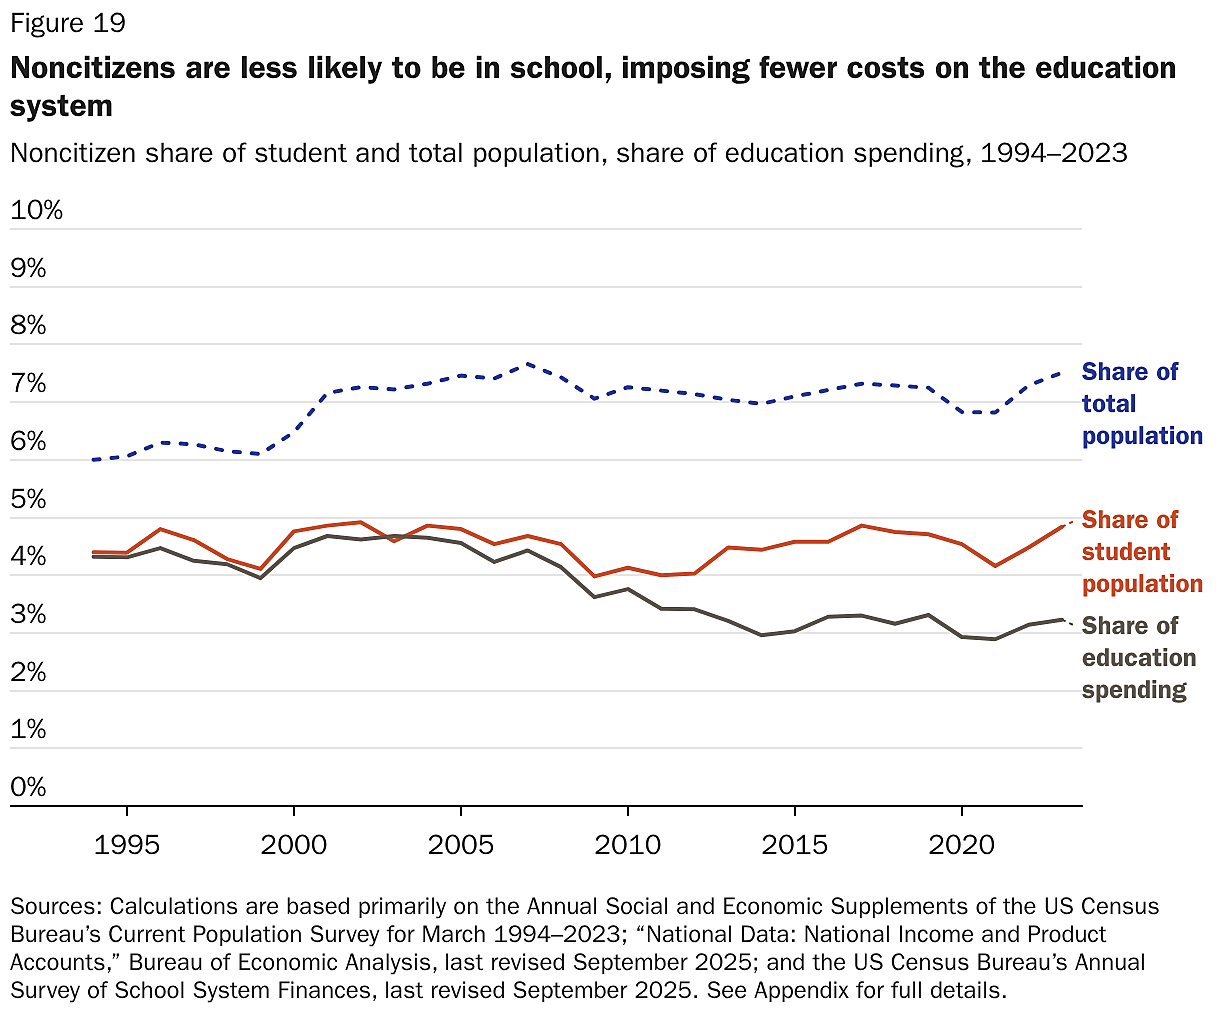
Education: Noncitizens use educational services at half the average rate (Figure 19). Even though noncitizens in K–12 public schools cost more on average because of language services, noncitizens are much less likely to be in school at all, as they usually arrive in the United States after completing their education. Another reason for this gap is that noncitizens in higher education are often ineligible for federal or state tuition subsidies. For instance, most states bar illegal immigrants from receiving tuition subsidies.31 More important, international students compose half of all students in higher education,32 and each international student at public universities subsidizes the cost of enrollment for two other students,33 meaning that the noncitizens cost higher education effectively nothing on net. Overall, illegal or international students accounted for four in five noncitizen university students.
Prisons and policing: Remarkably, given their younger ages, noncitizens were also 20 percent less likely than the average American resident to be incarcerated in prisons, jails, and detention centers, imposing lower costs on policing for serious crimes from 1994 to 2023. However, the overall amount of this spending is small compared to the other categories of spending.
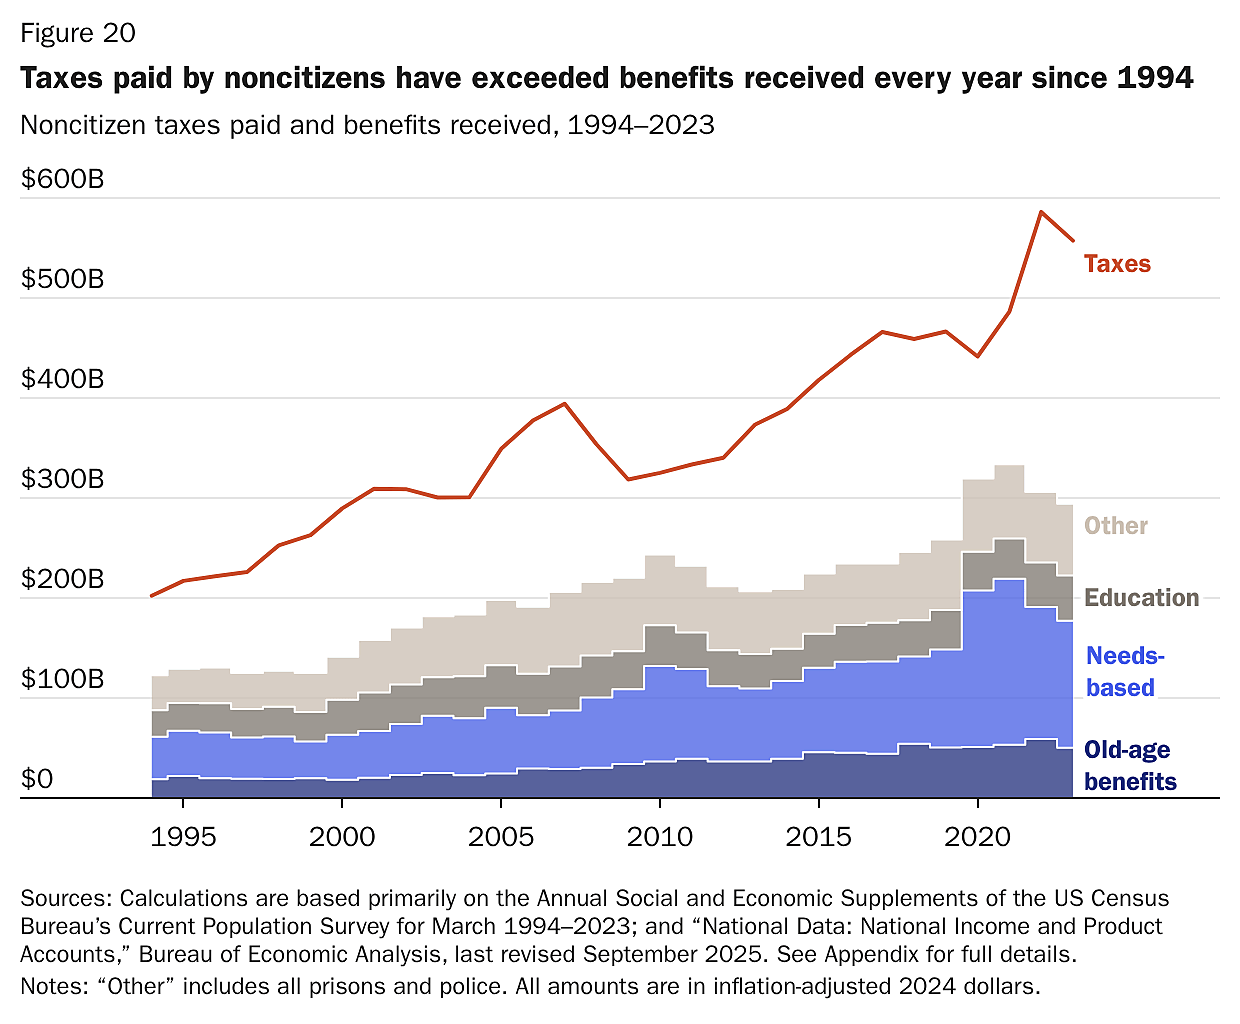
Noncitizens impose the average cost for all other categories of government spending not specifically described above. Therefore, noncitizens were fiscally positive, because they impose far lower costs for major services, primarily education and old-age benefits. Noncitizen taxes have exceeded spending every year since 1994 (Figure 20).
Why Low-Skilled Immigrants Are Fiscally Positive
University graduates had a more positive fiscal effect than those with less education, because university graduates have higher-than-average incomes and thus pay more in taxes. This might lead someone to think that lower-skilled, less educated immigrants have a negative fiscal effect, but in fact, low-skilled immigrants—defined here as immigrants with less than a bachelor’s degree—were fiscally positive from 1994 to 2023. This was also true of low-skilled noncitizens, most of whom were in the United States illegally.34 How is this possible?
At the outset, we note that children raise a methodological difficulty for estimating the effect of low-skilled immigrants, because all children are technically low-skilled. In the Appendix, we discuss alternatives, but our approach below uses a regression that predicts the final education level of individuals below age 25 based on their parents’ educational attainment along with their race and ethnicity.35 This approach assigns a percentage of children of low-skilled immigrants to high-skilled buckets, and some children of high-skilled immigrants to low-skilled classification, based on their percentage likelihood of completing a given level of education in the future.
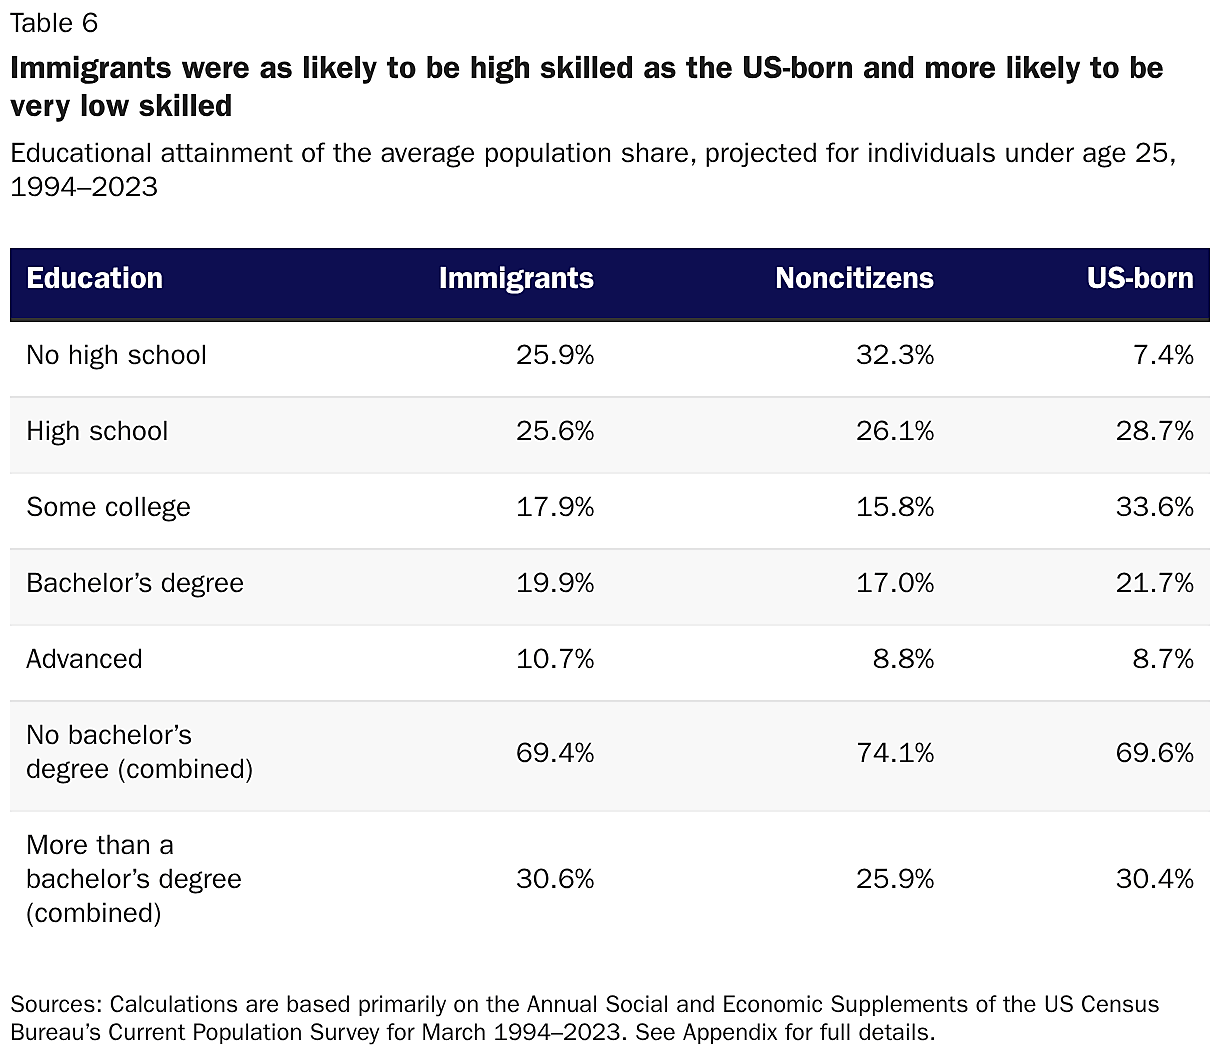
Table 6 shows our estimates of the average educational attainment for immigrant, noncitizen, and US-born populations from 1994 to 2023. Although many people think of immigrants as synonymous with low-skilled workers, there are proportionately as many highly educated immigrants as skilled US-born individuals over our sample period. At the same time, immigrants were four times more likely than US-born individuals to have dropped out of high school and half as likely to have attended some college without receiving a bachelor’s degree.
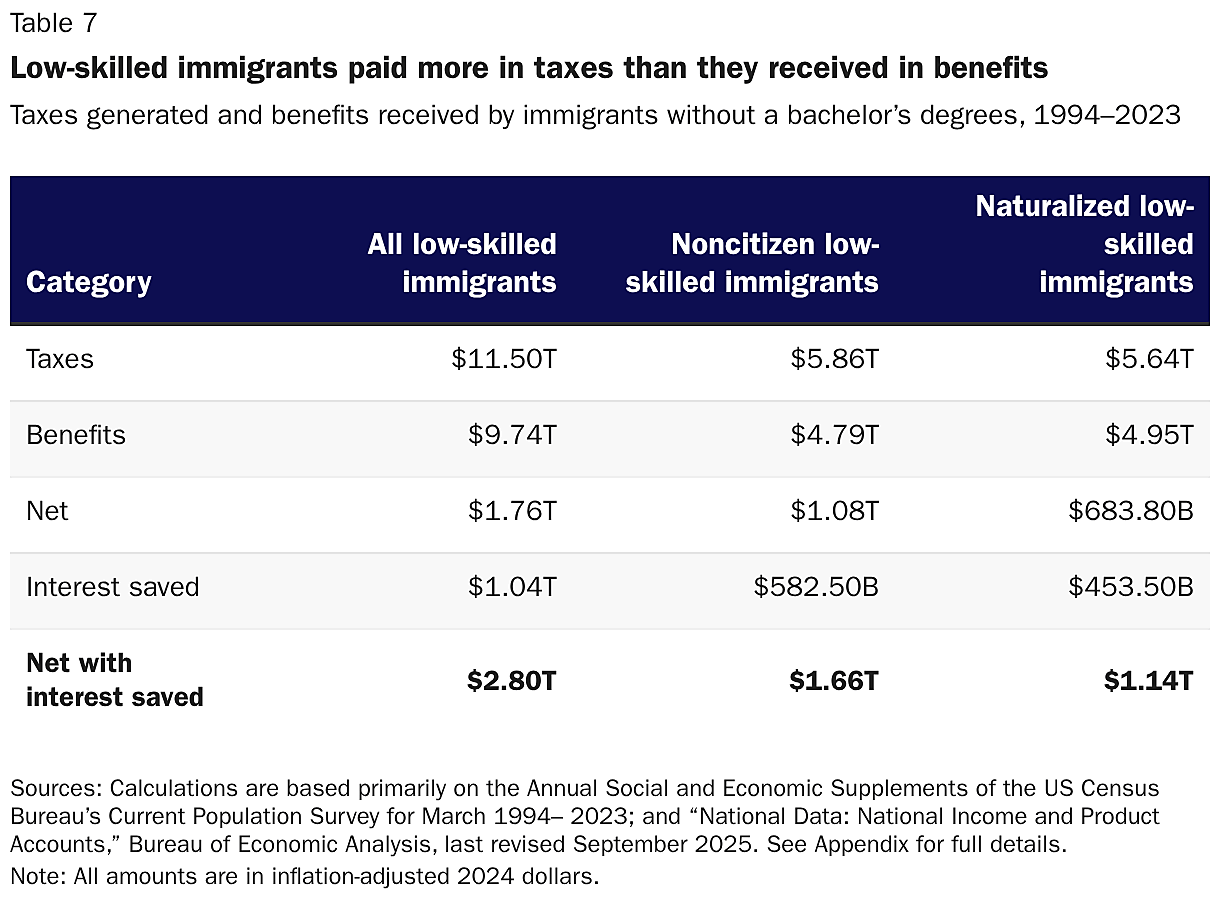
Thus, lower-educated immigrants made up over two-thirds of the immigrant population from 1994 to 2023. Perhaps it is not surprising then—given that it is true for the immigrant population overall—that, as Table 7 shows, lower-educated immigrants also produced more tax revenue than government costs during that period. Low-skilled immigrants paid $11.5 trillion in federal, state, and local taxes, and about half of this was from low-skilled noncitizens. Low-skilled immigrants received an overall $9.7 trillion in benefits, for a net-positive effect of $2.8 trillion after interest savings. Collectively, low-skilled noncitizens paid more taxes and received fewer benefits than other low-skilled immigrants.
In real terms, the average low-skilled immigrant generated about half a million dollars in taxes from 1994 to 2023. Contrary to a common misconception, low-skilled immigrants do pay income taxes, for several reasons. First, “low-skilled” here refers to educational attainment, not income. Some people who end schooling early still become high earners.36 Second, even many employers of low-skilled illegal immigrants withhold taxes from workers’ paychecks, either because the employers want to reduce legal liability from employing them, because the immigrant is borrowing the identity of a legal worker, or because the illegal worker has obtained temporary work authorization.37 Finally, net income tax payments could still be negative after refundable tax credits, because we list them as benefits in order to better assign those costs to individuals other than the tax filer. In any case, income taxes account for less than a quarter of low-skilled immigrants’ revenue generation.
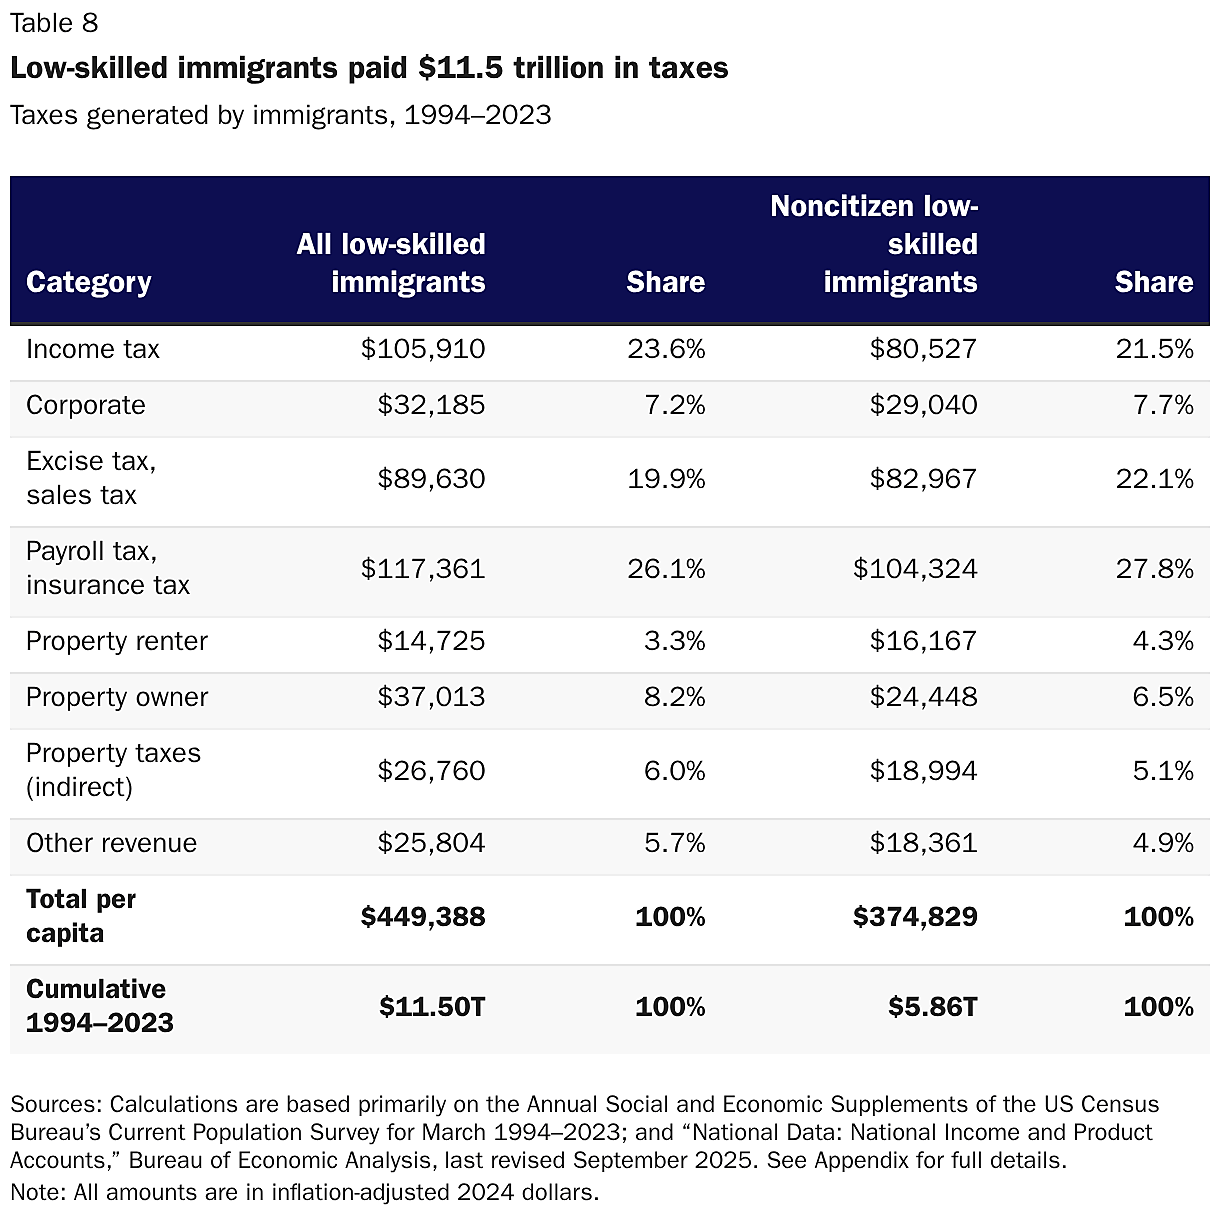
In fact, given how taxes are paid, the immigrants themselves would likely not recognize their own contributions. Indeed, payroll taxes, not income taxes, are the largest category of taxes for low-skilled workers; half of payroll taxes are paid by employers on behalf of the worker without any acknowledgment on pay stubs.38 Similarly, landlords usually pay property taxes on behalf of renters, generally with no specific line item in the rent. Nonetheless, these taxes would not be paid without tenants and workers.39 Even more concealed are taxes paid on corporate profits generated by immigrant workers.40 All told, low-skilled immigrants are probably unaware of the majority of the tax revenue they generate (Table 8).
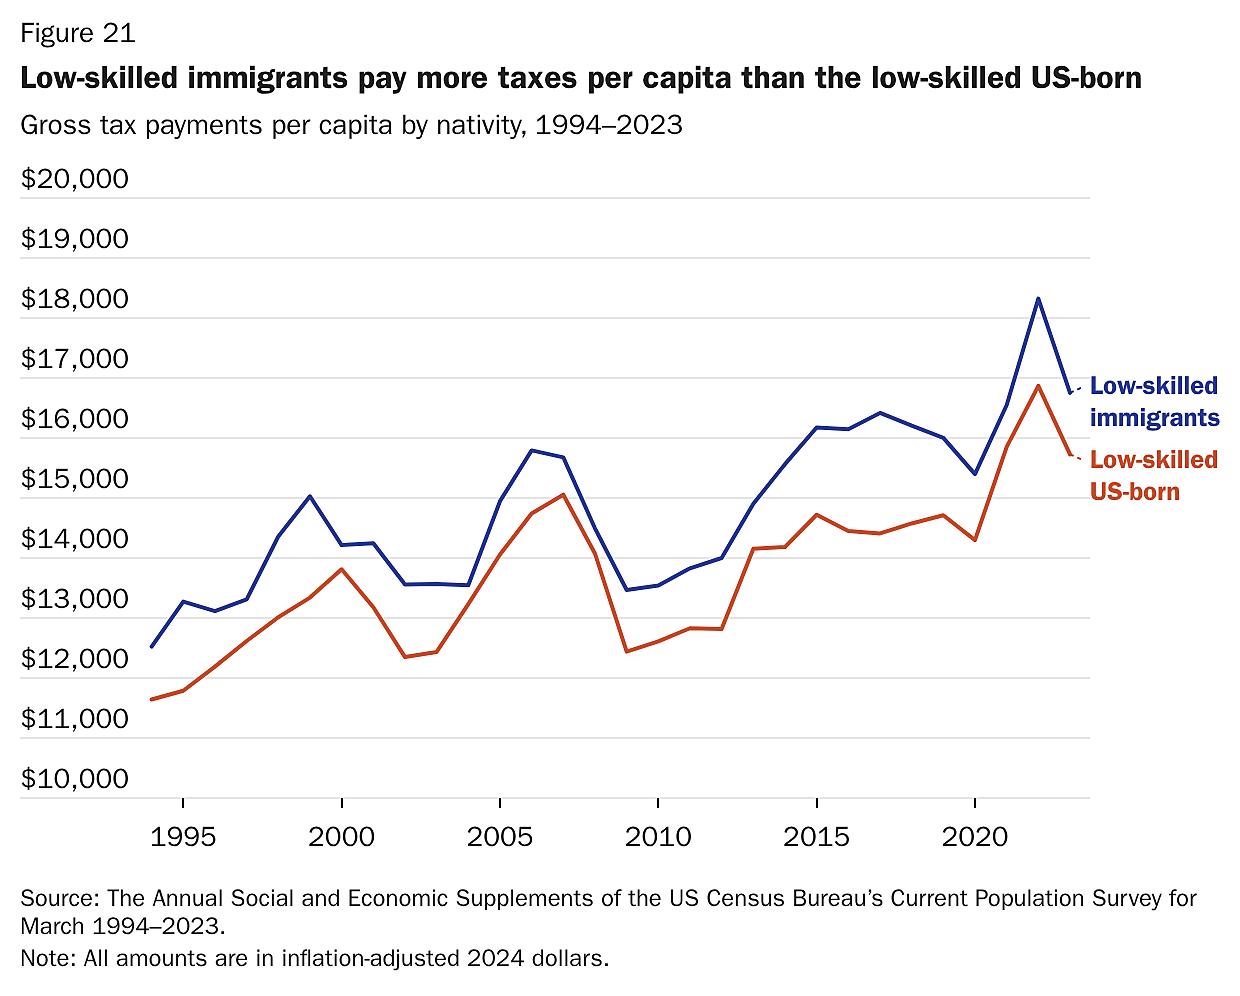
Low-skilled immigrants’ tax payments are less surprising when compared with their share of total earned income. From 1994 to 2023, low-skilled immigrants accounted for about 6.7 percent of tax revenue and 6.2 percent of earned income. Their share of tax receipts was below their share of the population (6.7 percent versus 8.5 percent), but not as far below as expected based on their educational attainment. Indeed, their tax receipts per capita were much higher than comparably educated US-born people (Figure 21), because low-skilled immigrants were more likely to work (Figure 22). Put simply, the reason low-skilled immigrants create tax revenue is that they work, which generates income that is taxed.

Yet since low-skilled immigrants earn below-average incomes, the other side of the fiscal ledger is even more important. Low-skilled immigrants and noncitizens were fiscally positive because they were much less costly to government than the average person in the United States (Figure 23). Although low-skilled immigrants were slightly more costly than average for needs-based programs, they cost the US government nothing additional in pure public goods, and like noncitizens and immigrants generally, they cost much less for old-age benefits, education, and prisons.

Old-age benefits: Low-skilled immigrants in the United States received 34 percent fewer old-age benefits than the average person (Figure 24). This was not because of immigrants’ age; low-skilled immigrants were more likely than the average person to be over age 65. Instead, the average elderly low-skilled immigrant simply received fewer benefits than the average elderly person. This was primarily because many low-skilled immigrants were ineligible for benefits because they were in the country illegally or, less frequently, lacked the necessary work history. It was also because they were much less likely to work for the government and receive public pensions.
Needs-based: Low-skilled immigrants received needs-based benefits at higher rates than the average person in the United States, but they used those benefits much less than their share of the population in poverty would predict (Figure 25). Low-skilled immigrants relied on needs-based benefits much less than the US-born for at least one of three reasons:
- They were less aware of their eligibility;
- If they were eligible, they feared potential negative immigration consequences; or
- They were barred from applying because of their immigration status.41
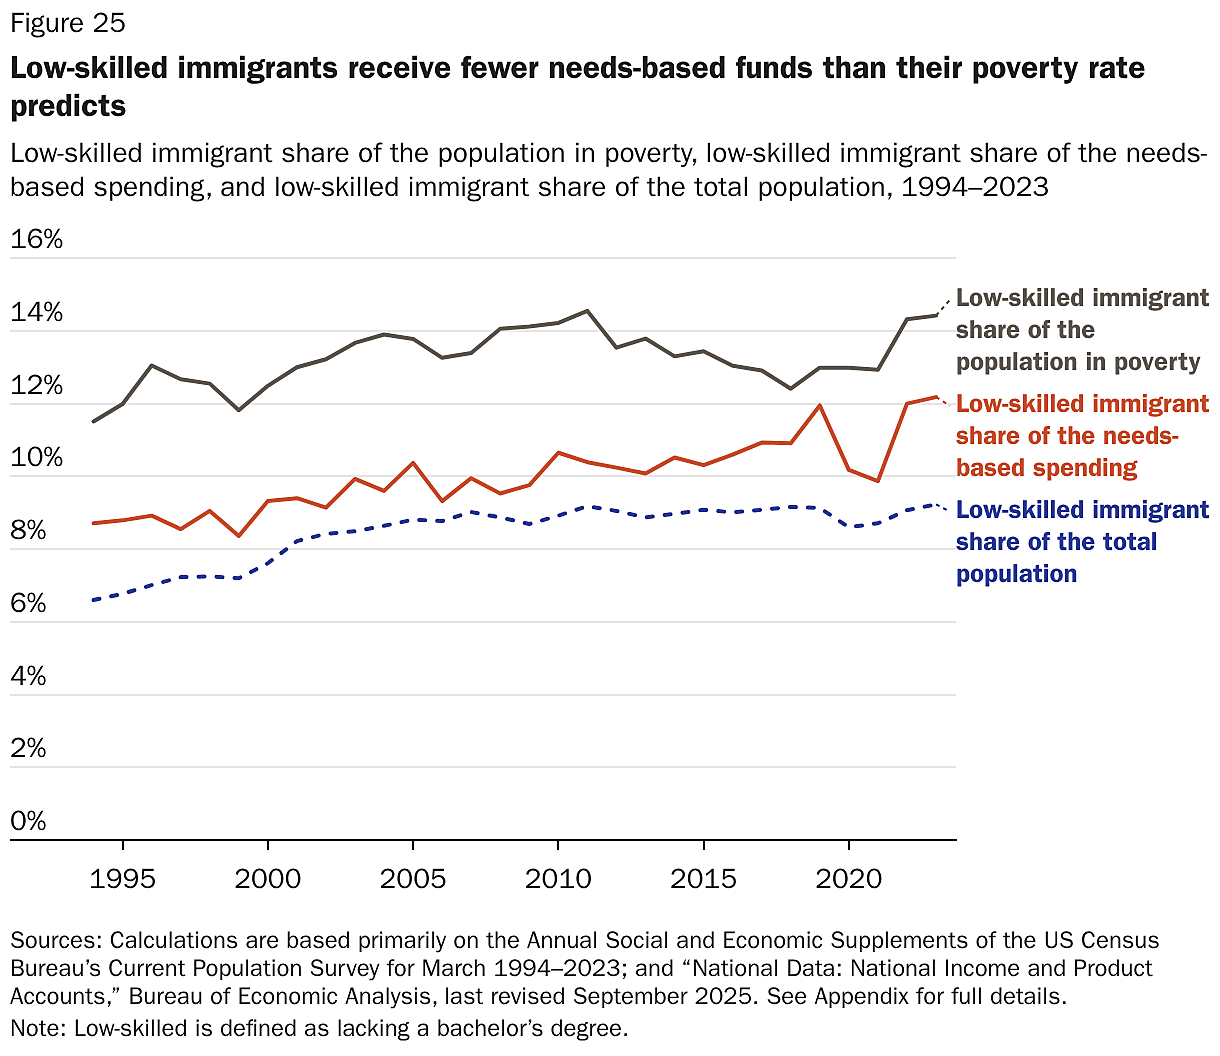
The result is that, although low-skilled immigrants were somewhat more costly to needs-based programs specifically, they were not so costly as to render their overall net fiscal effect negative. Indeed, even if needs-based programs used the average rate for the poor population over the last 30 years, adding about $1 trillion in costs, the US government would still have come out ahead from low-skilled immigrants’ presence in the United States. Moreover, US policy under the One Big Beautiful Bill further limits needs-based benefits to noncitizens in the future.42
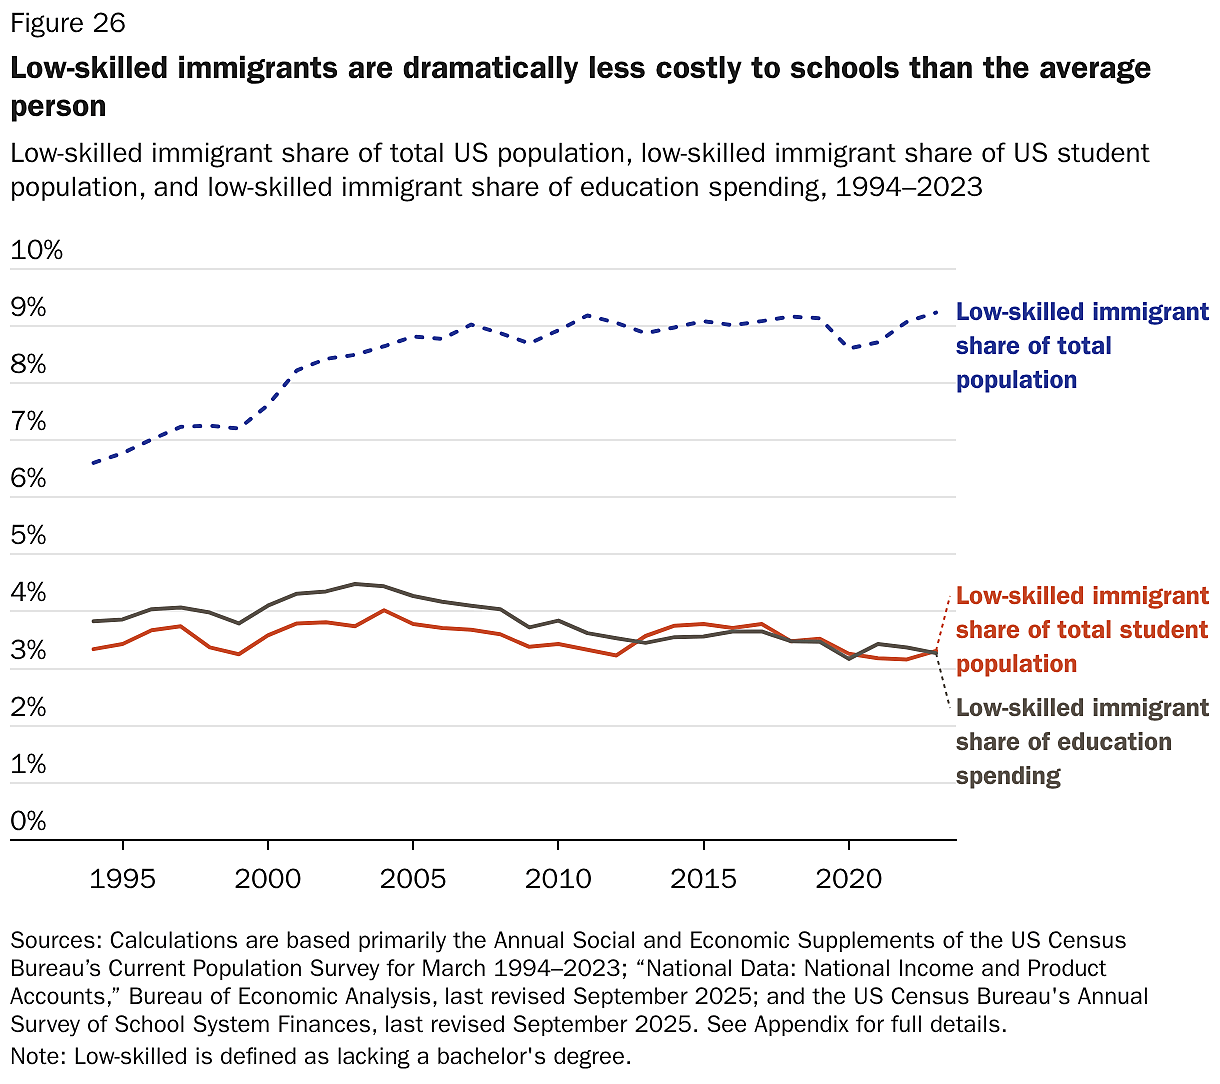
Education: Low-skilled immigrants cost the educational system 55 percent less than the average US-born person from 1994 to 2023 (Figure 26). Again, immigrants’ special language needs lead to higher costs when those individuals are in K–12 schools. But because most immigrants arrive after their education is already complete, they were much less likely to be in school than the average US-born person. Moreover, low-skilled immigrants mostly did not receive any higher education, meaning they were not receiving any tuition subsidies. To avoid misattributing any costs in this analysis, all of these figures include the costs from immigrants who were still in school and who we project to end up low-skilled based on their parents’ educational attainment and race or ethnicity.
Prisons and felony policing: Despite the fact that tens of thousands of low-skilled immigrants were detained for immigration offenses that US-born Americans cannot commit, they were about half as likely as the average US-born person to be incarcerated from 1994 to 2023.43 This means that they also triggered much less spending on felony policing and courts.
Thus, the fiscal effect of low-skilled immigrants was positive from 1994 to 2023 because they triggered less spending from the government (Figure 27). Although they had lower per capita incomes, their incomes were higher than predicted based on their education because they worked at higher rates. At the same time, although they received above-average needs-based assistance, it was below average for similarly skilled people, and the amount was dwarfed by how much less low-skilled immigrants cost in old-age benefits and educational services. Only during the first two years of the COVID-19 pandemic (2020 and 2021), when Congress increased benefits, were low-skilled immigrants in general fiscally negative.
The Lowest-Educated Immigrants Can Be Fiscally Beneficial
From 1994 to 2023, tax revenues exceeded benefits for low-skilled immigrants of all levels of education throughout their working years (Figure 28). Given that more than two-thirds of the low-skilled immigrant population fell into this demographic group in each year during that time (Figure 29), it is not surprising that they were, as a group, fiscally positive. Even immigrant high school dropouts’ taxes exceeded benefits during their prime working years.
However, when including the elderly and young, immigrants who failed to complete high school did pay less in taxes than they received in benefits throughout the period collectively. Outside of the pandemic—when tax revenues anomalously fell and government benefits surged—this deficit can be entirely attributed to old-age benefits (Figure 30). Again, prime-age high school dropout immigrants generated more taxes than costs throughout the period in question. Moreover, in most individual years, taxes were greater than benefits for high school dropout noncitizens, to the point where the net effect is effectively zero for that group (Figure 31). Noncitizen high school dropouts were slightly fiscally negative for the entire period, but only because of the pandemic years.
This negative cash flow does not mean that the US fiscal situation overall would have improved if high school dropout immigrants had never immigrated. For one thing, a person’s economic contributions could increase the productivity of other US-born workers sufficiently to make up for their individual deficit. In essence, these immigrants act as extensions of US-born workers, making the latter more productive and growing the economy. The economic literature provides substantial evidence for this effect,44 but the NASEM–Cato accounting model cannot capture it. More important, a person can be fiscally negative (taxes minus benefits) yet fiscally beneficial if their economic contributions are high enough to reduce the burden of debt relative to GDP.
The burdensomeness of debt depends on the size of the economy. Think of it this way: When Greece had its debt crisis in 2009, its debt-to-GDP ratio was nearly 2:1.45 Germany had six times as much debt at that time, but it experienced no crisis because its debt was only about 75 percent of its GDP. To put it another way, imagine if the US population suddenly doubled, and the new population had all the same economic characteristics, which would result in GDP doubling. America’s debt-to-GDP ratio would drop by half, which would be beneficial—even if the newcomers’ fiscal flow going forward was negative.
In fact, immigrant high school dropouts as a group were fiscally beneficial to the United States because they were less costly relative to their economic contribution than the US-born population without immigrants. In this analysis, we use total earned income to estimate the effect of a person on GDP.46 The fiscal deficit for immigrant high school dropouts averaged about 5.6 percent of their contribution to GDP, compared to 7.9 percent for the US-born, from 1994 to 2023. High school graduate immigrants usually paid more taxes than they received in benefits, except during the COVID-19 pandemic—but even then, they lowered the debt-to-GDP ratio relative to the US-born (Figure 32).
Table 9 lists the net fiscal effect for each education-level combination, as well as their effect relative to GDP. Compared to the US-born population, immigrants of every level of education reduced the debt-to-GDP ratio from 1994 to 2023. (See Appendix Table A5 for a breakdown by citizenship status.) This was also true for 2022–2023, as seen in Appendix Table A6. Again, these are lower-bound estimates because we know that low-skilled immigrants increase the productivity of US workers, creating more economic growth and tax revenues than can be captured in our static accounting model.47
Why Illegal Immigrants Were Fiscally Positive
The Current Population Survey data on which this report is primarily based do not specifically record whether someone has a legal status in the United States, and the survey’s sample of noncitizens is not sufficient to reliably estimate the number of illegal immigrants indirectly.48 However, given that even low-skilled noncitizens are fiscally beneficial, illegal immigrants likely are as well. Nonetheless, to provide a more specific estimate, we can use illegal immigrant eligibility for benefits and apply outside estimates of the illegal immigrant population’s education, income, and assumed tax compliance to piece together a directionally accurate, if imprecise, calculation of their fiscal effects from 1994 to 2023.
Many illegal immigrants—employed under borrowed or stolen identities—have taxes withheld by employers and then are less likely to file returns to claim their refunds. The Appendix provides a more detailed explanation, but after accounting for their lower income and lower tax compliance, the available data indicate that illegal immigrants pay individual income and payroll taxes at about 67 percent of the average rate of compliance, either through withholding or filing tax returns. They also directly or indirectly pay property taxes, corporate taxes, sales taxes, excise taxes, and many state fines and fees.
Illegal immigrants were generally ineligible for government benefits, with the following exceptions: school lunch; Special Supplemental Nutrition Program for Women, Infants, and Children (WIC); workers’ compensation; public K–12 education; the Earned Income Tax Credit (before 1996); the Child Tax Credit (before 2017); local shelter services (in 2023); emergency Medicaid; and regular Medicaid (in a few states, but only recently and with narrower eligibility). It is likely that illegal immigrants are less likely to apply for benefits for which they qualify, but for our estimate, we assume the same per capita use as noncitizens with the same level of education.49 All of these state and federal eligibility restrictions are strictly enforced, but to account for fraud and unusual situations in which a noncitizen can lack status but temporarily be deemed “lawfully present” for purposes of benefits (such as while applications are pending), we assign illegal immigrants 5 percent of the relevant noncitizen level for all ineligible benefit programs.
Table 10 shows the upshot of this exercise: Illegal noncitizens were only somewhat less fiscally positive per capita than noncitizens generally, and they likely reduced the deficit by at least $1.7 trillion from 1994 to 2023. Illegal immigrants of all educational attainments are also likely to have paid more in taxes than they received in government benefits. Although we adopt simple assumptions, it is difficult to arrive at a conclusion significantly different from the one below. Even if illegal immigrants used benefits at the exact same rate as all noncitizens, they would still be, on average, fiscally beneficial to the United States—both by reducing the debt in real terms and by lowering debt-to-GDP.
Why Immigrants Are Fiscally Positive in the Long Term
Immigrants, noncitizens, low-skilled immigrants, and illegal immigrants were fiscally beneficial overall from 1994 to 2023. By itself, this is a significant finding, because it implies that the United States’ debt to this point is less than it would have been without those immigrants. However, it raises questions about how to understand the big picture. Did our results arise because new immigrants were constantly entering at working ages, thereby increasing revenues? Or were the immigrants who entered 30 years ago also fiscally positive on their own for the last three decades? Fortunately, we have the data to answer these questions.
The Current Population Survey first started recording citizenship status and birthplace in 1994. Therefore, the first group of immigrants we can continuously follow from 1994 to 2023 entered the US from 1990 to 1993. We cannot isolate only 1993 or 1994 because of how the survey codes immigrant arrival years into groups, but regardless, the multiyear period provides a better sample size. This 1990–1993 cohort, which was fiscally positive overall by $1.7 trillion from 1994 to 2023, reinforces the conclusions of this report’s prior sections. The noncitizens were positive $704 billion, and the low-skilled immigrants and low-skilled noncitizens were positive $441 billion and $248 billion, respectively (Table 11).
Immigrants who entered from 1990 to 1993 generated $2.4 trillion in taxes, and they were fiscally net positive nearly $1.3 trillion, growing to $1.7 trillion with interest savings. Low-skilled immigrants paid $1.2 trillion in taxes and were net positive $441 billion. Figures 33 and 34 show the fiscal flows over time. As the graphs show, the 1990–1993 cohort was initially barely fiscally positive. At the state and local level, the cohort even began fiscally negative. But as education costs dwindled and more members of the cohort entered the labor force, the fiscal surplus surged, and taxes have remained far above expenses ever since. Obviously, at some point as they age out of the workforce, these immigrants will begin consuming more in government services than they pay in taxes, but by then they will have collectively generated a large fiscal surplus of trillions of dollars for the US government. Those fiscal savings will continue to save the government money far into the future by reducing interest payments on the debt even after the annual fiscal flow turns negative.
Immigrants who entered the US from 1990 to 1993 lowered debt across all levels of educational attainment (Table 12). Immigrants also considerably lowered the debt-to-GDP ratio relative to the US-born population. Even low-skilled immigrants in this cohort, who were roughly fiscal-flow neutral, substantially lowered the debt-to-GDP ratio relative to the US-born population during this period. Immigrants with higher education generated enormously positive fiscal flows over 30 years, peaking at $1.4 million per capita for individuals with advanced degrees.
The Children of Immigrants Will Be Fiscally Positive
The primary purpose of this report is to estimate the effects of immigrants themselves. The US-born children of immigrants are natural-born citizens, and whatever welfare or benefit rules that exist for other citizens must apply to them. Moreover, there is no methodological reason to stop the fiscal analysis with US-born children rather than grandchildren or great-grandchildren. The most logical division for analysis is between the US-born and immigrants. From a technical standpoint, in the Current Population Survey, we cannot extend our analysis to match second-generation adults with specific first-generation parents to compare the long-term effects of immigrant subpopulations along with their children.
Nonetheless, we can combine the second generation as a whole with the first generation to analyze whether the fiscal benefits of immigrants reverse when including the second generation. Our data currently show the second generation was indeed fiscally negative. However, this deficit stems from the fact that two-thirds were born between 1994 and 2023, which means that relatively few had entered the labor force and started to pay taxes by 2023, though enough had entered that it would seriously bias the calculation to exclude their tax contributions, as some analyses do.50 Even with these costs attributed to “immigrants,” immigration was still fiscally positive $7.9 trillion from 1994 to 2023 (Table 13).51
Immigrants and their children were fiscally positive every year from 1994 to 2023 (Figure 35). They generated nearly $35 trillion in taxes and created a net revenue surplus of nearly $6 trillion, reducing deficits by $7.9 trillion with interest savings.
In the future, the second generation will be the most fiscally positive generation. Figure 36 compares immigrants, US-born children of immigrants, and US-born without immigrant parents (third-plus generations) in terms of net fiscal effect by age (taxes minus benefits) from 2018 to 2023. The second generation’s peak is nearly double that of the US-born population without immigrant parents, and they maintain that advantage for longer. Their median age is only 19, compared to the average age of 37 for the third-plus generation group and 45 for immigrants. This figure excludes pure public goods from the costs for the US-born, to make a comparison based only on benefits received. The second generation is also less costly per capita in childhood and retirement than the US-born without immigrant parents.
The reason the second generation has such a large net-positive fiscal effect during their prime working years is primarily that their incomes are higher than the first generation or third-plus generation, resulting in the second generation paying more in taxes. The main reason for this is that the children of immigrants are more educated than immigrants and other Americans. They are nearly as likely to graduate from high school as the US-born, but about 7 percentage points more likely to graduate college (Figure 37). As the rest of the second generation ages into adulthood, they will become the most potent fiscal engine this country has ever seen, and over the next half century, the children of immigrants will also help mitigate a fiscal catastrophe.
How Immigration Has Prevented a Debt Crisis
Immigrant taxes exceeded the cost of immigrant expenditures, such that removing immigrants would have increased US debt. But as noted earlier, removing the US immigrant population would not only deprive the government of tax revenue, it would also deprive the country of workers and shrink the US economy. This is not a trivial matter. Immigrants’ share of total earned income grew from 8 percent to 17 percent from 1994 to 2023. Moreover, immigrants’ contribution to the economy is disproportionate to their share of the population, meaning that losing them would shrink the economy even more than losing a random group of Americans. GDP would shrink drastically without immigrants—by at least $4.8 trillion in 2023—so the negative effect on government finances from fewer immigrants is manifested in more debt and a much smaller economy.
Figure 38 shows the trajectory of US debt with and without immigrants as a percentage of GDP from 1994 to 2023.52 By 2023, US debt at all levels would have been approximately 205 percent of GDP—75 percentage points higher without immigrants. This estimate is based on immigrants’ share of total earned income as a proxy for the share of GDP that immigrants create, so it understates the true effect by ignoring the indirect ways in which immigrants make US-born workers more productive, such as through increased investment, entrepreneurship, and skill complementarities. It also ignores how much higher interest rates would have been at such higher levels of debt.53
Debt at 200 percent of GDP could trigger very negative fiscal and economic consequences. Some analysts believe that, at this threshold, the United States will face a debt crisis. Researchers at the Penn Wharton Budget Model reported in 2023 that “the US [federal] debt held by the public cannot exceed about 200 percent of GDP” without default, monetization (inflation), or economic catastrophe.54 Figure 38 depicts estimated total government debt without the positive fiscal effect of immigrants; though it includes some state and local debt, 91 percent of public debt is federal public debt. In other words, immigrants might have already prevented a debt crisis in the United States. Other analysts are less sure of whether 200 percent—or another threshold—would mean a crisis at that scale without other changes.55 Regardless, there is a broad consensus that debt rising so far above GDP would have serious negative effects on economic growth and fiscal health.56
Conclusion
Immigrants contribute to the United States’ economy in many ways. Their primary contribution is the goods and services they directly produce. However, they also reduce the burden of government spending for the US-born population. Our analysis in this paper shows that immigrants generated a fiscal surplus of about $14.5 trillion from 1994 to 2023, that the average immigrant is much less costly than the average US-born American, and that immigrants impose lower costs per person on old-age benefit, education, and public safety programs. Even immigrants without higher education produced a fiscal surplus, and even the lowest-skilled group, with a net-negative fiscal flow, reduced the US debt-to-GDP ratio.
Our major conclusions are robust; they would reverse only with a monumental shift in costs from the US-born to immigrants. For instance, only after increasing spending on immigrants by 51 percent (nearly $4.9 trillion) does even the low-skilled immigrant population become more burdensome relative to GDP than the US-born. However, we believe our conclusions are too closely tied to well-established facts for such a large shift to be possible. We show that the average US person pays more in taxes than they receive in benefits (spending on items that are not pure public goods that do not scale with the population). Thus, as long as immigrants are at least average in their net fiscal payments, they will be fiscally positive.
Our report uses the best government data available to find that immigrants provide a net fiscal benefit, generating more than the average in taxes and using below the average US resident in benefits. We show that immigrants’ higher-than-average tax contributions track what we know about their income, which stems from high employment rates. Their lower per capita cost for education is the undeniable result of their being much less likely to be in school. This means that the United States is getting the economic benefits of immigrant workers without many of the costs that come with training new US-born workers. Combined with the fact that immigrants face more legal and practical barriers to using transfer benefits such as Social Security, Medicare, Medicaid, and means-tested income, food, and shelter assistance, the result—that immigrants provide a net fiscal benefit to the US economy—is virtually guaranteed.
Although the future need not replicate the past, the massive fiscal boon that immigrants have brought to the United States over the last three decades puts the immigrant population far ahead in any forward-looking analysis. Our analysis shows that the cohort of immigrants who entered the country 30 years ago was still strongly fiscally positive in 2023, and their fiscal savings from the past mean that the government will continue to save money on interest payments on the debt, even after their annual fiscal flow turns negative. Moreover, Cato Institute research has previously produced forward-looking estimates of the fiscal effects of immigrants that are largely compatible with our conclusions here.57 Finally, we show that the second generation appears poised to create the biggest windfall from this wave of immigration. Indeed, immigrants appear to have already staved off a dire fiscal crisis, at least for now. Rather than treating them as the cause of America’s fiscal struggles, we should consider immigrants part of the solution.
Appendix
Methodology and Data
This report broadly follows the National Academies of Sciences, Engineering, and Medicine (NASEM) methodology on the fiscal effects of immigration.58 The NASEM–Cato model assigns all federal, state, and local government tax revenues and government spending to the individual level to construct net fiscal impact profiles by age, educational attainment, and citizenship. We analyze the 30-year period from 1994 to 2023 and use three-year averages to avoid sampling-size problems for the subpopulations that we want to analyze.
General Considerations
Distribution of spending and revenue: Our primary source for the distribution of spending and revenue between immigrants and the US-born population is the Census Bureau’s Annual Social and Economic Supplement (ASEC) to the Current Population Survey (CPS) of households, which is conducted annually in March.59 The ASEC has recorded each respondent’s use of major public benefits programs, their school enrollment, educational degrees, income, and other relevant variables by citizenship status and by their parents’ birthplaces since 1994. For details on the institutionalized population, such as those in prisons and nursing homes, we use the Census Bureau’s American Community Survey (ACS), from its initiation in 2006 and decennial censuses for 1990 and 2000, with interpolation for other years.60 The ACS does not record adults’ parents’ birthplace, so the institutionalization assumption is the same for both second- and third-generation Americans.
Source for aggregate spending and revenue: The ASEC and ACS are only used for the distribution of taxes and spending. To avoid underestimating or overestimating costs, we scale the spending attributed in the ASEC to match the actual spending and tax amounts reported by the government.61 We use three primary sources: the Bureau of Economic Analysis (BEA) National Income and Product Accounts (NIPA) for overall current expenditures and current receipts (revenue); the Office of Management and Budget historical tables for aggregates for certain subcategories; and health insurance data from the Centers for Medicare and Medicaid services.62
Total population: CPS population reports for our sample from 1994 to 2023 are adjusted to the mid-year total resident population using the Census Bureau’s Annual Estimates of the Resident Population for the United States.63 Those data are published between each census and only cover the intercensal period. When estimates overlap in 2000 and 2010, the most recent estimate is used. Data for the 1994–2000 estimates are the mid-year population estimates from the 1990s national tables. In 2025, the Census Bureau updated its weights to account for an undercount in the US population, which was the result of immigration.64 However, it did not alter its past weights for 2023. We do not believe the new weights would substantially change our results.
Immigrant classification: We classify individuals as “immigrants” if they were born abroad and neither parent was a US citizen. “US-born” includes all US citizens by birth, including those born abroad, as well as the children of immigrants born in the United States. US-born persons with two foreign-born parents are classified as second-generation immigrants, and individuals with one foreign-born parent and one US-born parent are randomly allocated between the second- and third-plus generations with equal probability. US-born individuals with two US-born parents are classified as third-plus generation Americans.
Individual as the unit of analysis: The unit of measurement for the NASEM–Cato model is the individual, not households.65 Our purpose is to determine which specific person triggers the increase in spending, not who indirectly benefits from the spending. Households change through births, deaths, divorces, the departure of children, new family members arriving possibly from abroad, job losses, and other reasons, and our focusing on individuals also removes the complication of multigenerational households, in which some members are immigrants and others are native born.66 This method is the most consistent methodological choice in fiscal effects analysis.67 In its 2018 public charge rule, the Department of Homeland Security also estimated potential public benefits use on the individual level, not on the household level.68
Household spending: For spending normally distributed to households, the NASEM credited each person in the household with an equal share of the costs, but this methodology fails to account for mixed-status households. For rent, energy, and food spending, a household receives a lower dollar value when the household includes ineligible noncitizens.69 In those cases, we distribute household spending only among eligible household recipients.70 Although these expenditures may indirectly benefit ineligible recipients, crediting the spending to them may create the inaccurate perception that deporting them would eliminate this spending when, in fact, the other household members would continue to receive the full benefit amount. Our adjusted result for food assistance is similar to the results for the US Department of Agriculture surveys of immigrant and noncitizen food assistance use.71
Child spending: Likewise, our model assigns all spending on children to child beneficiaries, whether the child is US-born or an immigrant.72 Assigning child costs to parents creates the illusion that children have no costs and that immigrants of childbearing age are much more costly than they are. It also inaccurately shifts some costs from citizen-dependent child beneficiaries to immigrants, which, as economists Pia M. Orrenius, Alan D. Viard, and Madeline Zavodny write, “overstates the net fiscal costs of immigrants relative to US natives.”73 This is because immigrants’ US citizen adult child’s tax revenues are then not counted toward immigrant tax revenues when they leave their household. It conversely makes the children of immigrants seem less costly than they are because their costs would be incorrectly attributed to immigrant adults. The most accurate approach to estimate the multigenerational effect of immigration is to include the whole second generation in the analysis, as we do.
Misattributing child spending to parents also distorts potential policy implications. For instance, it cannot be assumed that if an immigrant parent were removed from the country, welfare spending on their dependents would decrease, since their children would still be eligible. Moreover, since removals lower household earned income, they could even result in higher welfare payments in some cases,74 and some children of deported immigrants end up in foster care, which is exceedingly expensive.75 Similarly, increasing costs attributable to the average person of childbearing age makes a policy that accepted only prime-age workers without family (such as guest workers) seem much more expensive than it would be. Finally, falsely attributing some spending on US citizens to immigrants can mislead policymakers on how much spending could be legally restricted from going to immigrants.
Attributing child costs to specific educational groups: One fundamental problem with estimating the cost of high-skilled or low-skilled immigrants is that all children are low-skilled, but it would be absurd to attribute all education costs to low-skilled immigrants and then attribute all tax revenue from people who earn their degrees to high-skilled immigrants. There is perhaps a temptation here to label children based on their parents’ education until adulthood, but this still severely biases the calculation against the low-skilled and creates an inconsistency where the same person is labeled low-skilled when they are creating costs as a child but then labeled high-skilled once they start working and paying taxes.
A better approach is to label immigrant children based on their parents’ education and then maintain that definition into adulthood, such that low-skilled immigrants are still credited with the earnings of some highly educated workers who are the children of low-skilled parents. This approach makes sense if the goal is to identify the ultimate, long-run effect of permitting low-skilled immigrants and their family members to immigrate. Policymakers would really have no other way to categorize children upon entry.
The NASEM uses this second method for its forward-looking projections, and it significantly increases net revenue attributed to lower-skilled immigrants.76 This approach, however, can lend itself to some confusion because much of the tax revenue attributed to low-skilled immigrants would not then actually be from low-skilled immigrants. The alternative used here is to predict each child’s final educational attainment using a regression that uses their parents’ education, race, and ethnicity.
Our methodology is as follows: From CPS samples from 1994 to 1999, we find a group of parents at least 25 years old who have at least one coresident child between the ages of 10 and 16 in the household.77 Parent-child groups are separated by birthplace region.78 We then use CPS samples from 2010–2023 to identify former child immigrants aged 25–31 who have the same parents’ birthplace regions. There are 10 regions, so we then have 10 child-parent pairings for the regressions. Ages 10–16 are used to maximize the sample size while ensuring that the children being counted in the sample are young enough to be living with their parents in the starting year and old enough to have mostly completed their education 15 years later. Then, for each region, the average education levels of children and parents were constructed and used to create the regression. The education of the child’s parent was used as the dependent variable to apply the regressions. For individuals with no co-resident parents, the average educational attainment of the parents in the corresponding birthplace group 10 years prior was used, when the individual was more likely to be living with a parent.79
Government Spending
Types of spending: This analysis categorizes all federal, state, and local government current expenditures into 55 types, an increase from 32 in the NASEM analysis. This allows for more specificity in attributing these costs to individuals. The major spending categories (Figure A1) include:
- pure public goods, including interest payments on past debt, national defense (including veterans’ affairs and space), foreign affairs, and subsidies;
- old-age benefits, including Medicare, Social Security, and government pensions;
- needs-based benefits, including Medicaid, assistance for food, housing, energy, or income, refundable tax credits broken down by type, refugee assistance, and shelters for noncitizens released by Border Patrol from 2021 to 2023;80
- education, including public K–12 and college subsidies; and
- everything else, including transportation, law enforcement, fire protection, and parks and recreation.

The Appendix Variables List on page 60 has the full list of spending categories, methodological details, and sources.
Tax credits: The NASEM modeled refundable tax credits as government spending because credits are not solely based on the tax filer’s eligibility, and again, the goal of this analysis is to trace spending to the individual. The Cato model further breaks down tax credits into their individual streams to more accurately assign their costs to individuals. This is particularly important for the Child Tax Credit, which the NASEM had distributed evenly among the entire household rather than to the specific children who trigger the outlays (see the discussion in this Appendix on child spending). We also exclude ineligible noncitizens from mixed-status households in these distributions, as we do for other household benefits, and instead identify them based on their non-use of all other benefits.
Medical spending: The ASEC does not record the value of Medicare and Medicaid for participants but it does record whether the person was enrolled in these programs. To ensure we report this significant stream accurately, we first assign covered individuals the age- and gender-specific per enrollee Medicare and Medicaid expenditures, as reported by the National Health Expenditure Accounts (NHEA) Age and Gender Estimates.81 Unfortunately, the NHEA dataset lacks information on nativity. Despite its limitations, the Medical Expenditures Panel Survey (MEPS) is the only major survey with this information, and we used it to determine the immigrant and US-born shares of total Medicaid and Medicare spending, which were distributed based on the NHEA distributions.82 The MEPS has its own limitations, such as excluding institutionalized persons, and these limitations are likely biased against immigrants because immigrants are less likely to be institutionalized.83 The MEPS indicates that the NHEA estimate for the immigrant share of spending was too high for Medicaid and too low for Medicare, so we adjusted the amounts appropriately.84 Following the NASEM, nursing home residents are assumed to cost double the average.
K–12 education: Following the original NASEM methodology, we obtain state-level per pupil spending data from the Census Bureau’s Annual Survey of School System Finances for 1994–2021, linearly interpolating for 2022 and 2023.85 For high school students, a half weight is applied to those enrolled half-time.86 For elementary or junior high students (5‑to-14 years old), 100 percent enrollment is assumed. We also identify the proportion of students with limited English proficiency (LEP) by nativity using the ACS,87 and we follow the NASEM assumption that LEP students used 44 percent more educational resources, which was based on a 1994 study of students in Florida.88 Other studies indicate generally lower costs.89 Further research is needed to update this estimate, as well as to estimate the costs of disabled students, who cost much more but who appear less likely to be immigrants.90
Higher education: College subsidies are distributed in the model on a per pupil basis, except that noncitizens are assigned zero net costs. This is because 54 percent of noncitizen college students are temporary international students who pay full tuition.91 International students account for 12 percent of all revenue at public universities, but they are only 4 percent of the enrolled population.92 Given that each international student is paying the cost for two other students at public universities, the net effect of noncitizens overall is likely positive. In addition, there are nearly half a million illegal immigrant students who are entirely ineligible for federal aid and are also ineligible for state aid in many states.93 Overall, illegal and international students were 83 percent of noncitizen college students in 2022.
Student loans: There is an inconsistency in the treatment of student loans in our sources. Our model typically subtracts all higher education spending reported by the White House’s Office of Budget and Management (OMB) from all current expenditures not specifically allocated in the Bureau of Economic Analysis’s NIPA, which sets the total aggregate spending for the entire government for the year in the NASEM–Cato model, and the remainder is deemed spending on “congestible public goods” that are distributed equally across the population. In 2022, however, student loan forgiveness created a massive discrepancy between OMB and NIPA because OMB treats student loan forgiveness as spending at the time it is forgiven94 and NIPA treats it only as lost future revenue.95 To maintain the consistency in the aggregate spending totals from NIPA, we interpolated higher education spending for 2022.
Migrant shelter costs: Costs of 2023 hotel shelters for illegal immigrants are subtracted from congestible spending and apportioned to noncitizens as new spending flows. Federal shelter costs totaled $207,271,140 in 2023.96 State and local shelter costs totaled nearly $4 billion, which includes expenses for New York City, Chicago, Denver, Boston, and Washington, DC97 Some other cities will be higher, and some cities—such as Miami—that have policies prohibiting public shelter use by migrants will be lower.98 There is pre-pandemic (2012–2013) evidence that immigrants were significantly less likely to have experienced homelessness than the US-born population, so there is no reason to suspect that immigrants were generally more likely to use homeless services outside areas with right-to-shelter laws during the study period.99
Congestible public goods: The government spends a significant portion of its budget on what are commonly called public goods, which are generally costs not directly attributable to any specific person. The NASEM–Cato model divides these spending items into two types: congestible public goods that generally necessitate increased spending in response to population growth to maintain the same quality or availability of the government service; and pure public goods that are generally unaffected by population growth. The main congestible public goods categories are transportation, fire, courts, police, and other law enforcement. The assumption that all people cause the same increase in congestible public goods spending, and that these items always increase proportional to population may deserve further study. For instance, it may be that people with higher incomes impose higher costs on the transportation system,100 and that transportation infrastructure does not require a proportional increase with population.101
Prisons and felony policing: In general, we distribute congestible public goods equally among the entire population. However, we consider incarceration costs and spending related to felony policing and felony courts as being caused by the offender. For that reason, we give prisons and felony policing and courts a separate category from other congestible spending and distribute those costs based on the incarceration rate for immigrants or noncitizens, respectively, using the American Community Survey group quarters, ages 18 to 54. The NASEM only distributed costs relating to prisons in this way, but 96 percent of the prison population is serving time for felonies,102 and so it is logical to treat felony court and policing costs in the same manner. State felony shares of spending are from the National Center for State Courts, using 2012 to 2022 averages for dates before 2012 and after 2023, since data were unavailable, and it was a very consistent percentage.103 The federal felony shares are from the Federal Courts of the United States, using 2001 to 2022 averages for earlier years and for 2023.104 Incarceration rates include immigrant detention centers.105
Immigration enforcement: The NASEM–Cato model treats immigration enforcement like all other non-felony policing as a congestible public good, such that immigrants are deemed to cause a portion of enforcement spending equal to their share of the population. This premise is somewhat biased against immigrants. As the NASEM explains, it is sensible to argue that immigration enforcement “is not a cost of immigration but rather the cost of keeping immigrants out.”106 Political opposition to immigrants—not immigrants themselves—cause immigration enforcement spending. Ascribing enforcement costs entirely to immigrants (or illegal immigrants) absurdly implies that if immigration enforcement succeeded, the costs would be attributed to no one. We adopt the NASEM’s conservative position that ascribes a proportional share of this spending to immigrants. Separately, we include unaccompanied child facilities as immigration enforcement because the children are not free to leave.107
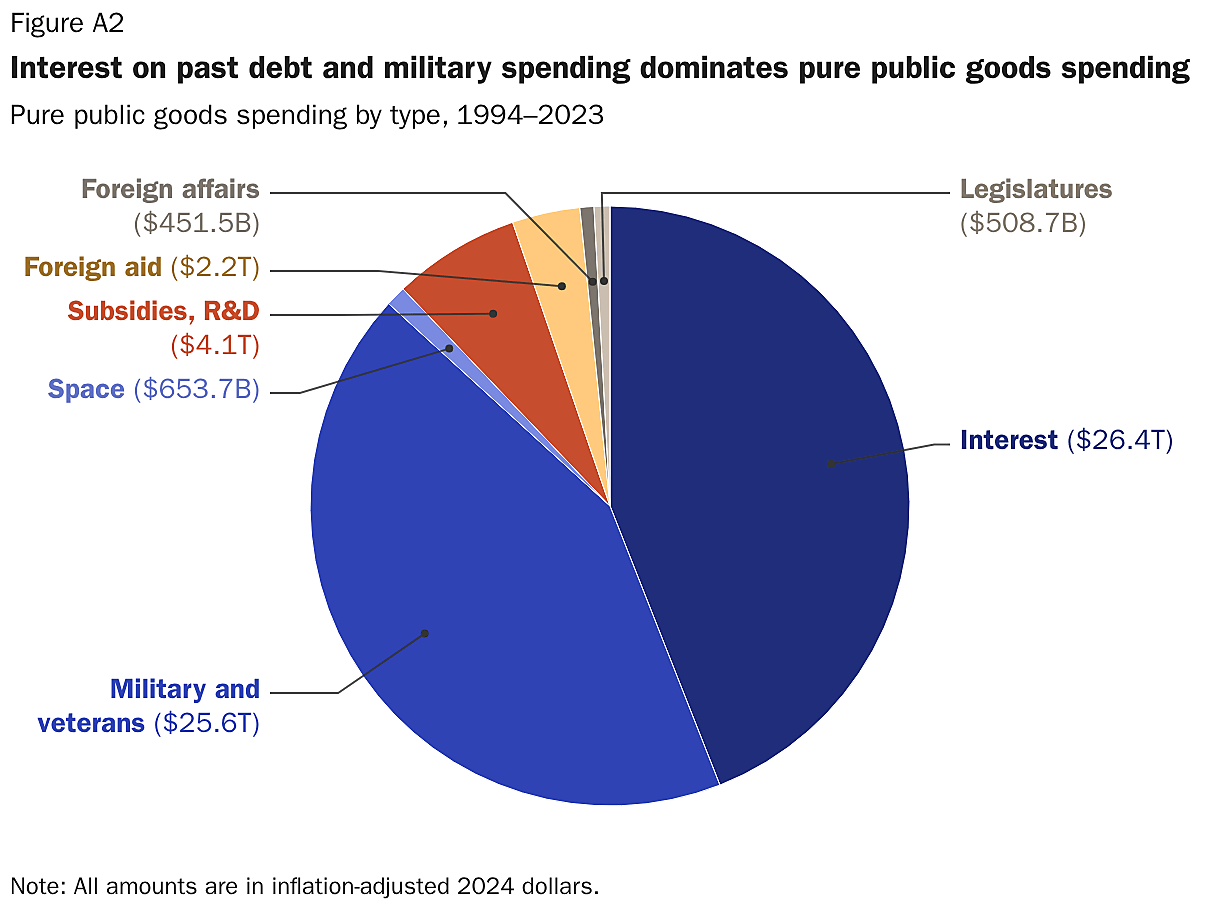
Pure public goods: The NASEM defines pure public goods to include national defense, subsidies, and interest payments on past debt. But following the 2014 fiscal effects work of economists Christian Dustmann and Tommaso Frattini, whom the NASEM cites extensively on these points, we include the following categories: subsidies; foreign affairs; national defense, including veterans’ benefits; space; legislative affairs; and interest payments (Figure A2).108 These are items that theory predicts should generally not causally increase with population growth. Because pure public goods spending—primarily defense spending and interest payments—is such a large part of total government spending, the treatment of this spending matters more than any other single assumption.
In some scenarios, the NASEM attributes no pure public goods costs to immigrants.109 In other scenarios, however, it attributes the cost of pure public goods as benefits equally shared among immigrants and the US-born alike under the same assumptions as congestible public goods spending. These scenarios show the benefit that immigrants receive, not the fiscal cost that immigrants create. As the NASEM states, even in these scenarios, the US-born citizen’s fiscal cost “would have been larger without the addition of the first-generation group because federal expenditures on public goods … would have to be divided among a smaller population. Some argue that this is an important benefit of immigration.”110 This study is not intended to estimate the benefits that immigrants receive, but the costs that they impose.
The largest pure public good was interest payments on past debt. Of course, immigrants, like everyone else in the United States, benefit from the US government meeting its debt obligations, but that is irrelevant. Immigrants cannot increase the cost of interest payments on past debt. Strangely, the NASEM makes its first fiscal effects scenario one where interest payments on past debt are partially attributed to immigrants, yet it states unequivocally that in other scenarios, “we remove interest payments from the public goods calculation because they represent the cost of servicing debt attributable to past spending and deficits from which new immigrants did not benefit.”111 It makes no sense to attribute interest payments on past debt to new immigrants.
To the extent there is any controversy on this point, it revolves around the treatment of defense spending.112 We believe there are several reasons not to attribute increases in defense spending to immigrants:
- Presumption against inclusion: The theoretical baseline is that immigrants do not increase the cost of pure public goods such as military spending. Obviously, a country with a very small population will not have a very large military, but the United States reached a point long ago where there is no need to increase military spending at pace with population growth. In the absence of strong empirical evidence connecting immigrants to growth in defense spending, this theoretical baseline should hold. As economists Pia M. Orrenius, Alan D. Viard, and Madeline Zavodny summarize the economic theory: “Immigrants should not be assigned the average cost of public goods—that approach would hold immigrants responsible for the costs of non-rivalrous goods, such as defense, that would be incurred regardless of whether immigration occurred.”113
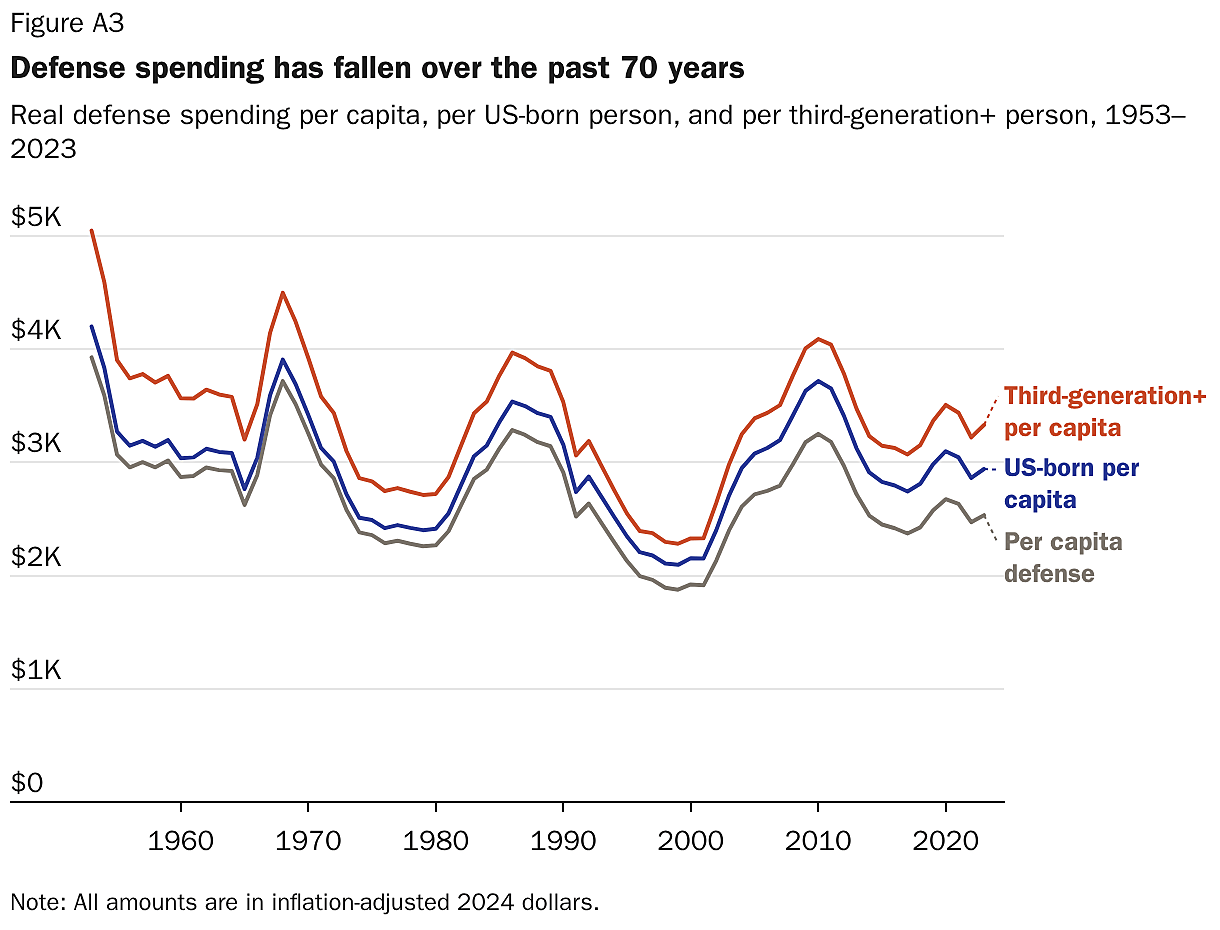
- Per capita defense spending—by far the most expensive public good after interest payments—has fallen, supporting the idea that defense spending is not tied to population growth. Indeed, defense spending per native-born person has also fallen. Even when we consider defense spending per US-born person without immigrant parents, the trend is still slightly negative (Figure A3).114 This provides empirical support for our methodological choice not to attribute the costs of defense to immigrants or their children. Moreover, the occasional reversals in trends (including in the early 2000s) are clearly attributable to foreign policy decisions (Vietnam War, Cold War, and the Iraq War), not immigration. The literature on the causes of defense spending does not support the idea that population growth in general—or immigration in particular—causes increased defense spending.115
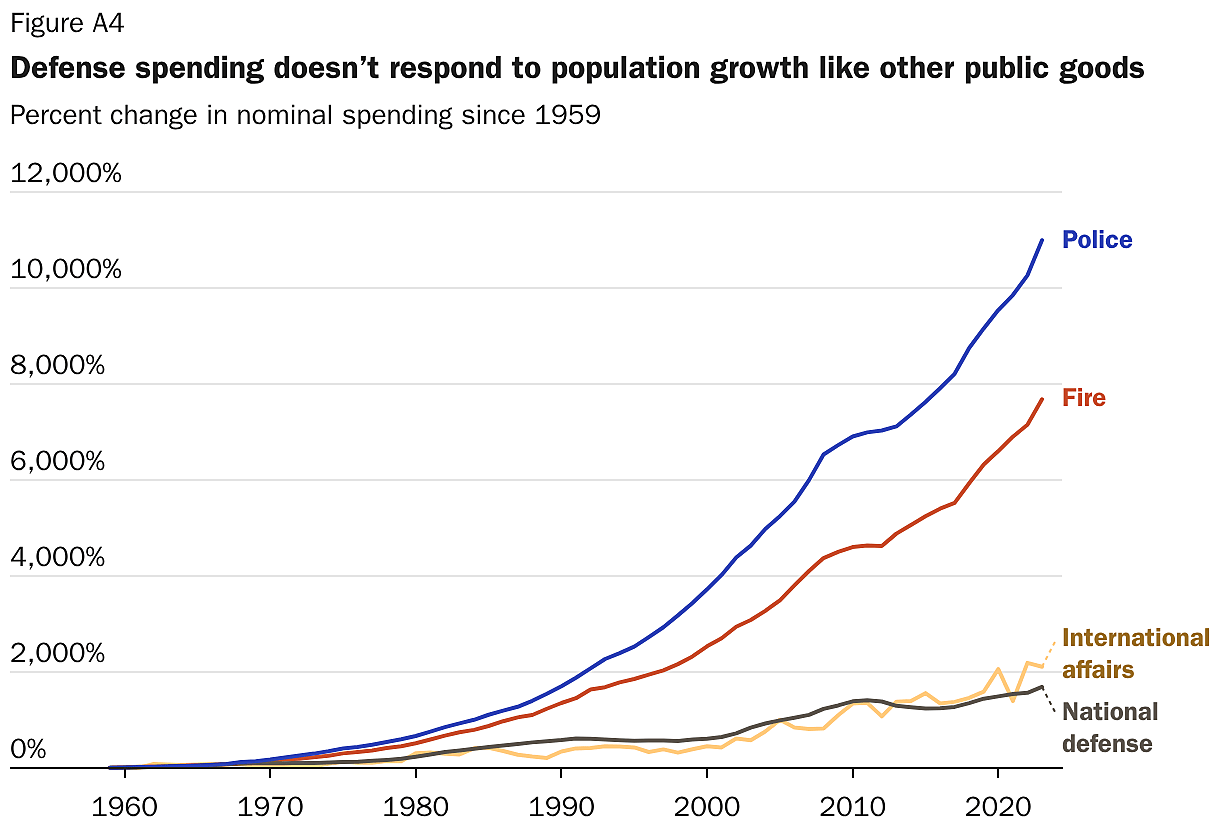
- Military spending does not track increases in clearly congestible public goods: As Figure A4 shows, pure public goods spending has not behaved like congestible public goods spending over the last generation and should not be modeled the same way. State police spending—a clear congestible public good—has increased at a rate five times that of defense spending.
- Immigration likely lowers the cost of pure public goods: The arrival of immigrants clearly cannot even theoretically have any effect on the existence of past debt. But since immigrants reduce debt, as we show in this paper, they ultimately reduce interest rates on debt at the margin, so simply excluding interest rates undersells their effect.116 One literature survey suggests that most estimates cluster “around a 4 bps [basis points] increase per percentage point of debt,” which would add trillions to our estimated interest savings.117 If immigrants have any effect at all on military spending, it is to reduce the cost of recruitment and retention.118 That is because immigrants create a broader pool of recruits, often provide rare skills like translation at lower costs, and are less likely to quit the military.119
- Congestible public goods assumption is likely overstated: There are reasons to suspect that the NASEM’s assumption that congestible public goods automatically scale proportionally with population also overstates the costs of those items. For instance, transportation—one of the largest categories of congestible public goods spending—does not increase in the same manner as other congestible public goods, such as police and fire services, growing at a rate somewhere between the growth in military spending and policing.120 Thus, even if immigrants increase the costs of military spending or foreign affairs spending at some margin, this effect would be mitigated by less congestible public goods spending than assumed.
- Deportations do not reduce pure public goods spending: We view the policy implication that defense spending would be cut in response to removals of immigrants and their children to be theoretically implausible and empirically unsupported.121
- There is no empirical basis for modeling pure public goods: Anyone who believes that immigration increases spending on pure public goods needs to provide evidence for three aspects of the purported increase to incorporate it into the NASEM fiscal effects model: the magnitude, timing, and distribution of this effect. Is it strictly proportional to the increase in the population? Does it occur immediately? And is it equally distributed among all immigrants? The question of distribution cannot be overlooked. A fiscally negative person likely makes it more difficult for the government to increase military spending, so these hypothetical costs—if they existed—would likely only reduce the effects for the most, rather than the least, fiscally positive immigrants.
Not only is there no rigorous opposing model for distributing pure public goods, the available evidence supports our view that immigrants and their children do not increase pure public goods. For these reasons, the Cato model does not attribute the cost of pure public goods to immigrants and their children. This scenario is most closely comparable to the NASEM Scenario 5.
Capital expenditures and receipts: The NASEM model, as well as similar models used by the CBO, do not account for capital expenditures and receipts.122 The NASEM and CBO do not explain specifically why they do not incorporate these costs and revenues into their models. The NASEM’s main analysis was a forward-looking projection using CBO’s budget projections, which only project current expenditures. There are also significant data gaps in the Bureau of Economic Analysis NIPA data for capital expenditures. For instance, NIPA only lists the category of expenses at the broadest level, rather than with the specificity of the current expenditures used in the model (compare NIPA tables 3.16 to 3.17), and depreciation costs are not categorized at all.123 A significant component of capital expenses is on the military, which is a pure public good and would not affect our analysis of the fiscal effects of immigrants. Others—such as on government facilities and property—may have close to zero marginal cost for an additional person. We are unaware of any model that specifies how these costs should be distributed, and it likely would not affect the most important measure of immigrants’ fiscal effect—their effect on debt-to-GDP—since it would likely increase the baseline cost as much as or more than the immigrant cost. For these reasons, we did not attempt to incorporate these costs. However, our rough estimate is that incorporating capital expenditures and receipts would likely lower the total net fiscal effect of immigrants by about 4 percent.
Government Revenues
Distribution of taxes: As with spending, our primary source for the distribution of tax revenues is the CPS–ASEC. The Census Bureau uses the ASEC responses to calculate a person’s state and local tax payments based on their income sources, household composition, state, and demographic characteristics. Its tax model is validated against statistical data from actual Internal Revenue Service (IRS) individual tax returns and property taxes from the Annual Housing Survey.124 The ASEC is used for income taxes, payroll taxes, and property taxes.
Aggregate government revenues: As with spending, the NASEM–Cato model only uses the ASEC for distribution among the population; the aggregate value of taxes comes from the official government source, the BEA’s NIPA.125
Types of tax revenues: We include 15 revenue streams—up from 12 in the NASEM model—to enable more specificity in assigning tax revenues. All streams, along with their sources and distribution assumptions, are found in the Appendix Variables List.
Sales taxes: For sales taxes, Cato follows the NASEM to estimate sales tax payments based on a regression equation estimated from data from the Consumer Expenditure Survey on household spending at a given level of household adjusted gross income (AGI). For excise taxes, the same method was used to estimate consumption of alcohol, tobacco, and gasoline. We reduce AGI downward to account for some money remitted to the immigrants’ home countries.
Payroll taxes: Following the NASEM, we credit employees with 100 percent of the employer share of payroll taxes. If the worker was not employed in the country, none of these taxes would be paid.
Corporate taxes: The NASEM credited employees with 20 percent of corporate income taxes and shareholders with 80 percent. More recent evidence shows that workers pay a majority of the corporate income tax through lower wages, with a 70–30 split in favor of workers being the most likely breakdown.126 This assumption may still understate the employee share because corporate income taxes may actually lower wages more than their total value.127
A 70–30 split may understate workers’ contributions for another reason. As Michael A. Clemens describes, regardless of the specific corporate tax incidence (whether the tax reduces wages or profits), the tax revenue only occurs because the labor supply has grown, implying that workers should be credited with 100 percent of corporate taxes.128 This assumption aligns with the fact that the labor share of income has stayed flat even as the labor force has grown, implying labor income creates at least proportional increases in capital income.129 We adopt the more conservative 70–30 split, which attributes at least some portion of corporate income taxes to owners. For other government revenues from businesses (such as rents and fees) that the NASEM did not incorporate into its model, we credit the full value to the business owners. We exclude non-US origin revenues (taxes from the rest of the world).
Property taxes: The ASEC provides our estimate for the distribution of property tax revenue. Since 2018, however, the ASEC has not estimated property taxes, so we calculate a person’s tax rate from 2019 to 2023 using the 2016 to 2018 tax payment rates by age, immigrant generation, education level, and state of residence.130
Nontax revenues: The original NASEM model excluded nontax revenue. It acknowledges that this choice excluded $400 billion (in 2013 dollars) of revenue, but it does not explain its reasoning for doing so.131 Nontax revenues are dividends, rents and royalties, and transfer receipts from businesses, which are distributed based on dividend income; revenue from government assets, which is distributed based on income tax, and current transfer receipts (mainly fines and fees), which are also distributed based on income tax. The one exception is for state and local transfer receipts from persons, which are largely related to vehicle licensing fees and fines and are distributed based on sales tax revenues, because these revenues are also regressive.132 Profits and losses from government enterprises are added to or subtracted from congestible public goods. These additions account for about 6 percent of all government revenue from 1994 to 2023, but they account for 14 percent of the net fiscal effect of immigrants and 34 percent of the net fiscal effect of low-skilled immigrants (Table A1).133
Indirect property tax revenue: The one semidynamic element that we incorporate into the NASEM model is the effect of immigration on housing values. By increasing the demand for housing, immigration increases the value of property, which increases property tax revenues. We incorporated estimates calculated by Jacob Vigdor, David Bier, and Michael Howard in a 2025 Cato Institute briefing paper, which used an independent variable regression with a shift-share instrument for actual immigrant population to estimate the effect of immigration on property values.134 The percent of property values from immigration (the bottom row in Table A2) that has come from immigration was then multiplied by residential property tax revenue attributed to the US-born in the NASEM–Cato model. In this way, we estimate the property taxes paid by the US-born population that are the indirect result of immigration-generated higher property values. These revenues are added to immigrants’ property tax revenues proportionally to their direct property tax payments. Given the availability of federal tax deductions for state and local taxes, we reduce this amount by the average federal effective income tax rate (about 10 percent), but because only higher-income filers use itemized deductions, we reduce this amount for the higher-educated income earners only.135
Interest savings: Like the NASEM, we attribute interest on debt accumulated before an immigrant’s arrival entirely to the US-born (see also “Pure public goods” section on page 50 of Appendix). In cases where a subpopulation of immigrants is fiscally negative, we account for their interest payments on debt by multiplying that year’s interest rate by their current and past year deficits. Fiscally positive populations reduce the debt and interest paid on the debt. Therefore, for the historical analysis, we show the amount of interest savings attributable to populations with positive net fiscal contributions, separated out from their net fiscal impact or net present value. This calculation of interest savings is conservative because we do not attempt to estimate how much higher interest rates would have been with more debt.136
Static model: Negative fiscal balances in this study should be viewed with caution because they represent only a negative accounting balance, not the fiscal effect after accounting for changes in economic growth that follow immigrants’ employment, investment, and entrepreneurship. Immigrants do increase the employment and income of the US-born.137 The CBO estimates that indirect growth effects account for about one-third of the revenue increase from illegal immigration (and humanitarian lawful entrants with similar characteristics) over 10 years.138 Over longer periods, compounding growth would swamp other minor model changes.
There are also distributional effects from immigration that are not incorporated into the model and that affect the interpretation of our results. For instance, low-wage immigrants increase relative demand for high-wage workers, which further raises their wages and results in more net tax revenue.139 Therefore, the NASEM–Cato model must be seen as the lower bound of the positive fiscal impact of immigrants, especially for lower-wage workers, and any negative results presented in this report must be viewed with caution. The NASEM–Cato model is most useful for identifying the specific revenue and spending streams that affect the relative fiscal effects between the US-born and immigrant populations.
Differences from the NASEM Results
The NASEM presented a snapshot of the fiscal impact of immigrants under different scenarios for 2013, and the results differ from ours. The Cato model for 2013 shows that the average immigrant had a positive net fiscal effect of $10,349. The NASEM baseline scenario was negative $6,424, a difference of $16,773 (both in 2024 dollars). It also had a Scenario 5, which is most like the Cato model in that it does not attribute the cost of pure public goods to immigrants. In this scenario, the difference is still a substantial $11,350. These differences between the Cato and NASEM’s headline results can be pinned primarily to four factors:
- The NASEM treated second-generation dependents as immigrants. This is methodologically invalid because the second generation are not immigrants, either legally or factually and because, by including only dependents, it inconsistently does not count almost all the revenue from the second-generation adults. This choice explains 45 percent of the difference with the NASEM’s baseline net fiscal effect result for 2013 and 66 percent of the difference with its Scenario 5 result that correctly attributes no pure public goods to immigrants.
- The NASEM excluded all nontax revenue from its model (row 6). NASEM does not justify the exclusion of this revenue, which is comprised of fees, fines, and other payments. Excluding these revenue streams creates an inaccurate model of how fiscal flows have developed over the last three decades. Incorporating this revenue accounts for 9 percent of the difference between the Cato and NASEM’s baseline result and 13 percent of the difference between the Cato and NASEM’s Scenario 5 result.
- The NASEM narrowly defined pure public goods. The NASEM included just three categories of spending as pure public goods, costs that do not increase because of immigration: interest payments on past debt, subsidies, and defense spending. But as we note elsewhere, this is too narrow a definition. Veterans’ benefits are a component of military spending, and foreign affairs are very similar to defense (as shown in Figure A3). Legislature expenses are also not tied to immigrant population growth. Space and research and development are similar to subsidies. Correcting this public goods assumption accounts for 7 percent of the difference with the NASEM’s baseline result and 10 percent of the difference with its Scenario 5 result.
- The NASEM presented its baseline results with pure public goods. The NASEM describes its baseline as attributing to immigrants the average cost of pure public goods.140 Yet as we note in our section on pure public goods, the NASEM admits that this scenario is simply inaccurate as a portrayal of the costs that immigrants impose, rather than the benefits they receive.141 For this reason, the NASEM later presents Scenario 5, which excludes pure public goods. Regardless, it is impossible for immigration to increase the cost of past debt even in theory, and it is empirically false that US military spending is tied to population growth (see above). This accounts for 32 percent of the difference between Cato’s result and the NASEM’s baseline result.
Table A3 compares the Cato headline results in per capita terms to the NASEM results for 2013 (in 2024 dollars). Each row builds on the row before it. As it shows, all our other changes make very little net difference once dependents are included. Our inclusion of indirect property taxes explains just 4 percent of the difference in headline results. The different treatment of corporate income tax revenue is less than 1 percent of the difference. In Table A3, including dependents absorbs most of our changes in treatment for household spending relating to mixed-status households and US citizen children, so those effects are muted in the table, but they are more significant when US-born dependents are removed.
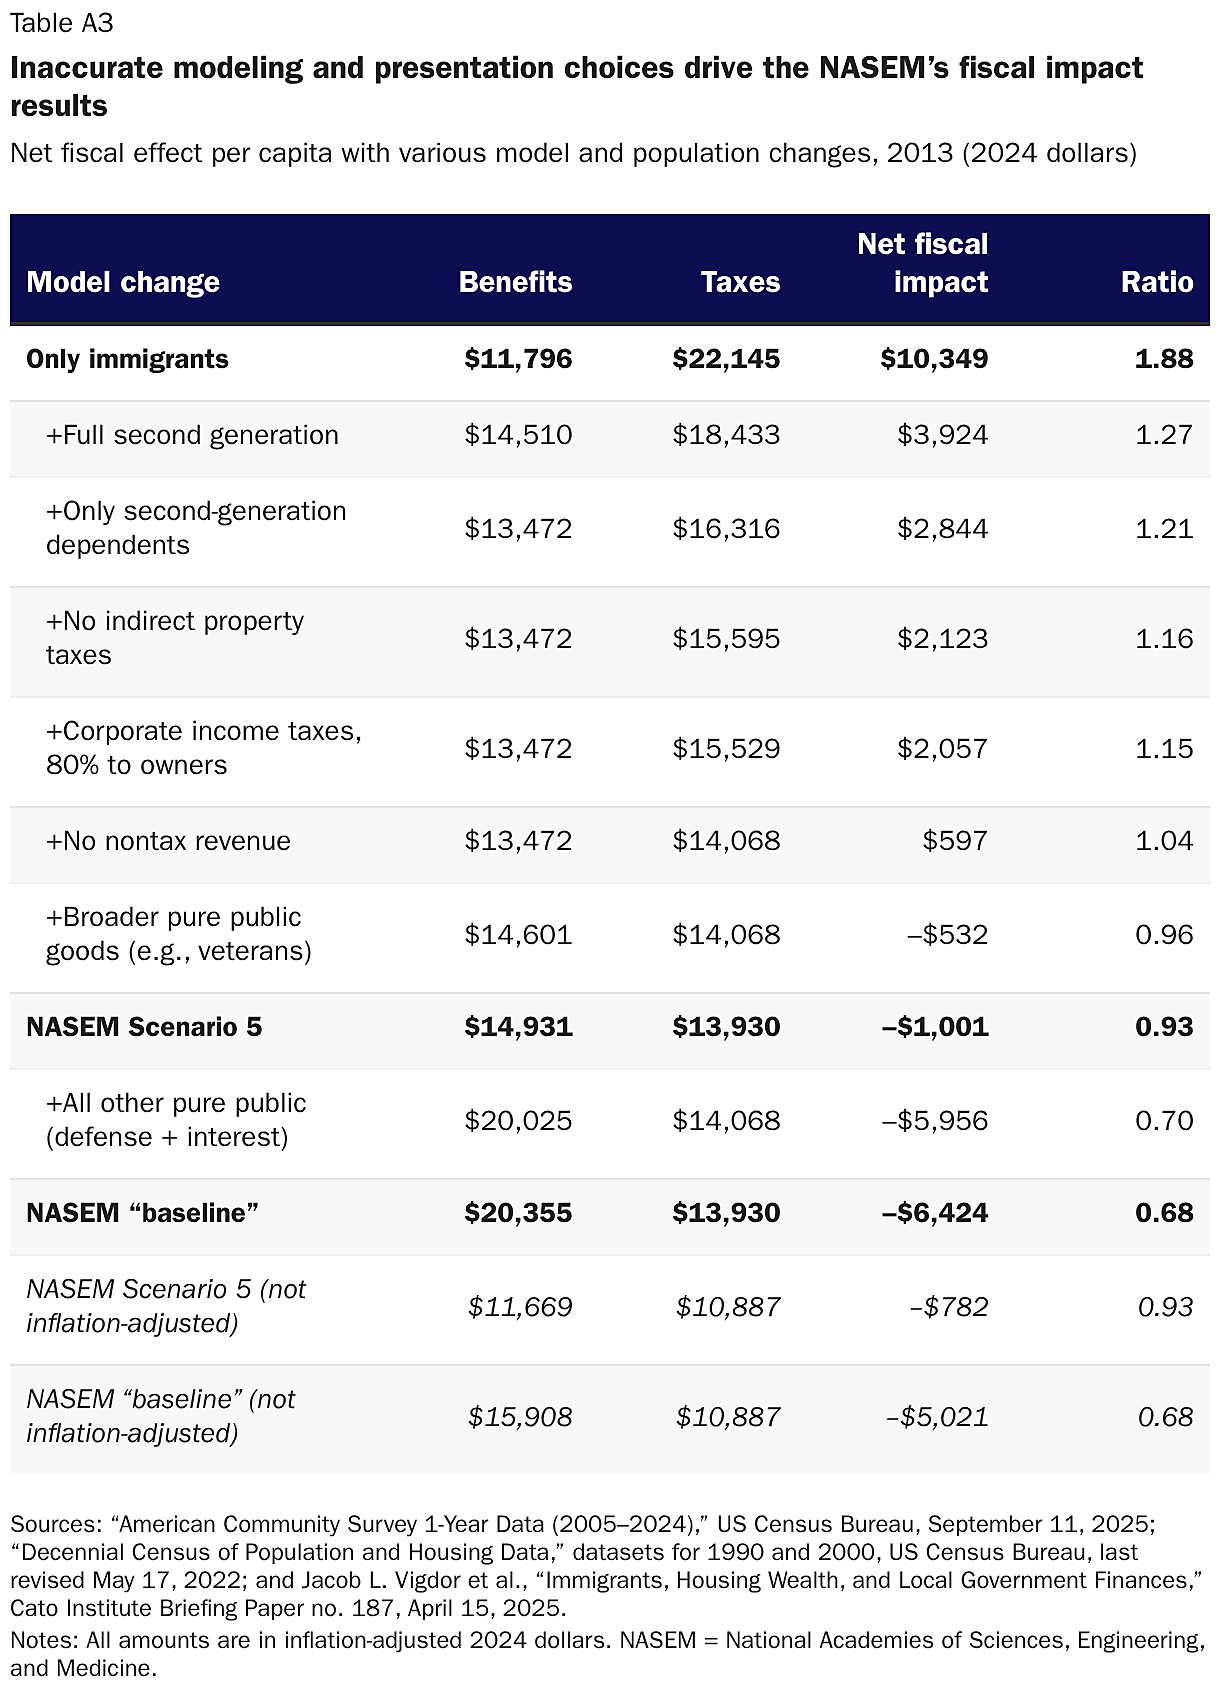
Illegal Immigrant Assumptions
The Current Population Survey does not record lawful status, and the sample size is insufficient to reliably estimate illegal immigrant benefit use directly. Our estimates in this report rely on augmenting our estimates for the noncitizen population based on information about the illegal immigrant population. Using the Census Bureau’s American Community Survey, the Center for Migration Studies in New York has estimated the educational attainment of the illegal immigrant population over age 18 from 2010 to 2023.142 To construct estimates back to 1994, we assumed that the changes in the educational attainment of illegal noncitizens would closely match changes for the overall noncitizen population, as was the case from 2010 to 2023.143 For taxes and GDP, we use the estimate from Alex Nowrasteh and Andrew Forrester in a 2023 Cato Institute research and policy brief, which found that illegal immigrant wages were, from 1995 to 2017, 11.4 percent lower than those of comparable legal immigrants.144
Research over the last half century suggests that 50 to 75 percent of illegal immigrants pay income taxes through employer withholding or tax filing,145 and illegal immigrants were less likely to file a return to claim refunds, leading to overpayments from a portion of the tax payers.146 We follow the Institute on Taxation and Economic Policy, which has produced several reports on this topic, in assuming a 60 percent illegal immigrant income and payroll tax compliance rate (measured by taxes owed versus taxes actually paid).147 At least from 2017 to 2021, the overall rate of voluntary income tax compliance was about 80 percent, according to the Internal Revenue Service, meaning that illegal immigrants were likely paying about 75 percent of the average tax compliance rate.148 After accounting for illegal immigrants’ 11.4 percent lower income, therefore, we assign illegal immigrants 67 percent of the per capita value of tax payments for noncitizens of the same level of education.
For benefits, we assign illegal immigrants the average rate for a noncitizen at illegal immigrants’ educational level for all benefits or programs for which illegal immigrants were categorically eligible. These are school lunch, Women’s Infants and Children (WIC) food assistance, workers’ compensation, felony policing, prisons, and public K–12 education.149 They are less likely to apply for benefits for which they qualify, so this assumption likely overstates illegal immigrant use.150 Illegal immigrants were only slightly more likely to be of school age, but they are also more likely to drop out of school, so we assume the average noncitizen rate for schooling costs based on projected educational attainment.151 Illegal immigrants were assumed to use city shelter services in 2023 at twice the average noncitizen rate since they were roughly half the noncitizen population, and the shelters were for illegal entrants. The federal Child Tax Credit was available to illegal immigrant children through 2017,152 but only about half of eligible illegal immigrant parents filed returns to claim it on behalf of their children.153 The Earned Income Tax Credit was also available to illegal immigrants in 1994 and 1995, and we adopt the same 50 percent assumption regarding use.154
For Medicaid, all immigrants who were ineligible for regular Medicaid accounted for nearly $26.6 billion in emergency Medicaid costs from 2017 to 2023, according to the CBO.155 The average illegal immigrant population was 11.1 million during this time. The average legal immigrant population subject to the five-year bar on eligibility for Medicaid is more difficult to assess because some recent legal immigrants are eligible. We assume that there were five million recent legal permanent resident immigrants, and that one-fifth were eligible for benefits.156 Thus, the average per capita use by Medicaid-ineligible noncitizens was $251 per person per year, compared to the noncitizen average of $1,437. Therefore, we assume that illegal immigrants use Medicaid at 17 percent of the rate of comparable noncitizens.
For state-funded Medicaid and state-administered Child Health Insurance Program, the weighted share of illegal immigrants living in a state with at least some Medicaid access for illegal immigrants was 11.4 percent from 1994 to 2023.157 But this rate also overstates the costs. Even in states where they are eligible, illegal immigrants are generally subject to much stricter limits than regular Medicaid, such as age or numerical limits, and illegal immigrants are generally less likely to apply for benefits.158 For this reason, we cut this percentage in half to 5.7 percent.
For congestible public goods (e.g., fire, non-felony policing, parks, transportation, etc.), we assume that illegal immigrants use the average rate for all noncitizens of the same educational level. For all benefit categories in which illegal immigrants were ineligible, we assume 5 percent of the comparable noncitizen rate to account for fraud or rare situations where a noncitizen without legal status may be temporarily lawfully present, such as by virtue of an application for benefits.
The following list lays out all of our specific assumptions for this model.
List of Variables in the Fiscal Effects Model
Federal income taxes (variable name: inctx_f)
- Source data: Current Population Survey (CPS) individual-level federal taxes. For married couples filing jointly, allocate half to one spouse, half to the other.
- Aggregate: National Income and Product Accounts (NIPA) Table 3.2, “Federal Government Current Receipts and Expenditures,” personal current taxes.
- Institutionalized assumption: Institutionalized persons are assumed to pay no income tax.
- Topcoding: Federal tax = 99999 for years before 2011, used two times the highest non-topcoded value for the year.
- Illegal assumption: 67 percent of the noncitizen per capita value of the same educational level.
Federal corporate taxes (variable name: corptx_f)
- Source data: 30 percent of CPS individual-level dividend (incdivid) and interest (incint) plus 70 percent of CPS individual-level wage (incwage). Change from NASEM: NASEM credited 80 percent to dividend earners.
- Aggregate: NIPA Table 3.2, “Federal Government Current Receipts and Expenditures,” taxes on corporate income.
- Institutionalized assumption: 20 percent of assets of persons in households.
- Topcoding: incdivid = 99999 and incint = 99999 for years prior to 1999, used two times the highest non-topcoded value for the year.
- Illegal assumption: 88.6 percent of the noncitizen per capita value of the same educational level.
Federal excise and customs taxes (variable name: extx_f)
- Source data: Excise taxes predicted based on a regression equation estimated from data from the Consumer Expenditure Survey on household adjusted gross income (AGI) and household consumption of alcohol, tobacco, and gasoline. Regression applied to the household sum of values in the individual-level CPS variable adjginc. Household amount allocated to individuals according to individual shares of household AGI, dividing total spousal couple AGI equally between both spouses. AGI reduced by $1,250 (1994 value) adjusted for inflation, assumed to be remitted to origin country. Change from NASEM: remittance amount adjusted using the Personal Consumption Expenditures Price Index instead of the Consumer Price Index. Change: include customs revenue (tariffs).
- Aggregate: NIPA Table 3.2, “Federal Government Current Receipts and Expenditures,” excise taxes, customs taxes.
- Institutionalized assumption: 0 percent allocation.
- Topcoding: Federal tax = 99999 for years before 2011, used two times the highest non-topcoded value for the year.
- Illegal assumption: 88.6 percent of the noncitizen per capita value of the same educational level.
FICA taxes (variable name: fica_f)
- Source data: CPS individual-level variable FICA (Federal Insurance Contributions Act), which is imputed by the Census Bureau’s tax model; same change made for married couples filing jointly as for federal income taxes (assigned 50/50 to spouses).
- Aggregate: NIPA Table 3.6, “Contributions for Government Social Insurance, Employer and Employee contributions for Old-Age, Survivors, and Disability Insurance; and Hospital Insurance.”
- Institutionalized assumption: 0 percent allocation.
- Topcoding: N/A
- Illegal assumption: 67 percent of the noncitizen per capita value of the same educational level.
Federal SMI contributions (variable name: smicon_f)
- Source data: Allocated according to enrollment in Medicare (CPS variable himcarely = 2).
- Aggregate: NIPA Table 3.6, “Contributions for Government Social Insurance, Employer and Employee contributions for Old-Age, Survivors, and Disability Insurance; and Hospital Insurance.”
- Institutionalized assumption: 0 percent allocation.
- Topcoding: N/A
- Illegal assumption: 67 percent of the noncitizen per capita value of the same educational level.
Federal unemployment contributions (variable name: unmpcon_f)
- Source data: Allocated according to any contributions to FICA taxes in Medicare (CPS variable FICA > 0) to reflect flat amount contributed by employers for each employee.
- Aggregate: NIPA Table 3.6, “Contributions for Government Social Insurance, Unemployment Insurance.”
- Institutionalized assumption: 0 percent allocation.
- Topcoding: N/A
- Illegal assumption: 67 percent of the noncitizen per capita value of the same educational level.
Other federal taxes (variable name: othtx_f)
- Source data: Uses the same age distribution as for federal income taxes. Change from NASEM: Interest receipts on assets and transfer receipts from persons were added.
- Aggregate: All other remaining revenues not already allocated from NIPA Tables 3.2 and 3.6.
- Institutionalized assumption: 0 percent allocation.
- Topcoding: N/A
- Illegal assumption: 88.6 percent of the noncitizen per capita value of the same educational level.
State income taxes (variable name: inctx_s)
- Source data: CPS individual-level state tax, split 50/50 between spouses filing jointly.
- Aggregate: NIPA Table 3.3, “State and Local Government Current Receipts and Expenditures,” personal current taxes.
- Institutionalized assumption: 0 percent allocation.
- Topcoding: State tax = 99999 for years prior to 2011; used two times the highest non-topcoded value for year.
- Illegal assumption: 67 percent of the noncitizen per capita value of the same educational level.
Property tax (owners/renters) (variable names: prptxown_s, prptxrent_s)
- Source data: For property owners (CPS ownership == 10), value is that reported in property tax. For property renters, based on the percentage of people who rent. Only allocated to adults in the house and weighed by family size. Change from NASEM: CPS ASEC property tax variable is not available post-2018. To fill in this data for missing years, we assign each individual the weighted average of their age, immigrant generation, education level, and state of residence bucket based on a three-year average of property taxes paid from 2016–2018.
- Aggregate: State/local property taxes (NIPA Table 3.3), divided by people who own versus rent housing—(Table 2.4.5, “Personal Consumption Expenditures by Type of Product”). When a property is rented, 70 percent of tax proportion is allocated to renters and 30 percent to owners.
- Institutionalized assumption: Renters: 0 percent allocation. Owners: 20 percent allocation.
- Topcoding: N/A
- Illegal assumption: 88.6 percent of the noncitizen per capita value of the same educational level.
Sales taxes (variable name: salestax_s)
- Source data: Similar to excise taxes. Change from NASEM: Exclude state corporate income taxes. Change from NASEM: Added state and local transfers from persons. NASEM did not account for this revenue.
- Aggregate: NIPA Table 3.3, “State and Local Government Current Receipts and Expenditures,” sales taxes.
- Institutionalized assumption: 0 percent allocation.
- Topcoding: adjginc = 99999999; use two times the highest non-topcoded value for year.
- Illegal assumption: 88.6 percent of the noncitizen per capita value of the same educational level.
Other state/local taxes (variable name: othtx_s)
- Source data: Same age distribution as state/local income tax. Change from NASEM: Added interest receipts on assets and transfer receipts from persons, which were added to sales tax. NASEM did not account for this revenue.
- Aggregate: Remaining revenues after other state/local taxes and social benefits are accounted for in NIPA Table 3.3.
- Institutionalized assumption: 0 percent allocation.
- Topcoding: N/A
- Illegal assumption: 88.6 percent of the noncitizen per capita value of the same educational level.
Federal OASDI (variable name: oasdi_f)
- Source data: CPS individual-level Social Security income.
- Aggregate: NIPA Table 3.12, “Government Social Benefits.”
- Institutionalized assumption: Equal allocation.
- Topcoding: N/A
- Illegal assumption: 5 percent of the noncitizen per capita value of the same educational level.
Hospital insurance (Medicare Part A) (variable name: hi_f)
- Source data: CPS individual-level himcare == 2, weighed by per enrollee Medicare expenditures from National Health Expenditure Accounts (NHEA) age and gender estimates. Change from NASEM, which only used age.
- Aggregate: Total Medicare costs come from “Government Social Benefits” (NIPA Table 3.12) multiplied by the percentage going to part A from Medicare Trustees Report.
- Institutionalized assumption: Consume twice the amount of household residents.
- Topcoding: N/A
- Illegal assumption: 5 percent of the noncitizen per capita value of the same educational level.
Supplemental medical insurance (Medicare Parts B and D) (variable name: smi_f)
- Source data: Based on CPS individual level himcare == 2, weighed by per enrollee Medicare expenditures from NHEA age and gender estimates. Change from NASEM, which only used age. Change from NASEM: Use the Medical Expenditures Panel survey to set the aggregate share of expenses for immigrants versus US-born. Change from NASEM: When a person is covered by both Medicare and Medicaid, count only to Medicaid since Medicaid covers the costs in that case.
- Aggregate: Total Medicare costs come from “Government Social Benefits” (NIPA Table 3.12) multiplied by the percentage going to parts B and D from Medicare Trustees Report.
- Institutionalized assumption: Equal allocation.
- Topcoding: N/A
- Illegal assumption: 5 percent of the noncitizen per capita value of the same educational level.
Medicaid payments to nursing homes (variable names: mcaidnhom_f, mcaidnhom_s)
- Source data: Assigned according to the percentage of the population living in nursing homes for each demographic group for ages 65+ from the IPUMS (Integrated Public Use Microdata Series)/ACS institutionalized estimates for that year. Again, the institutionalized estimates only separate first generation immigrants and all native-born Americans.
- Aggregate: ”Government Social Benefits” (NIPA Table 3.12, Medicaid) multiplied by the proportion that Medicaid paid to nursing homes as measured in National Health Expenditures data.
- Institutionalized assumption: N/A
- Topcoding: N/A
- Illegal assumption: Federal level: 17 percent of the noncitizen per capita value of the same educational level. State level: 5.7 percent of the noncitizen per capita value of the same educational level.
Medicaid payments to other than nursing homes (variable names: mcaidnoninst_f, mcaidnoninst_s)
- Source data: Assigned according to Medicaid enrollment (CPS himcaidly == 2), and weighed by per enrollee Medicaid expenditures from NHEA age and gender estimates.
- Aggregate: ”Government Social Benefits” (NIPA Table 3.12, Medicaid) multiplied by the proportion of Medicaid paid to non–nursing homes from NHEA data and separated into federal and state/local.
- Institutionalized assumption: Consume twice the amount of household residents.
- Topcoding: N/A
- Illegal assumption: Federal level: 17 percent of the noncitizen per capita value of the same educational level. State level: 5.7 percent of the noncitizen per capita value of the same educational level.
Unemployment insurance income (variable name: incunemp_f)
- Source data: CPS individual-level incunemp. Some private sources are included but are corrected for in the aggregate adjustment if not large or significantly different by demographic group.
- Aggregate: “Government Social Benefits” (NIPA Table 3.12, unemployment insurance).
- Institutionalized assumption: 0 percent allocation.
- Topcoding: incunemp = 99999 for years 1995, 1996, 1998, 2000–2007, 2009–2013; replace with two times the top value for the non-topcoded.
- Illegal assumption: 5 percent of the noncitizen per capita value of the same educational level.
Railroad retirement (variable name: retrr_f)
- Source data: CPS individual-level variable increti1 increti2 (amount of income from first and second sources) and corresponding srcreti1 == 5 srcreti2 == 5 (receives US railroad retirement pension). Change from NASEM: Rather than dividing 50/50 with spouses, attribute only to direct recipient.
- Aggregate: “Government Social Benefits” (NIPA Table 3.12, US railroad retirement).
- Institutionalized assumption: Equal allocation.
- Topcoding: increti1 and increti2 = 99999 for years up to and including 1998 and from 2011 forward. Replace with two times the highest non-topcoded value for the year.
- Illegal assumption: 5 percent of the noncitizen per capita value of the same educational level.
Supplemental Security Income (variable names: incssi_f, incssi_s)
- Source data: From CPS incssi, with two calculations for federal and state/local.
- Aggregate: “Government Social Benefits” (NIPA Table 3.12).
- Institutionalized assumption: Equal value.
- Topcoding: N/A
- Illegal assumption: 5 percent of the noncitizen per capita value of the same educational level.
EITC (variable name: eitcred_f)
- Source data: CPS individual-level eitcred. Allocated equally to all family members.
- Aggregate: Change from NASEM: Earned Income Tax Credit (EITC) share of refundable tax credits in OMB Table 11.3 multiplied by “Government Social Benefits” (NIPA Table 3.12, refundable tax credits). In NASEM, all refundable tax credits are distributed using the EITC variable.
- Institutionalized assumption: 0 percent allocation.
- Topcoding: N/A
- Illegal assumption: 50 percent of the noncitizen per capita value in 1994–1995; 5 percent in 1996–2023.
Food stamps/SNAP (variable name: fdstmp_f)
- Source data: CPS household-level stampval, allocated equally among all household members. Change from NASEM: Except when the number of covered individuals is smaller than the household size, if a household member is a noncitizen who has no other entitlement use, the noncitizen is assumed illegal and not allocated any benefits. This methodology produces estimates similar to those from the surveys by the US Department of Agriculture, “Characteristics of Supplemental Nutrition Assistance Program Households,” 1994–2023.
- Aggregate: ”Government Social Benefits” (NIPA Table 3.12, federal SNAP benefits).
- Institutionalized assumption: 0 percent allocation.
- Topcoding: N/A
- Illegal assumption: 5 percent of the noncitizen per capita value of the same educational level.
Federal school lunch program (variable name: schlunch_f)
- Source data: CPS household-level lunchsub (whether at least some children in household received this benefit) and frelunch (the amount received). Equal value is assigned to all children in the household if they receive free or reduced lunch, and the total amount is allocated to children 5–18, from youngest to oldest. This is necessary because there is no identifier for which children receive the benefit.
- Aggregate: Federal budget historical tables (Table 12.3, “Total Outlays for Grants to State and Local Governments by Function, Agency, and Program”).
- Institutionalized assumption: 0 percent allocation.
- Topcoding: N/A
- Illegal assumption: 100 percent of the per capita level for noncitizens of the same educational attainment.
Welfare (variable name: incwelfr_f)
- Source data: CPS individual-level incwelfr; total for household is allocated equally among all members.
- Aggregate: ”Government Social Benefits” (NIPA Table 3.12, family assistance and general assistance).
- Institutionalized assumption: 0 percent allocation.
- Topcoding: N/A
- Illegal assumption: 100 percent of the per capita level for noncitizens of the same educational attainment.
Incarceration and felony courts/policing costs (variable names: jail_f, jail_s)
- Source data: The percentage in institutions under age 65, from the IPUMS ACS institutionalized estimates. Cannot distinguish between type of institutions for all years in the sample, and can only separate out first generation immigrants, noncitizens, and all US-born Americans. Change from NASEM: Include court and policing costs from felonies. Multiply court and police expenditures times the state felony shares from the National Center for State Courts, using 2012 to 2022 averages before 2012 and 2023, and the Federal Courts of the United States, using 2001 to 2022 averages for earlier years and 2023.
- Aggregate: NIPA Table 3.16, “Government Current Expenditures by Function,” prison, police, and court costs, separated out by federal versus state/local levels.
- Institutionalized assumption: N/A
- Topcoding: N/A
- Illegal assumption: 100 percent of the per capita level for noncitizens of the same educational attainment.
Military retirement and other veterans’ benefits (variable name: vetben_f)
- Source data: Change from NASEM: Pure public goods; divide equally among the US-born third plus generation. NASEM had treated this as an individual benefit.
- Aggregate: “Government Social Benefits” (NIPA Table 3.12, veterans’ benefits).
- Institutionalized assumption: Equal value.
- Topcoding: N/A
- Illegal assumption: 5 percent of the noncitizen per capita value of the same educational level.
Refugee support (variable name: refugee_f)
- Source data: N/A, allocated equally to all first-generation immigrants.
- Aggregate: Federal Budget Historical Table 11.3, “Outlays for Payments for Individuals by Category and Major Program: 1940–2024,” refugee assistance. NASEM change: Subtract unaccompanied alien child costs from Administration for Children and Families, “Congressional Justification,” 2012–2023, and the Department of Health and Human Services, “Budget in Brief,” 2003–2011.
- Institutionalized assumption: 0 percent allocation.
- Topcoding: N/A
- Illegal assumption: 0 percent
Student aid (cash scholarships) (variable name: scholar_f)
- Source data: CPS individual-level incedu for ages 18–24, allocated if srcedu shows that funding source is from the government. Change from NASEM: 0 percent to noncitizens.
- Aggregate: Federal Budget Historical Table 11.3, “Outlays for Payments for Individuals by Category and Major Program: 1940–2020,” total assistance to students.
- Institutionalized assumption: 0 percent allocation.
- Topcoding: For years 1997 and 2011–2013, topcoded 99999. Substituted two times the highest non-topcoded value.
- Illegal assumption: 5 percent of the noncitizen per capita value of the same educational level.
Rent subsidies (variable name: rentsub_f)
- Source data: CPS household-level rentsub == 2 indicating household receives a rent subsidy. Allocated to all household members equally. Change from NASEM: Except for noncitizens in the household if they have no other entitlement use to account for mixed status households.
- Aggregate: Federal Budget Historical Table 11.3, “Outlays for Payments for Individuals by Category and Major Program,” gives amount spent on housing; Table 12.3, “Total Outlays for Grants to State and Local Governments by Function, Agency, and Program: 1940–2021.”
- Institutionalized assumption: 0 percent allocation.
- Topcoding: N/A
- Illegal assumption: 5 percent of the noncitizen per capita value of the same educational level.
Public housing (variable name: pubhous_f)
- Source data: CPS household-level pubhous == 2 indicating household is part of a government housing project. Allocated to all persons living in the public housing equally. Change from NASEM: Except for noncitizens in the household if they have no other entitlement use to account for mixed status households.
- Aggregate: Historical federal budget tables, Table 11.3, “Outlays for Payments for Individuals by Category and Major Program,” gives amount spent on housing; Table 12.3, “Total Outlays for Grants to State and Local Governments by Function, Agency, and Program: 1940–2021.”
- Institutionalized assumption: 0 percent allocation.
- Topcoding: N/A
- Illegal assumption: 5 percent of the noncitizen per capita value of the same educational level.
Energy assistance (varname: heatsup_f)
- Source data: CPS household-level heatsub (if received) and heatval (amount). Allocated equally among all household members. Change from NASEM: Except for noncitizens in the household if they have no other entitlement use to account for mixed status households.
- Aggregate: ”Government Social Benefits” (NIPA Table 3.12, energy assistance.)
- Institutionalized assumption: 0 percent allocation.
- Topcoding: N/A
- Illegal assumption: 5 percent of the noncitizen per capita value of the same educational level.
Government retirement benefits (variable name: ret_f, ret_s)
- Source data: Federal: CPS individual-level incret1 and incret2 (amount of income from the first/second source) and corresponding srcreti1 == 2; srcreti2 == 2 (received government pension). State/local: CPS individual-level incret1 and incret2 and corresponding srcret1 == 4; srcret2 == 4 (receives state/local government pension). Change from NASEM: Rather than for spouses dividing 50/50, attribute only to direct recipient.
- Aggregate: For federal, historical federal budget tables, Table 11.3, “Outlays for Payments for Individuals by Category and Major Program.” State/local: NIPA Table 7.23, “Transactions of State and Local Government Defined Benefit Pension Plans.”
- Institutionalized assumption: Equal allocation.
- Topcoding: increti1 and increti2 = 99999 for 1998 and earlier and 2011 and after. Substitute 2x highest value for topcoded persons.
- Illegal assumption: 5 percent of the noncitizen per capita value of the same educational level.
Congestible goods—federal and state/local (variable name: cong_f, cong_s)
- Source data: N/A; allocated to all persons equally. Change from NASEM: Include unaccompanied alien child costs from Administration for Children and Families, “Congressional Justification,” 2012–2023 and the Department of Health and Human Services, “Budget in Brief,” 2003–2011. NASEM change: Subtract felony police and courts. Change from NASEM: Profits and losses from government enterprises are included.
- Aggregate: NIPA Table 3.2 for federal, 3.3 for state/local. Remaining flow after all others are accounted for, subtracted from total expenditures.
- Institutionalized assumption: 0 percent allocation.
- Topcoding: N/A
- Illegal assumption: 100 percent of the per capita noncitizen value of the same educational attainment.
State Child Health Insurance Program (SCHIP) (variable name: schip)
- Source data: CPS individual-level SCHIP indicating if person got health insurance via SCHIP. Shape based just on enrollment.
- Aggregate: National Health Accounts, total spent by SCHIP program.
- Institutionalized assumption: 0 percent allocation.
- Topcoding: N/A
- Illegal assumption: 5.7 percent of the noncitizen per-capita value of the same educational level.
WIC (variable name: wic_s)
- Source data: Allocated to all women receiving WIC benefits (from CPS individual-level gotwic) and equally to any of their coresident children 0–4.
- Aggregate: NIPA Table 3.12, “Government Social Benefits,” line for state/local “other.”
- Institutionalized assumption: 0 percent allocation.
- Topcoding: N/A
- Illegal assumption: 100 percent of the per capita noncitizen value of the same educational attainment.
Primary and secondary education (variable name: lowedu_s)
- Source data: Primary and secondary education spending has three components: percent enrolled; state-by-state relative per pupil spending; and percent of schoolchildren with limited English proficiency.
- State per pupil spending is from the Census Bureau’s Annual Survey of School System Finance.
- Enrollment is 100 percent for ages 5–14. For high school students, enrollment is based on schlcoll, with 50 percent weight given to those enrolled half-time. The CPS does not distinguish between private and public schools.
- Data on the percentage of individuals with limited English proficiency (LEP) come from American Community Survey (ACS) IPUMS samples for years 1990 and 2000–2019, linearly extrapolated for years without a sample. For the first generation, LEP is defined as the percentage of first-generation school-age children (ages 5–18) who speak English “not well” (variable SPEAKENG == 1 | SPEAKENG == 6) or do not speak English at home, and who do not speak English “well” or “very well” (LANGUAGE !=1, SPEAKENG !=4, and SPEAKENG != 5). Members of the second generation are assumed to have half the LEP rates as first-generation immigrants. Members of the third- and higher generations are assumed to have 0 percent limited English proficiency. This definition of LEP is a change from NASEM (p. 485). Costs for LEP students are 1.44 times higher than for non–LEP students. For each demographic group, education spending is the percentage of the group that is enrolled, weighted by state spending and LEP.
- Aggregate: Table 3.16, “Government Current Expenditures by Function,” expenditures on primary and secondary education.
- Institutionalized assumption: 0 percent allocation.
- Topcoding: N/A
- Illegal assumption: 100 percent of the per capita noncitizen value of the same educational attainment.
Public college and other postsecondary (variable name: college_s)
- Source data: Based on college enrollment, with a 50 percent weight for those enrolled half-time (from CPS schlcoll). Note that the CPS age range changes from 16–24 (1994–2013) to 16–54 (2013+).
- Aggregate: Table 3.16, “Government Current Expenditures by Function,” expenditures on higher education (federal and state/local combined). Change: Noncitizens are assumed to be zero because there are so many international students subsidizing the cost of other students.
- Institutionalized assumption: 0 percent allocation.
- Topcoding: N/A
- Illegal assumption: 100 percent of the per capita noncitizen value of the same educational attainment.
Workers’ compensation (variable name: incwkcom_s)
- Source data: CPS individual-level incwkcom.
- Aggregate: ”Government Social Benefits” (NIPA Table 3.12, federal and state/local workers’ compensation combined).
- Institutionalized assumption: 0 percent allocation.
- Topcoding: 99999 for 1995, 1996, 1998–2001, 2003, 2004, 2006, 2007, 2009–2013, replaced with 2x maximum value.
- Illegal assumption: 100 percent of the per capita noncitizen value of the same educational attainment.
Bilingual education (variable name: bilingual_s)
- Source data: Age distribution from the percent of LEP for first and second generations. Represents spending on specific language programs rather than cost of educating a low-English-proficient student.
- Aggregate: 2.5 percent of total spent on elementary and secondary education.
- Institutionalized assumption: 0 percent allocation.
- Topcoding: N/A
- Illegal assumption: 100 percent of the per capita noncitizen value of the same educational attainment.
New Non–NASEM Variables
Federal space spending (space_fx)
- Source data: Pure public good; allocated equally across all persons with no US-born parents.
- Aggregate: BEA NIPA Table 3.16, item 19.
- Institutionalized assumption: Equal allocation.
- Topcoding: N/A
Federal legislative spending (leg_fx)
- Source data: Pure public good; allocated equally across all persons with no US-born parents.
- Aggregate: OMB Table 3.2, item 801.
- Institutionalized assumption: Equal allocation.
- Topcoding: N/A
State/local legislative spending (leg_sx)
- Source data: Pure public good; allocated equally across all persons with no US-born parents.
- Aggregate: OEWS and NCSL.
- Institutionalized assumption: Equal allocation.
- Topcoding: N/A
Federal conduct of foreign affairs spending (foraff_fx)
- Source data: Pure public good; allocated equally across all persons with no US-born parents.
- Aggregate: OMB Table 3.2, item 153.
- Institutionalized assumption: Equal allocation.
- Topcoding: N/A
Federal foreign information and exchange spending (forex_fx)
- Source data: Pure public good; allocated equally across all persons with no US-born parents.
- Aggregate: OMB Table 3.2, item 154.
- Institutionalized assumption: Equal allocation.
- Topcoding: N/A
Federal scientific research and development spending (rnd_fx)
- Source data: Pure public good; allocated equally across all persons with no US-born parents.
- Aggregate: OMB Table 3.2, item 251.
- Institutionalized assumption: Equal allocation.
- Topcoding: N/A
Child tax credit (ctcred_f)
- Source data: CPS ASEC CTC Receipt variable (ctccrd).
- Aggregate: OMB Table 11.3, Child Tax Credit and Child and Dependent Care Tax Credit, as a share of refundable tax credits multiplied by “Government Social Benefits” (NIPA Table 3.12, refundable tax credits). Change from NASEM: NASEM distributed all refundable tax credits using the EITC variable.
- Institutionalized assumption: 50 percent of the noncitizen per capita value in 1994–2016; 5 percent in 2017–2023.
- Topcoding: ctccred = 999999, used 2x highest non-topcoded value for year.
- Illegal assumption: 5 percent after 2017; 100 percent from 1994–2017.
2008 economic stimulus payments (stim08_f)
- Source data: Apportioned using the CPS ASEC variable reporting stimulus receipt (STIMULUS).
- Aggregate: US Treasury, “Treasury Distributes 119.242 Million Stimulus Checks in 2008,” January 13, 2009; and Congressional Research Service, “COVID-19 and Direct Payments to Individuals: How Did the 2008 Recovery Rebates Work?,” March 19, 2020; as a share of refundable tax credits multiplied by “Government Social Benefits” (NIPA Table 3.12, refundable tax credits). In NASEM, all refundable tax credits are distributed using the EITC variable.
- Institutionalized assumption: 0 percent allocation.
- Topcoding: N/A
- Illegal assumption: 5 percent of the noncitizen per capita value of the same educational level.
American Opportunity tax credit (aotcred_f)
- Source data: Apportioned to citizens enrolled college students (inlist(schlcoll, 3, 4) & citizen !=5).
- Aggregate: IRS, “SOI Tax Stats — Individual income tax returns complete report,” 2024, as a share of refundable tax credits multiplied by “Government Social Benefits” (NIPA Table 3.12, refundable tax credits). In NASEM, all refundable tax credits are distributed using the EITC variable.
- Institutionalized assumption: 0 percent allocation.
- Topcoding: N/A
- Illegal assumption: 5 percent of the noncitizen per capita value of the same educational level.
Making Work Pay tax credit (mwptcred_f)
- Source data: Apportioned to EITC recipients using CPS ASEC EITC receipt variable (eitcred).
- Aggregate: IRS, “SOI Tax Stats — Individual income tax returns complete report,” 2024, as a share of refundable tax credits multiplied by “Government Social Benefits” (NIPA Table 3.12, refundable tax credits). In NASEM, all refundable tax credits are distributed using the EITC variable.
- Institutionalized assumption: 0 percent allocation
- Topcoding: N/A
- Illegal assumption: 5 percent of the noncitizen per capita value of the same educational level.
Health insurance premium tax credit (hpremtcred_f)
- Source data: Apportioned using CPS ASEC Subsidized Marketplace Coverage variable (mrkscovly). For earlier years when this variable was not available (2014–2018), we apportion this flow to individuals who do not report Medicare or Medicaid coverage, while keeping the proportion of citizens and noncitizens receiving the tax credit the same as post-2019 years.
- Aggregate: OMB Table 11.3, “Refundable Premium Tax Credit and Cost Sharing Reductions,” as a share of refundable tax credits multiplied by “Government Social Benefits” (NIPA Table 3.12, refundable tax credits). In NASEM, all refundable tax credits are distributed using the EITC variable.
- Institutionalized assumption: 0 percent allocation.
- Topcoding: N/A
- Illegal assumption: 5 percent of the noncitizen per capita value of the same educational level.
COVID-19 stimulus payments (covidstim_f)
- Source data: Apportioned equally AFTER reducing the eligible noncitizen and child of noncitizen population by numbers calculated by Julia Gelatt, Randy Capps, and Michael Fix, “Nearly 3 Million U.S. Citizens and Legal Immigrants Initially Excluded under the CARES Act Are Covered Under the December 2020 COVID-19 Stimulus,” Migration Policy Institute, January 2021.
- Aggregate: OMB Table 11.3, U.S. Coronavirus payments and credits.
- Institutionalized assumption: 0 percent allocation.
- Topcoding: N/A
- Illegal assumption: 5 percent of the noncitizen per capita value of the same educational level.
Federal migrant shelter spending (shelter_f)
- Source data: Allocated equally to noncitizens only.
- Aggregate: FEMA
- Institutionalized assumption: N/A
- Topcoding: N/A
- Illegal assumption: 200 percent
State/local migrant shelter spending (shelter_s)
- Source data: Allocated equally to noncitizens only.
- Aggregate: Author’s calculations based on state and local data.
- Institutionalized assumption: N/A
- Topcoding: N/A
- Illegal assumption: 200 percent
Federal income from dividends, interest, and business transfers (fin_f)
- Source data: Apportioned using the CPS ASEC variable reporting dividend income (incdivid). NASEM did not account for this revenue.
- Aggregate: BEA NIPA Table 3.2, items 15, 18, and 20.
- Institutionalized assumption: 20 percent of assets of persons in households.
- Topcoding: incdivid = 9999999, used 2x highest non-topcoded value for year
- Illegal assumption: 88.6 percent of the per capita noncitizen value of the same educational attainment.
State/local income from dividends, interest, and business transfers (fin_s)
- Source data: Apportioned using the CPS ASEC variable reporting dividend income (incdivid). NASEM did not account for this revenue.
- Aggregate: BEA NIPA Table 3.3, items 15, 16, and 19.
- Institutionalized assumption: 20 percent of assets of persons in households.
- Topcoding: incdivid = 9999999, used 2x highest non-topcoded value for year.
- Illegal assumption: 88.6 percent of the per capita noncitizen value of the same educational attainment.
State corporate taxes (variable name: corptx_s)
- Source data: 30 percent of CPS individual-level dividend (incdivid) and interest (incint) plus 70 percent of CPS individual-level wage (incwage). Change from NASEM: NASEM treated state corporate income tax like sales taxes.
- Aggregate: NIPA Table 3.2, “Federal Government Current Receipts and Expenditures,” taxes on corporate income.
- Institutionalized assumption: 20 percent of assets of persons in households.
- Topcoding: incdivid = 99999 and incint = 99999 for years prior to 1999, used 2x highest non-topcoded value for the year.
- Illegal assumption: 88.6 percent of the per capita noncitizen value of the same educational attainment.
Indirect property taxes (variable name: prop_indr)
- Source data: Indirect property taxes generated from immigration-induced increases in property values from US-born in proportion to their property tax revenue, using calculations from Jacob L. Vigdor, David J. Bier, and Michael Howard, “Immigrants, Housing Wealth, and Local Government Finances,” Cato Institute Briefing Paper, April 15, 2025.
- Aggregate: State/local property taxes (NIPA Table 3.3).
- Institutionalized assumption: Renters: 0 percent allocation. Owners: 20 percent allocation.
- Topcoding: N/A
- Illegal assumption: 88.6 percent of the per capita noncitizen value of the same educational attainment.
Indirect property tax deduction (variable name: prop_indr_fed)
- Source data: The share of indirect property taxes deducted from federal income taxes, using the federal effective income tax rate on individual and corporate income: NIPA Tables 3.2 and 1.7.5, applied only to those with a bachelor’s and above.
- Aggregate: N/A
- Institutionalized assumption: Renters: 0 percent allocation. Owners: 20 percent allocation.
- Topcoding: N/A
- Illegal assumption: 88.6 percent of the per capita noncitizen value of the same educational attainment.
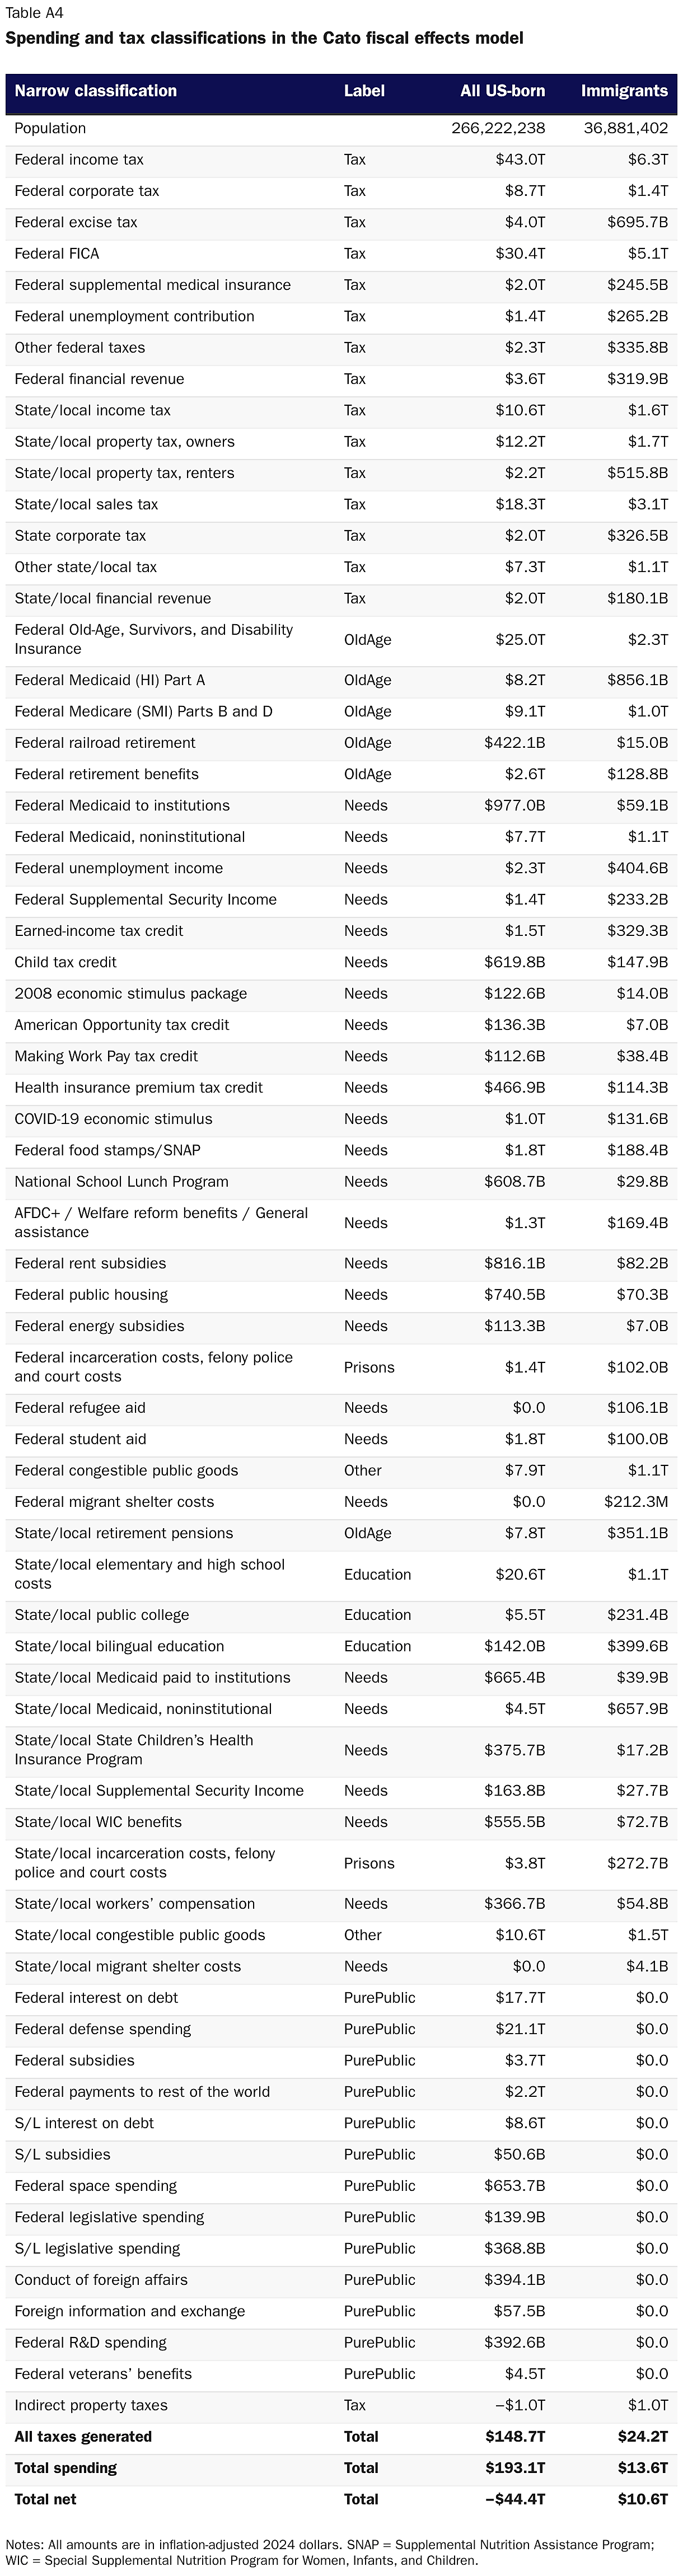
Citation
Bier, David J., Michael Howard, and Julián Salazar. “Immigrants’ Recent Effects on Government Budgets: 1994–2023,” White Paper, Cato Institute, Washington, DC, February 3, 2026.

About the Authors


This work is licensed under a Creative Commons Attribution-NonCommercial-ShareAlike 4.0 International License.