Chairman Griffith, Ranking Member Castor, and distinguished members of the subcommittee, thank you for the opportunity to testify. My name is Alex Nowrasteh, and I am the Vice President for Economic and Social Policy Studies at the Cato Institute, a nonpartisan public policy research organization in Washington, D.C. It is an honor to be invited to speak with you today about “The Safety, Health, and Economic Consequences of President Biden’s Border Policies.”
Over many decades, the Cato Institute has produced original research on the benefits of immigration to Americans, the problems of illegal immigration and chaos along the southwest border caused by the restrictive legal U.S. immigration system, and sober evaluations of the safety, health, and economic consequences of immigration. The consequences of immigration are positive, but they would be much higher if the United States allowed more legal immigration.
Legal Immigration Reduces Border Chaos
Immigrants overwhelmingly desire to live in the United States because their wages are vastly higher here. According to estimates by economists Michael Clemens, Claudio Montenegro, and Lant Pritchett, lower-skilled male migrants can expect an average 300 percent increase in their wages from coming to the United States, which includes the higher cost of living here.1 However, most migrants cannot legally migrate to the United States because of our restrictive legal immigration system (Figures 1 and 2). The United States has one of the most restrictive legal immigration systems of any developed country. Of the 26 Organisation for Economic Cooperation and Development (OECD) countries with complete and available data, legal permanent immigrants to the United States were equal to 0.27 percent of the population in 2021 and 2022 (Figure 3). The United States is in 23rd place regarding legal permanent immigration as a percent of the population – between South Korea and France. Additionally, U.S. labor demand is exceedingly high at about 8.8 million job openings in November 2023 – higher than at any recorded point before April 2021.2 The seasonally adjusted unemployment rate was 3.7 percent in December 2023.3 The labor force participation rate for prime-age workers (25–54 years of age) was 83.2 percent in December 2023, and it hasn’t consistently been that high since the popping of the tech bubble over 20 years ago.4 Real median earnings for full-time employed workers 16 years and older are up a modest 2 percent in real terms (inflation-adjusted with the personal consumption expenditures price index) from the first quarter of 2020 through the 3rd quarter of 2023.5

Source: Cato Institute.
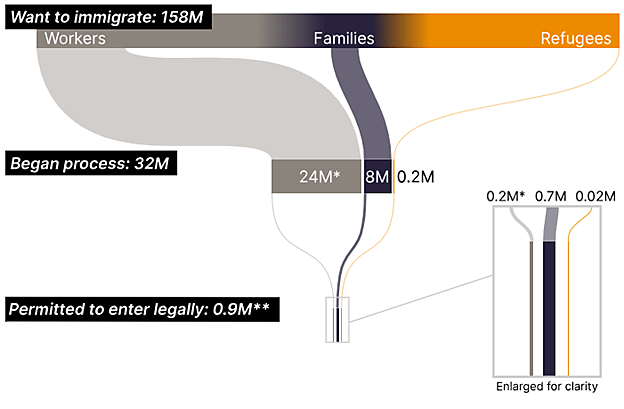
Sources: Cato Institute; Neli Esipova, Anita Pugliese, and Julie Ray, “More than 750 Million Worldwide Would Migrate If They Could,” Gallup, December 10, 2018; David J. Bier, “Family and Employment Green Card Backlog Exceeds 9 Million,” Cato at Liberty (blog), Cato Institute, September 29, 2021; and “FY2021 Appropriations Reporting Requirement Refugee Data,” U.S. Citizenship and Immigration Services, June 29, 2021.
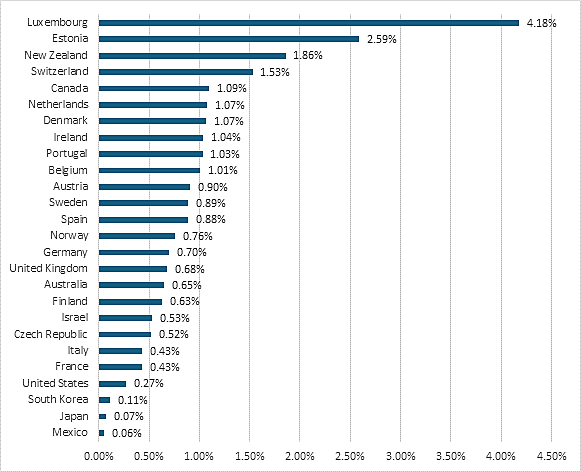
Sources: Department of Homeland Security; Organisation for Economic Cooperation and Development; World Bank; and author’s calculations.
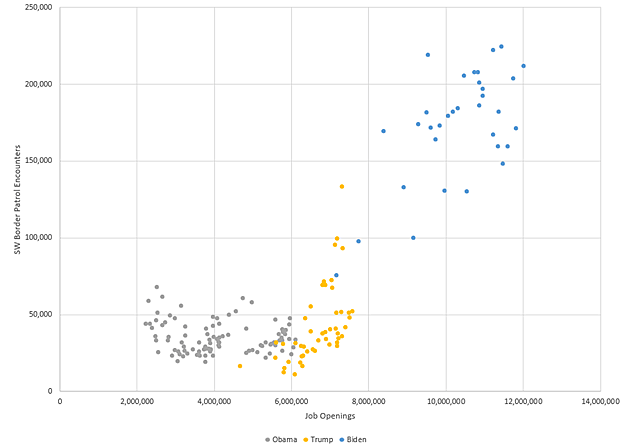
Our restrictive immigration system combines with extraordinary U.S. labor market demand to incentivize illegal immigration, unlawful border crossings, a surge in asylum claims, and a growing black market in human smugglers (Figure 4). Looking at the data, the number of U.S. job openings can explain most of the change in the number of illegal border crossers, illegal immigrant encounters, and disorder along the U.S. southwest border during the Obama, Trump, and Biden administrations. If the data points in Figure 4 were not colored by the administration, nobody could identify when different border policies were enacted because the labor market drives the results.
Sources: Cato Institute; Federal Reserve Bank of St. Louis, U.S. Customs and Border Protection.
The simplest, cheapest, and quickest way to reduce illegal immigration is to vastly expand legal immigration to the United States. Historically, the United States reduced the number of Mexican illegal immigrant border crossers by 93 percent in 1954–1956 by expanding the number of guest worker visas.6 More recently, the Biden administration expanded parole to about 30,000 U.S.-sponsored migrants per month from the countries of Cuba, Venezuela, Nicaragua, and Haiti (CVNH), which went into effect in January 2023.7 The result was a massive decline in the number of border crossers from those countries as many of them instead entered the U.S. on parole (Figure 5). In the 11 months before the Biden administration issued the CVNH parole, Border Patrol had 658,441 encounters with migrants from those countries along the southwest border.8 In the 11 months since Border Patrol had only 247,446 encounters with migrants from those countries along the Southwest border – a 62.4 percent decline relative to the pre-CVNH period. During that time, the number of illegal immigrants apprehended by Border Patrol from other countries was practically unchanged. In the 11 months before CVNH, Border Patrol had 1,538,220 encounters with migrants from non-CVNH countries along the Southwest border. In the 11 months after CVNH, Border Patrol had 1,543,453 encounters with migrants from non-CVNH countries along the Southwest border. If a parole program were extended to other countries sending migrants to the border in January 2023, the number of parole slots were sufficiently high to dissuade illegal immigration, and the effects were the same as those for migrants from the CVNH countries, there would only have been about 830,000 encounters in the 11 months after the CVNH parole was implemented. That would be almost one million fewer encounters than occurred. We’ve also learned that the 30,000 per month number needs to be higher. By mid-2023, about 316,000 migrants were paroled into the United States, but the backlog had grown to 1.7 million.9 As a result, the number of CVNH migrant encounters increased somewhat but stayed below their pre-CVNH highs because migrants would have to wait several years to legally enter. Two lessons from CVNH are that the federal government needs to process parole applications more quickly and the numbers need to be greater. CVNH parole is a remarkable quasi-natural experiment that shows Congress and the Biden administration that expanding legal migration opportunities can resolve the border crisis.

Source: U.S. Customs and Border Protection.
Border chaos is a policy choice. Congress and the administration can end the chaos tomorrow by expanding legal immigration, temporary migration, and parole. A vast human smuggling industry is also a policy choice. Our restrictive immigration policy and border controls subsidize cartels, human smugglers, and other criminals to transport people to the United States, often charging exorbitant prices and inflicting terrible crimes on the migrants along the way. The U.S. government can mortally wound the human smuggling industry by allowing those migrants to come legally and safely. They would mostly fly into the United States on commercial airliners rather than paying to be smuggled across jungles, swamps, and deserts. This would result in a decline in Unaccompanied Alien Children as families would not voluntarily separate. Channeling most would-be border crossers into a legal and regulated system would free Border Patrol to focus on the small number of migrants remaining, improving security.
Immigration and Safety: Terrorism10 and Fentanyl
Terrorism is the threatened or actual use of illegal force and violence by non-state actors to attain a political, economic, religious, or social goal through fear, coercion, or intimidation. My research has identified 219 foreign-born terrorists who committed or intended to commit attacks on U.S. soil from 1975 through the end of 2022.11 They were responsible for 3,046 murders and 17,077 injuries in attacks on U.S. soil during that period, resulting in an annual chance of being murdered in an attack committed by a foreign-born terrorist at about 1 in 4.3 million per year and an annual chance of being injured at about 1 in 774,000 per year.12 By comparison, the annual chance of being murdered in a criminal non-terrorist homicide in the United States was about 1 in 20,134 during that period. The chance of being murdered in a normal homicide is about 316 times greater than being killed in an attack committed by a foreign-born terrorist.13
Zero people have been murdered or injured in attacks on U.S. soil committed by a foreign-born terrorist who entered illegally across the Southwest border or illegally entered elsewhere (Table 1). Nine foreign-born terrorists entered illegally during the 1975–2022 period. Three of the nine, Dritan Duka, Eljvir Duka, and Shain Duka, entered illegally across the Southwest border in 1984 when they were 5, 3, and 1 years old, respectively. They were arrested in 2007 while planning an attack on Fort Dix, New Jersey. Five of the other six terrorists who entered illegally crossed the U.S.-Canada border (Kabbani, Thurston, Mezer, Ressam, and Abdi), and one was a stowaway on a ship (Meskini). Thirteen terrorists entered as asylum applicants. They murdered nine people (1 in 1.5 billion per year chance) and injured 669 others (1 in 20 million per year chance) in attacks on U.S. soil. None of the asylum seekers who became terrorists entered by crossing the U.S.-Mexico border, and only one was from the Western Hemisphere: Eduardo Arocena from Cuba.14
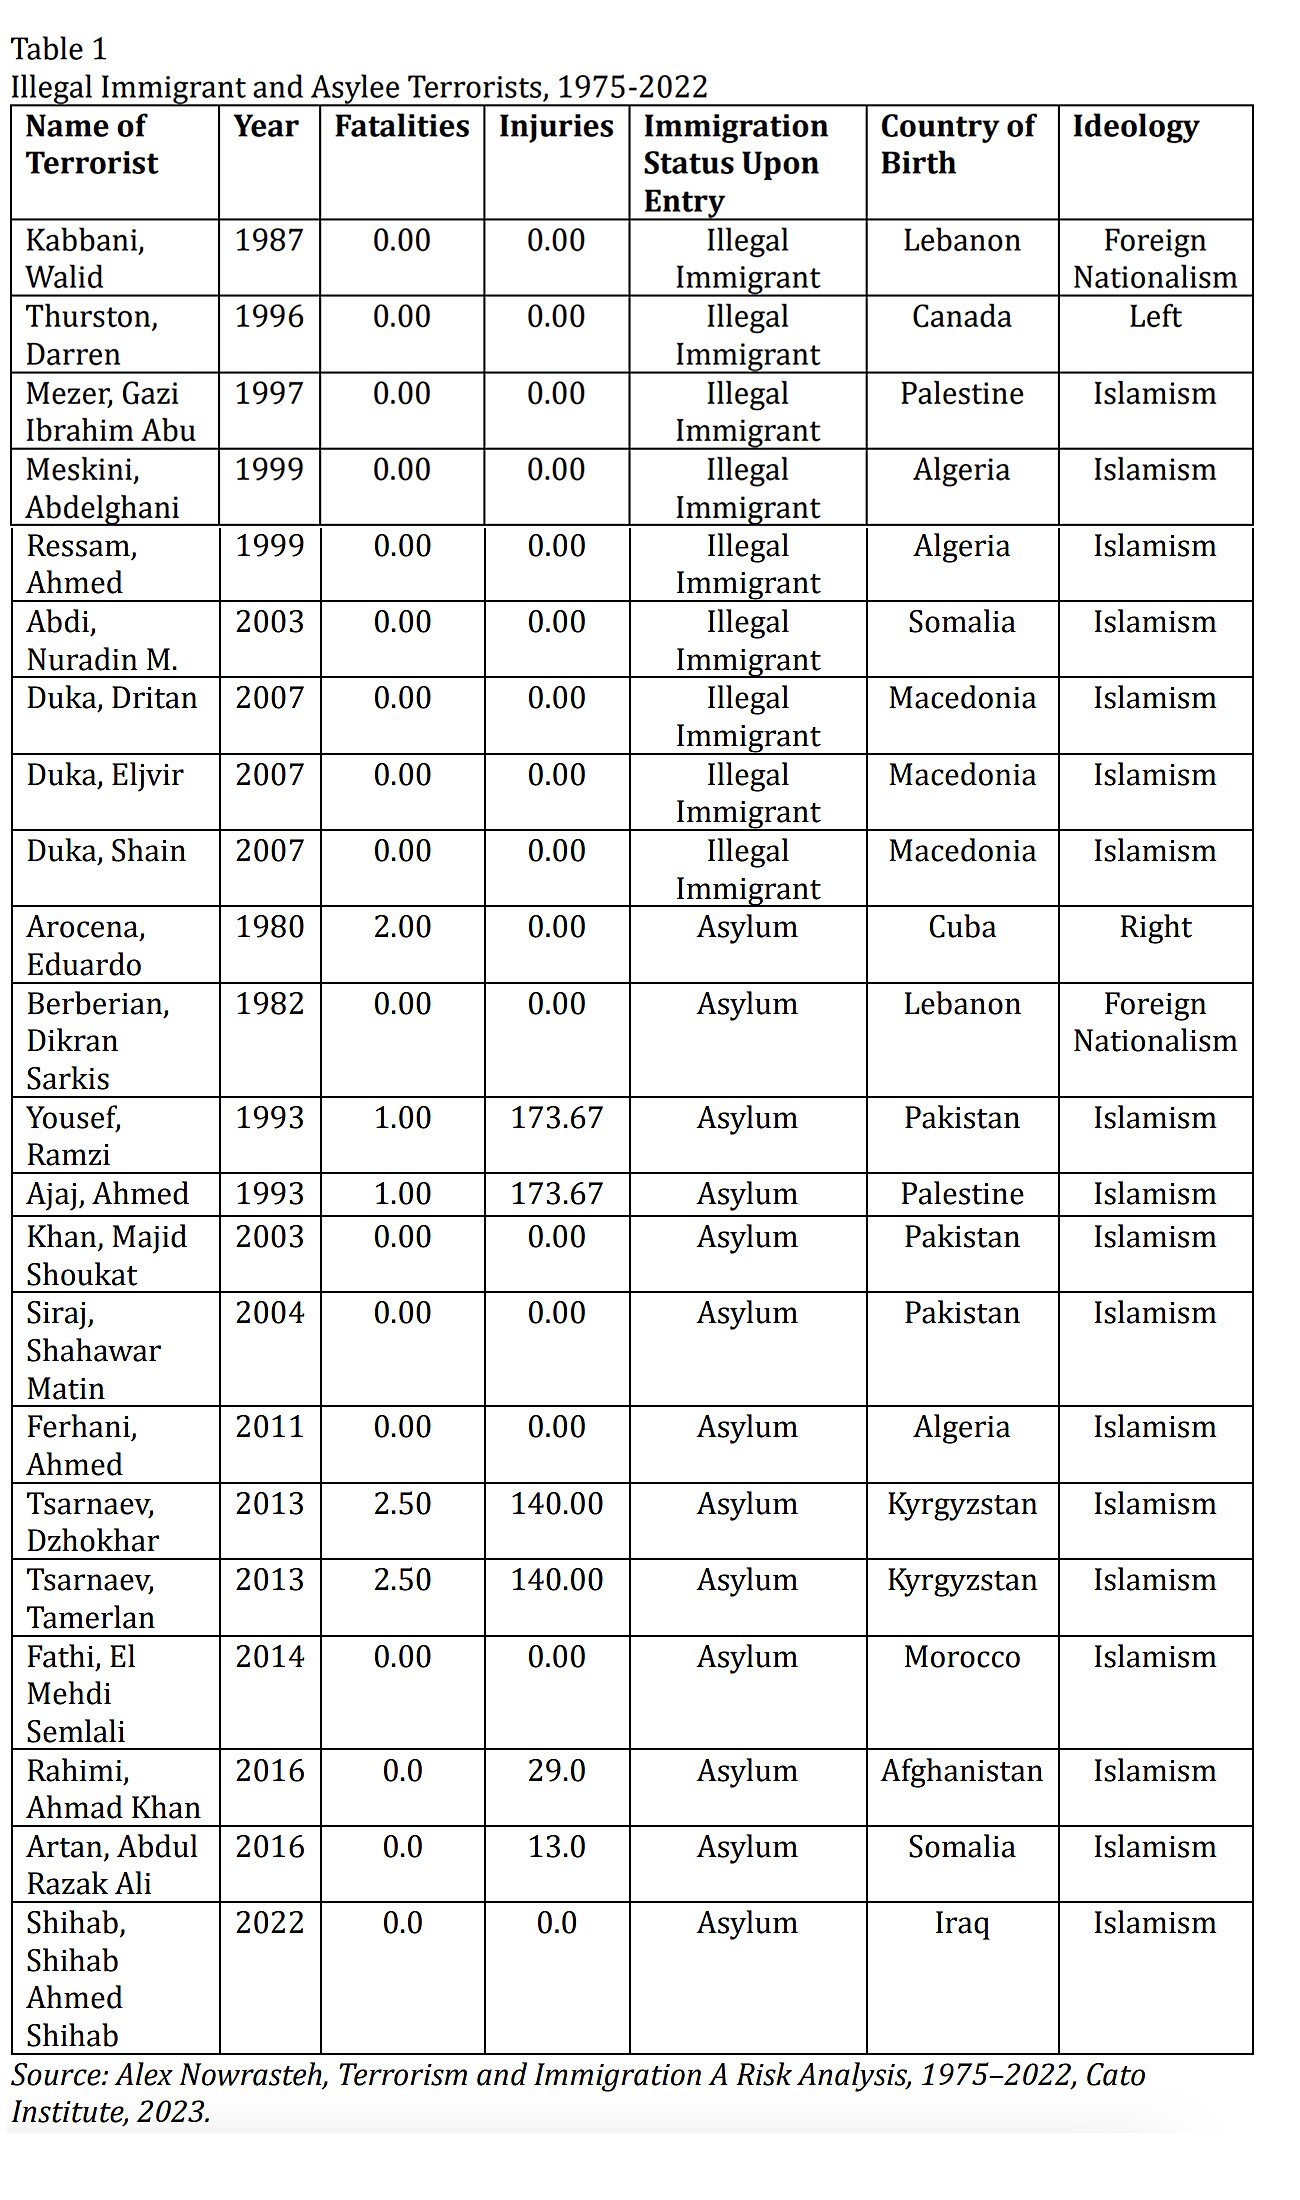
Source: Alex Nowrasteh, Terrorism and Immigration A Risk Analysis, 1975–2022, Cato Institute, 2023.
According to my recent testimony on the terrorist threat along the Southwest border, “Abdulahi Hasan Sharif is the closest example of a possible asylum seeker or illegal immigrant having crossed the U.S.-Mexico border and then committing an attack. He entered the U.S.-Mexico border in 2011 and was immediately apprehended by Border Patrol. He may have possibly applied for asylum, but an immigration judge ordered him to be removed, and Sharif never appealed that decision. Instead, he went to Canada and wounded five people years later in a vehicle attack in Edmonton in 2017.15”16
Migrants encountered by Border Patrol are screened through the Terrorism Screening Database (TSDB).17 The number of positive hits in the TSDB rose from 2 in 2017 to 169 through FY2023 (Table 2). These data do not indicate a heightened risk of terrorism on U.S. soil for several reasons. First, the data quality includes many false positives.18 Second, there are few terrorists in the TSDB. It includes known terrorists,19 suspected terrorists,20 those who are related to terrorism and/or terrorist activities,21 and those who are included without a reasonable suspicion.22 Third, many individuals who are in the TSDB are not affiliated with foreign terrorist organizations (FTOs) that pose a threat to the U.S. homeland, such as FARC and other Colombian narco-insurgents.23 Fourth, prosecutors have not filed terrorism charges against any migrant who entered between a POE and who was flagged by the TSDB. No attacks have been committed or thwarted by an individual who was flagged by the TSDB and entered between POEs.
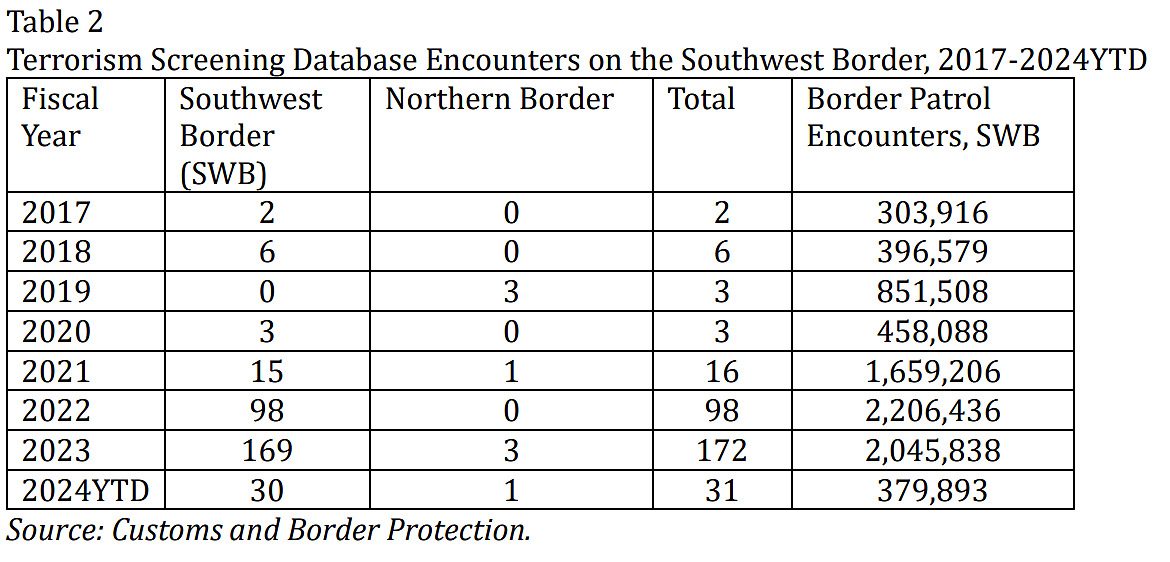
Source: Customs and Border Protection.
The increase in drug overdose deaths is ultimately not a border security issue. Over 86 percent of convicted fentanyl drug traffickers were U.S. citizens in 2021, over 90 percent of fentanyl seizures near or along the border were at legal crossing points or interior vehicle checkpoints, and just 0.02 percent of migrants arrested by Border Patrol for crossing illegally possessed any fentanyl whatsoever.24
Economic Benefits of Immigration
The economic benefits of immigration are gargantuan for Americans, immigrants, and our descendants. People are good for the economy. A large body of evidence finds that an expanding population is necessary for maintaining or expanding economic growth by increasing the supply of workers, scientists, entrepreneurs, and innovators.25 Immigration is currently the source of most population growth in the United States and will soon account for all of it, according to the Congressional Budget Office.26 Immigrants increase the supply and demand sides of the U.S. economy, gross domestic product, and growth rate through many different channels. More immigrants increase the production possibility frontier, or the quantity of goods and services that can be produced. A population boosted by immigrants allows for more division of labor and specialization, prompts additional investment in capital goods, and positively affects total factor productivity.27 In sum, the National Academy of Sciences wrote that:
Immigration also contributes to the nation’s economic growth. Most obviously, immigration supplies workers, which increases GDP and has helped the United States avoid the fate of stagnant economies created by purely demographic forces—in particular, an aging (and, in the case of Japan, a shrinking) workforce. Perhaps even more important than the contribution to labor supply is the infusion of human capital by high-skilled immigration that has boosted the nation's capacity for innovation and technological change. The contributions of immigrants to human and physical capital formation, entrepreneurship, and innovation are essential to long-run sustained economic growth. Innovation carried out by immigrants also has the potential to increase natives' productivity, very likely raising economic growth per capita. In short, the prospects for long-run economic growth in the United States would be considerably dimmed without the contributions of high-skilled immigrants.28
Beyond the economic effects, immigrants also tend to pay more in taxes than they consume in benefits, but the effects vary significantly based on the characteristics of the immigrants.
How Immigration Affects American Workers and the Labor Market29
The most common concern about immigrants is that they increase the supply of labor, which results in lower wages for native-born American workers. However, this result doesn’t hold across American workers, and we shouldn’t expect it from what economists know about economic theory. A brief detour into labor economics helps explain why.
Employers pay for labor because they value that labor more than they value the money they pay in wages. Employer demand for labor is determined entirely by the worker's marginal value product (MVP). The MVP is the quantity of goods or services produced by a worker multiplied by the market price for those goods. Employers demand labor because they can sell what their employees produce to consumers for a profit. Employers will hire a worker if his wages are equal to or below the worker's MVP because revenue from selling the products of his labor is higher than the cost in wages of employing him. Employers hire workers until their MVP is equal to their wage. Employers do not hire beyond that because it would be unprofitable to do so. As mentioned above, immigrants have higher wages in the United States because their MVP is higher than in their home countries, which is just another way of saying that they are productive here.
A worker’s MVP is determined by his labor, capital available to the worker, land that the worker uses, and the quality of entrepreneurship. Entrepreneurs combine the factors of production (labor, capital, and land) to hopefully produce a valuable good or service that he can then sell to consumers for a profit. That profit is compensation for the entrepreneur for the risk of organizing those factors to make a new product or service. The relative prices of those factors of production affect the MVP, and hence wages, of workers. Those factors of production are also created or improved by other producers who supply additional land, capital, and entrepreneurship when their price increases.
The Cobb-Douglas production function shown below is typically used to understand how the inputs of the factors of production mentioned above affect the outputs of the firm, how changes in the relative prices of those factors affect output, and how changes in the relative prices of those factors affect firm decisions to invest in capital or hire laborers:
Y=AL&betaKα
Y is the real value of the goods or services produced. L is the labor input of person-hours worked, and K is the capital input of machinery, equipment, tools, and buildings. A is total factor productivity of technology, know how, or other inputs that can’t be explained by L or K. β and α are the elasticities of capital and labor, respectively, and they typically equal 1 in the long run.
Immigration increases L, which lowers the price of L relative to K. As a result, the relative price of K increases compared to L. K’s higher price gives an incentive to producers of K to supply a greater quantity of K. The additional quantity of K then makes L more productive, which results in raising the price of L. In other words, immigrants increase the supply of workers, which pushes down wages. But that decline in wages increases the relative price of capital used by workers, which means that owners of capital earn higher profits, and those higher profits incentivize investors to produce additional capital that entrepreneurs can buy, which then increases worker MVP, resulting in higher wages. The incentives produce this outcome because firms and entrepreneurs want to maximize their profits.
For example, imagine a construction site with ten workers who use ten hammers to build a house. In this scenario, the workers are labor (L), the hammers are capital (K), and each worker has one hammer. If the entrepreneur hires an 11th worker, then those 11 workers must now share ten hammers. As a result, those workers are going to have a lower MVP and a lower wage because some of them are going to spend time passing the hammer back and forth or standing around without a hammer. That makes hammers relatively more valuable compared to laborers inside of the firm. The firm then purchases the hammer to increase its profits. That higher demand for hammers increases the price of hammers, which gives hammer manufacturers an incentive to supply more hammers. Once that 11th construction worker gets a hammer, his MVP increases which also boosts his wage. If the employer does not raise the worker's wages after he gets a hammer, then another entrepreneur with hammers can hire the worker away for a higher wage. If the entrepreneur does not purchase an additional hammer, then he will suffer lower profits.
The amount of time it takes from when additional workers show up to when producers supply additional hammers is called the long run, which is the amount of time it takes the economy to adjust to a change to reach equilibrium again. The length of time before the long run arrives varies because entrepreneurs, consumers, and workers all try to anticipate the future. For example, some entrepreneurs anticipate that the supply of immigrant workers will grow, so they invest in making new capital goods even before the workers arrive so that the immigrants will be able to use them immediately. As a result, the long run might arrive very quickly, and the initial decline in wages described above might not even happen at all.
The broad lesson from this example is that the labor demand curve is flat in the long run, meaning that an increase in the supply of workers doesn't lower wages in general (Figure 6). This doesn't hold for some workers in some specific occupations or regions of the country, but it holds overall for workers on average in the long run in an economy. This model predicts that the long-run wage effect of immigration on the U.S. economy is zero, and it can't be any other way because of how the supply of the factors of production changes in reaction to the immigrant-induced change in relative prices. Capital increases the MVP of labor, so more capital, relative to the size of the larger immigrant-infused workforce, raises overall nationwide wages back to where they were prior to the arrival of the immigrants. The relative long-run wage effect for native-born American or immigrant workers will differ based on their skill level, with native-born American workers gaining and longer-settled immigrant workers losing on average, but the overall impact on nationwide wages will be zero in the long run.30
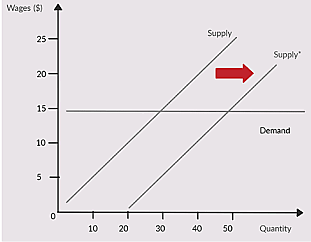
Source: Cato Institute
The theory above is important to understand how an increase in the supply of immigrant workers, or any workers for that matter, can affect wages. There is a wide empirical literature that also supports the theory. Many of the results of the empirical literature focus on the wage elasticity, which measures how much an increase in the supply of workers affects the wage. For example, if a one percentage point increase in the supply of workers leads to a ‑0.1 percentage point decline in wages, then the wage elasticity is ‑0.1. Importantly, the papers that estimate the wage elasticity of native-born workers in response to changes in the supply of immigrants look at the relative change in wages and not the absolute change. Even if the elasticity is negative, that does not mean that wages declined as that wage is relative to other wages. It can and frequently does mean that wages went up for all workers but that they went up a lot more for some workers than for others.
The National Academy of Sciences (NAS) literature survey reported long-term ranges of wage elasticities for all native-born Americans and native-born high school dropouts.31 The effect of a 1 percent increase in labor supply due to immigration on the relative wages of native-born Americans ranges from ‑0.4 to +0.1. Just to reiterate, this means that a 1 percent change in the supply of labor caused by immigrants has a relative effect on wages of between ‑0.4 and +0.1. The effects differ by experience and education.
The two most widely known studies in this vast wage literature are from George Borjas and Gianmarco Ottaviano and Giovanni Peri.32 They are both part of the so-called “skill cell” subset of the literature that also combines structural methods to study how immigrants with specific levels of experience and education affect the relative wages of natives with the same levels of experience and education. Structural methods help estimate the long-run effect by including other research that estimates the speed and extent to which capital adjusts to changes in the labor market as well as elasticities of substitution between workers by skill.
When Borjas and Ottaviano and Peri assume some labor market complementarities, they both find about the same overall wage impact on native-born Americans from immigration at +0.6 percent relative increase in wages in Borjas and +0.5 percent increase in Ottaviano and Peri. But they differ as to the impact of immigration on the wages of native-born American high school dropouts. Borjas finds that the wages of native-born American dropouts fell by a relative ‑1.7 percent compared to Ottaviano and Peri, who found a relative +1.1 percent wage increase for the same group. These different results spring from minute differences in econometric methods.33
Immigrants have a tiny positive effect on the relative wages of native-born Americans, but the effect should be 0 in the long run according to the labor economics theory above. Why is there a difference? The answer is that new immigrants have a much larger effect on the relative wages of other immigrant workers. Borjas and Ottaviano and Peri agree that immigrants lower the relative wages of other immigrants more because they have the most similar skills, level of experience, and live in the same regions of the United States. Immigration produced relative wage declines for every education group of immigrant workers, which is in stark contrast to native-born American workers who mostly experienced relative wage increases.34 New immigrants substituting for and lowering the relative wages of longer-settled immigrants is a common finding in the literature.
The empirical research gets more complicated than that. Native-born workers react to more immigrants by earning more education and taking jobs that require the specific skills that immigrants lack, like fluency in the English language. Economists Giovanni Peri and Chad Sparber found that foreign-born workers specialize in manual labor occupations where they have a comparative advantage, while native-born American workers with the same skills in the same parts of the country specialize in communications-intensive tasks that require English language fluency.35 By specializing in different tasks and occupations, the labor supply in different occupations doesn’t increase much.
One of the best examples of complementary task specialization comes from Denmark. Economists Giovanni Peri and Mette Foged looked at the inflow of individual non-European immigrants who were much less skilled than native Danes and other Europeans to see how the latter reacted to the presence of lower skilled immigrant workers.36 The immigrants incentivized native-born Danish workers and other Europeans to pursue communications-intensive occupations inside of firms, in other firms, and other municipalities without increasing their probability of unemployment. As a result, Danish wages increased after about 5 or 6 years because the Danish workers increased their MVP. Lower-skilled Danish natives upgraded their skills in response to immigration.
If immigrants took jobs from native-born Americans, then there would be local native job losses where immigrants move, and natives would leave those areas. Economists David Card and John DiNardo tested the so-called “skating rink” model of the labor market whereby one new immigrant worker knocks out a similarly skilled native-born worker.37 They found that natives and immigrants in the same skill groups simultaneously move toward the same local areas. Changes in the local economy, such as new business creation, made up for the potential displacement of native workers. This result is the opposite of what we’d expect from a labor market with a fixed supply of jobs or a lump of labor.38
Important for this hearing is that immigration enforcement or reductions in the supply of immigrant workers don’t result in higher wages. Economists Michael Clemens, Ethan Lewis, and Hannah Postel examine the wage effects of a sudden decline in the supply of legal immigrant workers.39 They studied the effectiveness of an immigration policy “designed to raise domestic wages and employment by reducing the total size of the workforce” when the U.S. government terminated the Bracero program for Mexican farm workers in 1964. Clemens, Lewis, and Postel found that farm wages in states with many Braceros and those with few Braceros rose more slowly after the government ended the Bracero program. Farmers turned to machine harvesting and planted less labor-intensive crops to take account of the new dearth of workers. Another paper found that U.S. immigration restrictions in the 1920s did not benefit native-born workers in areas that earlier had many immigrant workers relative to areas that didn’t for the same reasons that Clemens and Lewis identify, but also because of changes in interior U.S. migration and migration from Canada and Mexico.40 Shifting labor supply up and to the left doesn’t always result in a faster pace of wage growth if labor demand shifts down and to the left more.
Economists use other methods to study how immigrants affect wages. Economists Peter Diamond, Dale Mortensen, and Christopher Pissarides pioneered constructing labor market models that explain how firms with job vacancies and unemployed workers try to match up over time.41 These so-called search and matching models explain how frictional unemployment emerges and how firms and workers react to changes in the labor market. There are only a handful of papers that simulate how immigrants affect the searching and matching of jobs, but they all find that immigration decreases the unemployment rate for native-born American workers.42 One such paper by Andri Chassambouli and Theodore Palivos used a search and matching model to analyze how immigration from 2000 to 2009 affected the U.S. labor market.43 They found that immigrants increased the size of the U.S. workforce by 6.1 percent, which diminished the wages of high-skilled native-born workers by 0.31 percent and increased the wages of low-skilled native-born workers by 0.24 percent. At the same time, immigration dropped the long-run rate of unemployment simulated in their model from 6.1 percent to 5.5 percent for low-skilled native-born workers and from 2.4 percent to 2 percent for high-skilled native-born workers. Unemployment dropped for both groups of native-born workers because immigration lowered the costs for firms to search for new workers, which increased the likelihood of quickly filling a vacant job. Lower hiring costs result in more overall hiring.
Then there’s the quasi-natural experiment literature in labor economics. The papers that don’t rely on quasi-natural experiments, such as those mentioned above, must use complex econometric and structural models to investigate how immigration affects labor markets. Trying to detect a shift in wages without a big policy change is like trying to discover the freezing point of water by looking out your window for a year. You can learn something by doing so but your finding will be less precise since you can’t control the temperature outside, keep it steady for long periods, or control air pressure. A quasi-natural experiment is not as good as a randomized controlled trial experiment, but it is more valuable than the complex econometric and structural papers above.
Papers about the Marial Boatlift provide the most well-knownquasi-natural experimental evidence in the economics of immigration field because it occurred at a time with much data, in a relatively isolated portion of the United States, and the Boatlift was caused by policy change in a poor country that was unrelated to the U.S. economy. The first such paper by David Card found no significant effect on the Miami labor market, even though the Boatlift increased the size of the population by about 7 percent in 42 days.44 Later, Borjas examined the effects of the surge and found that it lowered the wages of native-born male Miamians with less than a high-school degree by 10 percent to 30 percent, which faded out after less than a decade.45 I found some odd effects that one wouldn’t expect if the Borjas results were robust, such as a delayed bump in the wages of Hispanic high school dropouts in Miami above other cities (you would expect a wage bump for workers as investors build more capital in response to the sudden immigration shock, but not in the way that I found).46 More recently, economists Michael Clemens and Jennifer Hunt discovered that Borjas’ findings are an artifact of changes in composition in certain very small subsamples of workers in the data that Borjas relied upon.47 This compositional change is specific to Miami and unrelated to the Boatlift. Correcting for that shrinks the negative wage impact substantially.
There are other quasi-natural experimental papers in immigration that study what happened in other locales such as Turkey, Colombia, Israel, France, Portugal, Central Florida, and elsewhere.48 They generally find small temporary negative effects that disappear in the long run, no effects whatsoever in the short run, or even positive effects. The quasi-experimental literature is consistent with the findings of the non-quasi-experimental research above: Immigration just doesn’t affect relative native-born wages or employment very much, the negative effects tend to be short term, and the positive effects tend to appear long term.”49
Randomized lotteries of visas provide the best opportunities to study how migrants affect wages and employment. Economists Michael Clemens and Ethan Lewis evaluated the marginal impacts of the quota on firms that entered the 2021 H‑2B visa lottery using a novel survey and pre-analysis plan that is the closest to a randomized control trial experiment that I’ve seen in the economics of immigration. This is an important paper because randomized control trial experiments are the gold standard in science. Clemens and Lewis found that firms that received more visas increased production significantly (elasticity of +0.16) with no statistically significant effect on U.S. employment (+0.10). There’s almost no substitutability between native-born and foreign-born workers in the labor force.50 This finding is consistent with labor economics theory.
The supply and demand for workers determine wages. The MVP of workers determines labor demand, which is relatively elastic. All the above findings and more are the reasons why the NAS’ exhaustive literature summary on the economic effects of immigration concluded that: “When measured over 10 years or more, the impact of immigration on the wages of native-born workers overall is very small. To the extent that negative impacts occur, they are most likely to be found for prior immigrants or native-born workers who have not completed high school—who are often the closest substitutes for immigrant workers with low skills.”51
The Fiscal Impact of Immigration in the United States
A vast empirical literature examines the fiscal impact of immigration in the United States.52 The general finding of these models is no net effect, a slight positive effect, or an even smaller negative effect depending upon the methods. The most recent research was a quasi-generational accounting model authored by me, Sarah Echardt, and Michael Howard at the Cato Institute. Our working paper was based on the generational accounting model developed by the National Academy of Sciences (NAS) with additional methodological insights provided by Michael Clemens.53 According to the authors of the NAS report, we were the first outside researchers to 1) request their statistical code and 2) run a replication of their model. We then ran their model for additional years. After that, we made some slight methodological changes to their model to create a Cato Model. Those changes included in the Cato Model are:
- Net-present value flows include formerly omitted capital income that occurs as a direct result of the immigrant entering the labor market (adjustment made using the methodology in Clemens [2021]).54
- U.S.-born dependents of first-generation immigrants are allocated to the second generation from birth, and an additional category of “all native-born” is included in summary tables.
- Individuals under 25 are assigned an educational attainment level as predicted via regression.
- Results are presented for two budget scenarios: “CBO projections” and “no adjustments.”
- The “no adjustments” CBO budget scenario assumes a 1.1 percent annual growth rate in productivity.
- Annual remittance payments paid by immigrants are assumed to be $1250 in real dollars, adjusted for inflation using the PCE.
- Federal scholarship benefits can accrue to anyone over the age of 18.
Regardless of those changes, the Cato Model has three remaining problems. First, the Cato Model doesn’t include the total fiscal impact. It is based on the generational accounting methods developed by the NAS for their model. These methods are the best for estimating how immigrants affect government finances over their life cycles because government benefits received and taxes paid vary predictably over a person’s lifetime.55 Generational accounting measures how much each adult generation, on a per capita basis, is likely to pay in taxes net of transfer payments. It then presents the fiscal impact in net present value (NPV) terms, discounted by 3 percent. NPV refers to the total lifetime fiscal impact of an individual and their potential descendants, considering the likelihood of survival, emigration, fertility, and other relevant factors. As a result, it does not include all the extra revenue or lost revenue that results from the dynamic economic effects of immigration. In other words, it only counts the taxes paid by immigrants, but it does not credit immigrants for the extra taxes paid from the economic activity that occurred because of immigrants. We attempted to reduce some of this likely undercount by including the dynamic effect of extra capital investment and taxes paid on that investment due to immigration following work by Michael Clemens, but that is merely the first step in blending the benefits of dynamic economic models and generational accounting methods.56
The second problem is that the Cato Model does not allow us to separate out the net fiscal impact of illegal immigrants. Using a residual statistical method developed by Christian Gunadi to identify likely illegal immigrants, we could only identify 61,652 unique illegal immigrant individuals in the Current Population Survey.57 As a result, the sample size was too small to reliably estimate the fiscal impact of illegal immigrants. We suspect that reduced illegal immigrant ineligibility for most benefits in this model means that the net fiscal impact of illegal immigrants would almost certainly be more positive than that of legal immigrants of the same age and education level, but we were unable to verify that because of the small sample sizes.58
The third problem is that the last year analyzed by the Cato Model was 2018. We plan on updating the Cato Model for a more recent year, but this original choice was based on data availability when we started.
The findings of the Cato Model are positive. In 2018, immigrants paid $1.43 in taxes for every $1 they consumed in benefits at the state, local, and federal levels.59 The state and local effect was particularly positive at $1.52 in taxes paid for every dollar consumed. I have the least confidence in the state and local numbers holding today because of insane right-to-shelter laws in New York that local and state politicians refuse to resolve.60 However, quasi-experimental evidence from the Mariel Boatlift detects no statistically significant effect on Miami budgets.61
The net fiscal impact of immigrants is more positive than it is for every subsequent generation. Native-born Americans, for instance, pay just $0.72 in taxes for every $1.00 they receive in benefits. Including U.S.-born children of immigrants, who are citizens at birth, reduces the ratio of taxes-paid-to-benefits-received for the first generation to $0.96 – slightly negative but much better than for every other generation of Americans.
Conclusion
The economic and fiscal effects of immigration are positive. However, chaos along the Southwest border is a major problem. Congress should reduce the chaos by liberalizing legal immigration. In the meantime, the Biden administration should expand the number of migrants admitted on parole each month from Cuba, Venezuela, Nicaragua, and Haiti and extend parole to other countries that are sending large numbers of illegal immigrants to the Southwest border. Chaos along the Southwest border is a policy choice. The U.S. government should choose order over chaos, economic growth over stagnation, and freedom over control by liberalizing legal immigration.
About the Author


This work is licensed under a Creative Commons Attribution-NonCommercial-ShareAlike 4.0 International License.