
Overview
The Cato 2019 Welfare, Work, and Wealth National Survey of 1,700 Americans investigates attitudes toward the rich and the poor and examines what Americans believe about work, welfare, and social mobility.
Democrats Turn Against Capitalism during Trump Era; 64% of Democrats Like Socialism and 45% Like Capitalism
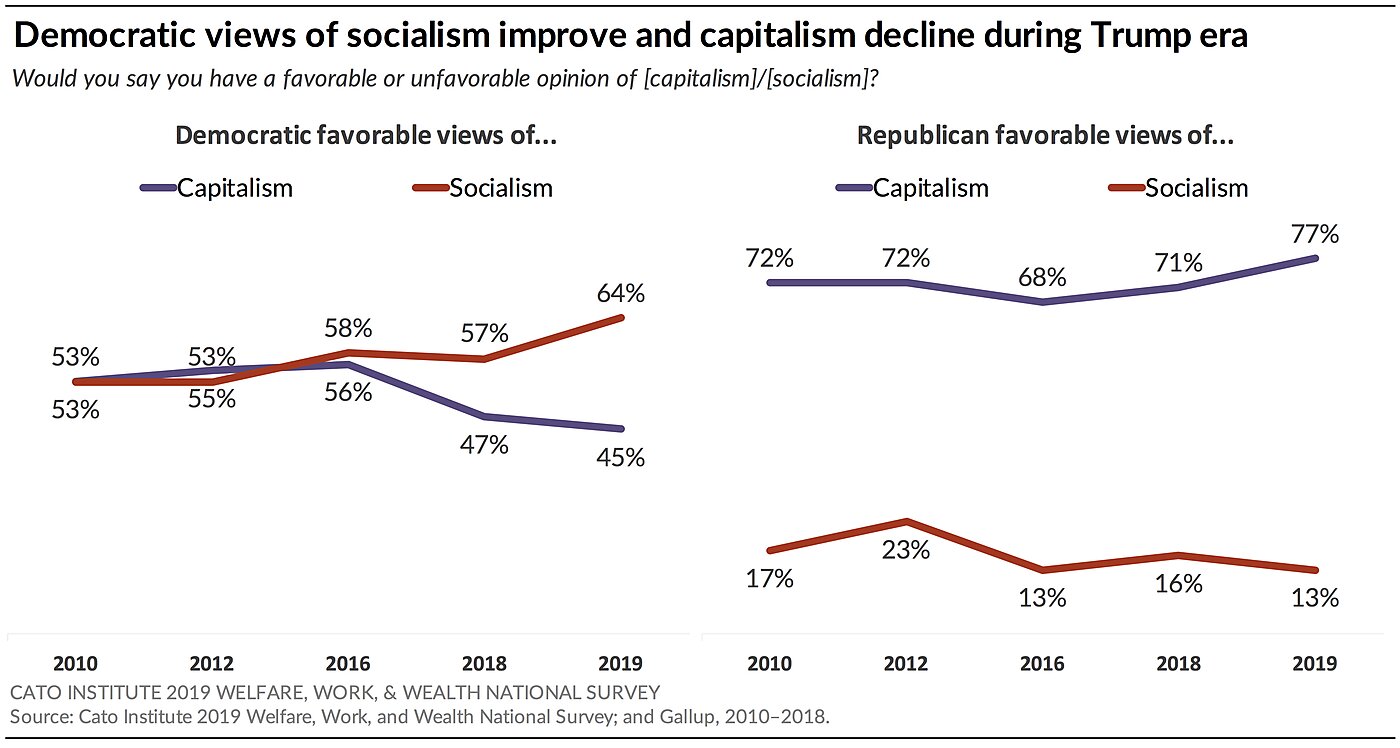
In 2016, Democrats were about as favorable toward capitalism (58%) as socialism (56%). But after President Donald Trump took office, Democrats became more favorable toward socialism. Today, 64% of Democrats have favorable opinions of socialism and 45% are favorable to capitalism. Republicans continue to have overwhelmingly favorable views of capitalism (77%) while only 13% have favorable views of socialism.
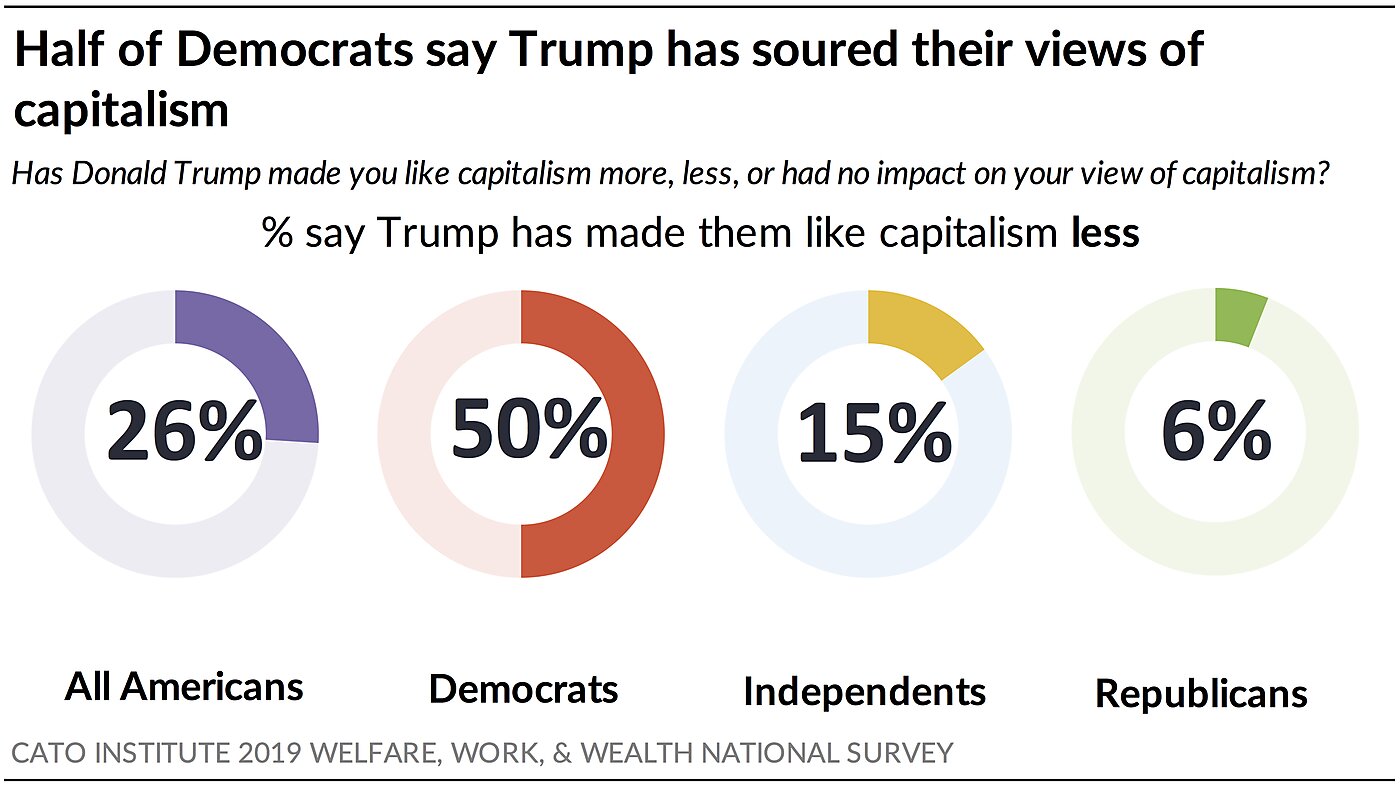
50% of Democrats Say Trump Has Soured Their View of Capitalism
Fully 50% of Democrats say that President Donald Trump has made them “like capitalism less,” while 44% say he has had no impact on their perceptions. In contrast, majorities of independents (76%) and Republicans (64%) say Trump has not influenced their views about capitalism.
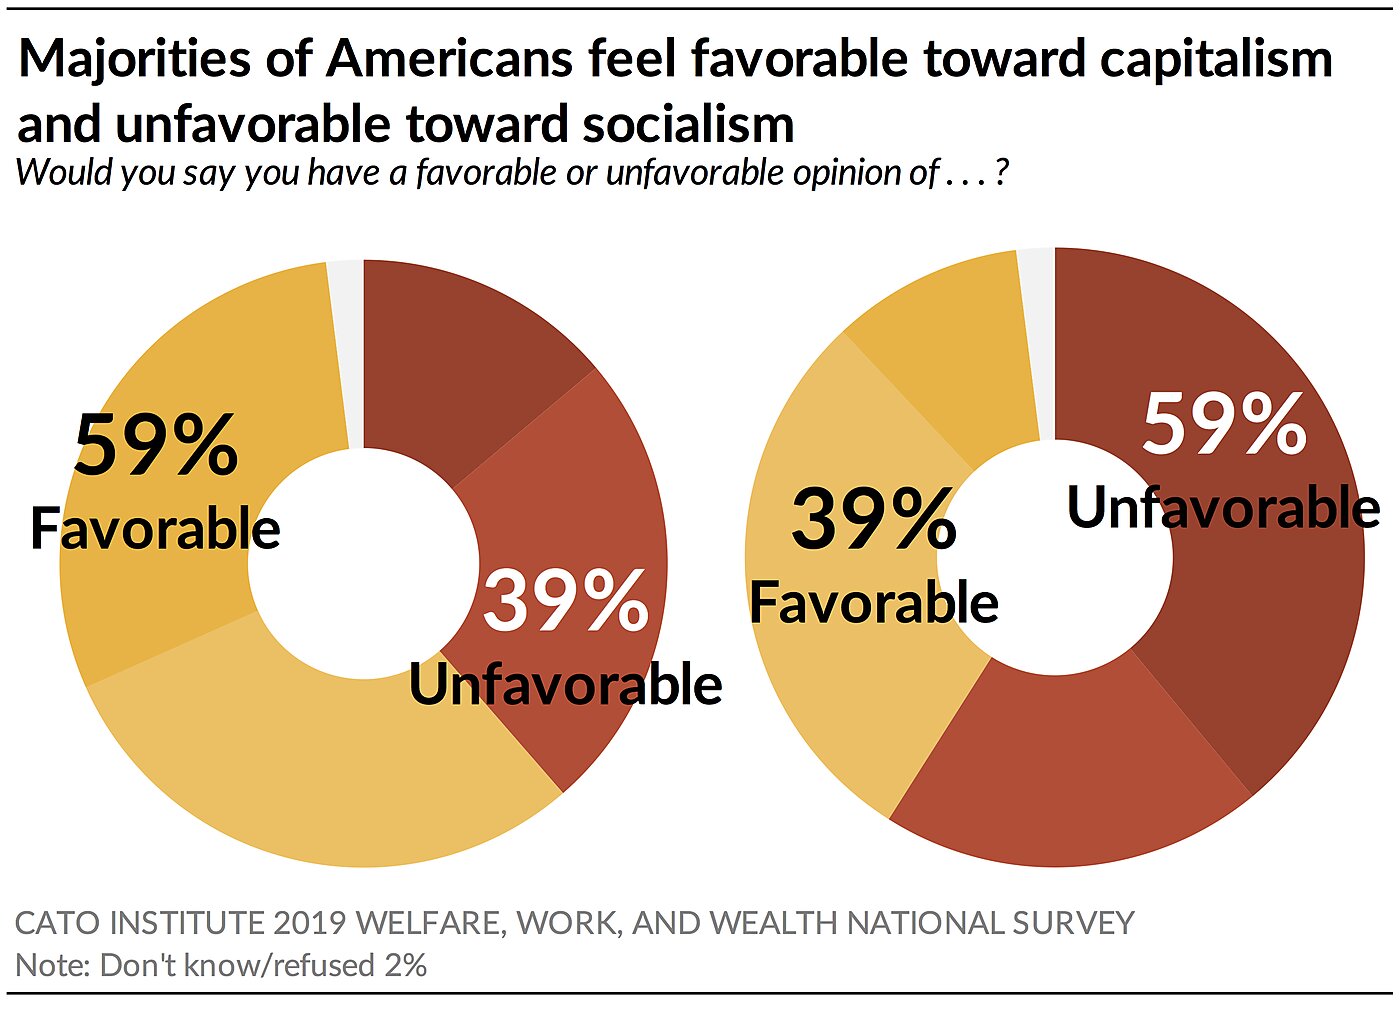
59% of Americans Have Favorable Views of Capitalism; 59% Have Unfavorable Views of Socialism
Most Americans continue to have positive views of capitalism and negative views of socialism: 59% have favorable views and 39% have unfavorable views of capitalism. In reverse, 39% have favorable views and 59% have unfavorable views of socialism.
84% of Americans Say “There’s Nothing Wrong with a Person Trying to Make as Much Money as They Honestly Can”
Americans don’t fault people for pursuing great wealth. More than 8 in 10 (84%) agree “there is nothing wrong with a person trying to make as much money as they honestly can.” This share has declined slightly since it was asked in 1958, when 95% of Americans agreed.1
Americans Support Raising Income Taxes on the Rich but Are Wary of Wealth Redistribution
- 61% favor raising taxes on families earning over $200,000 annually
- 53% favor raising top marginal tax rates to 70% on income above $10 million
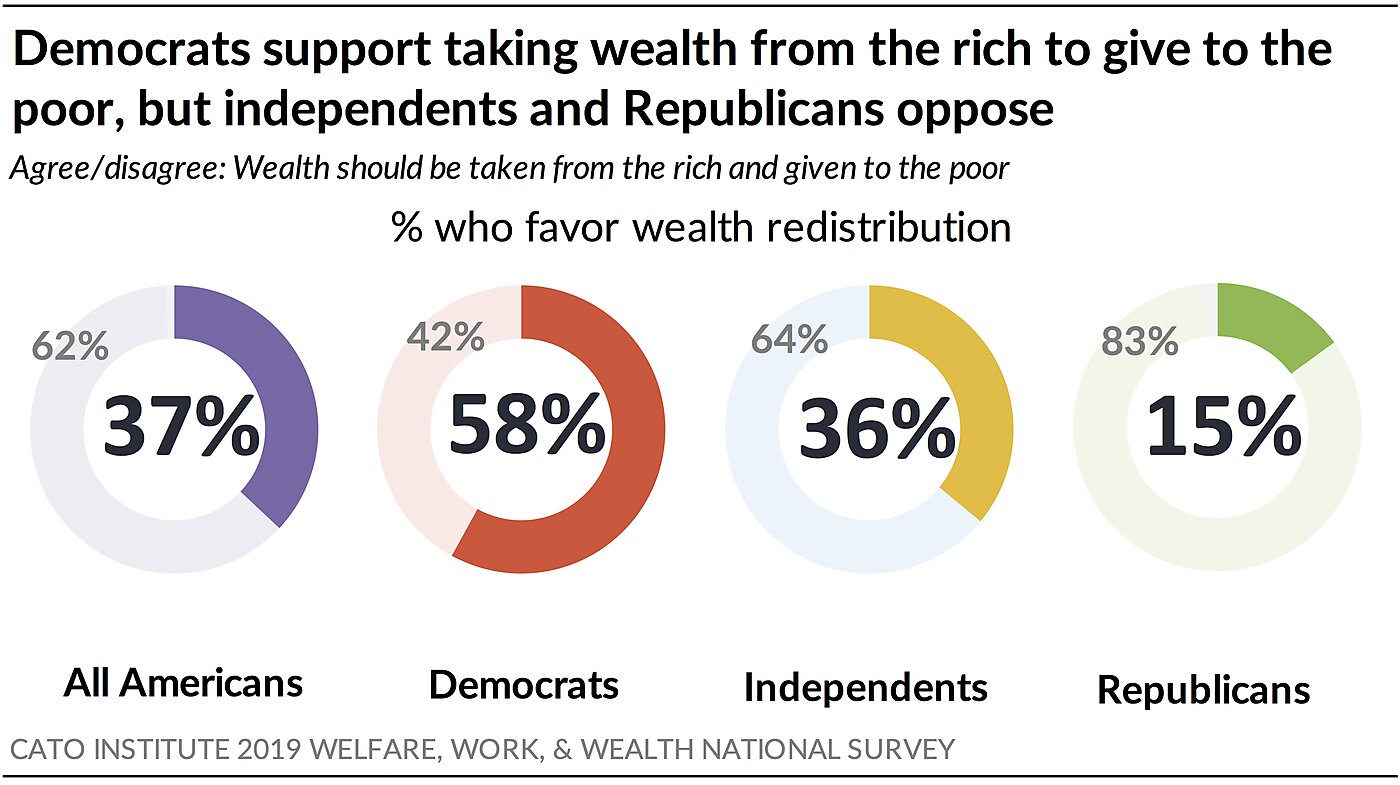
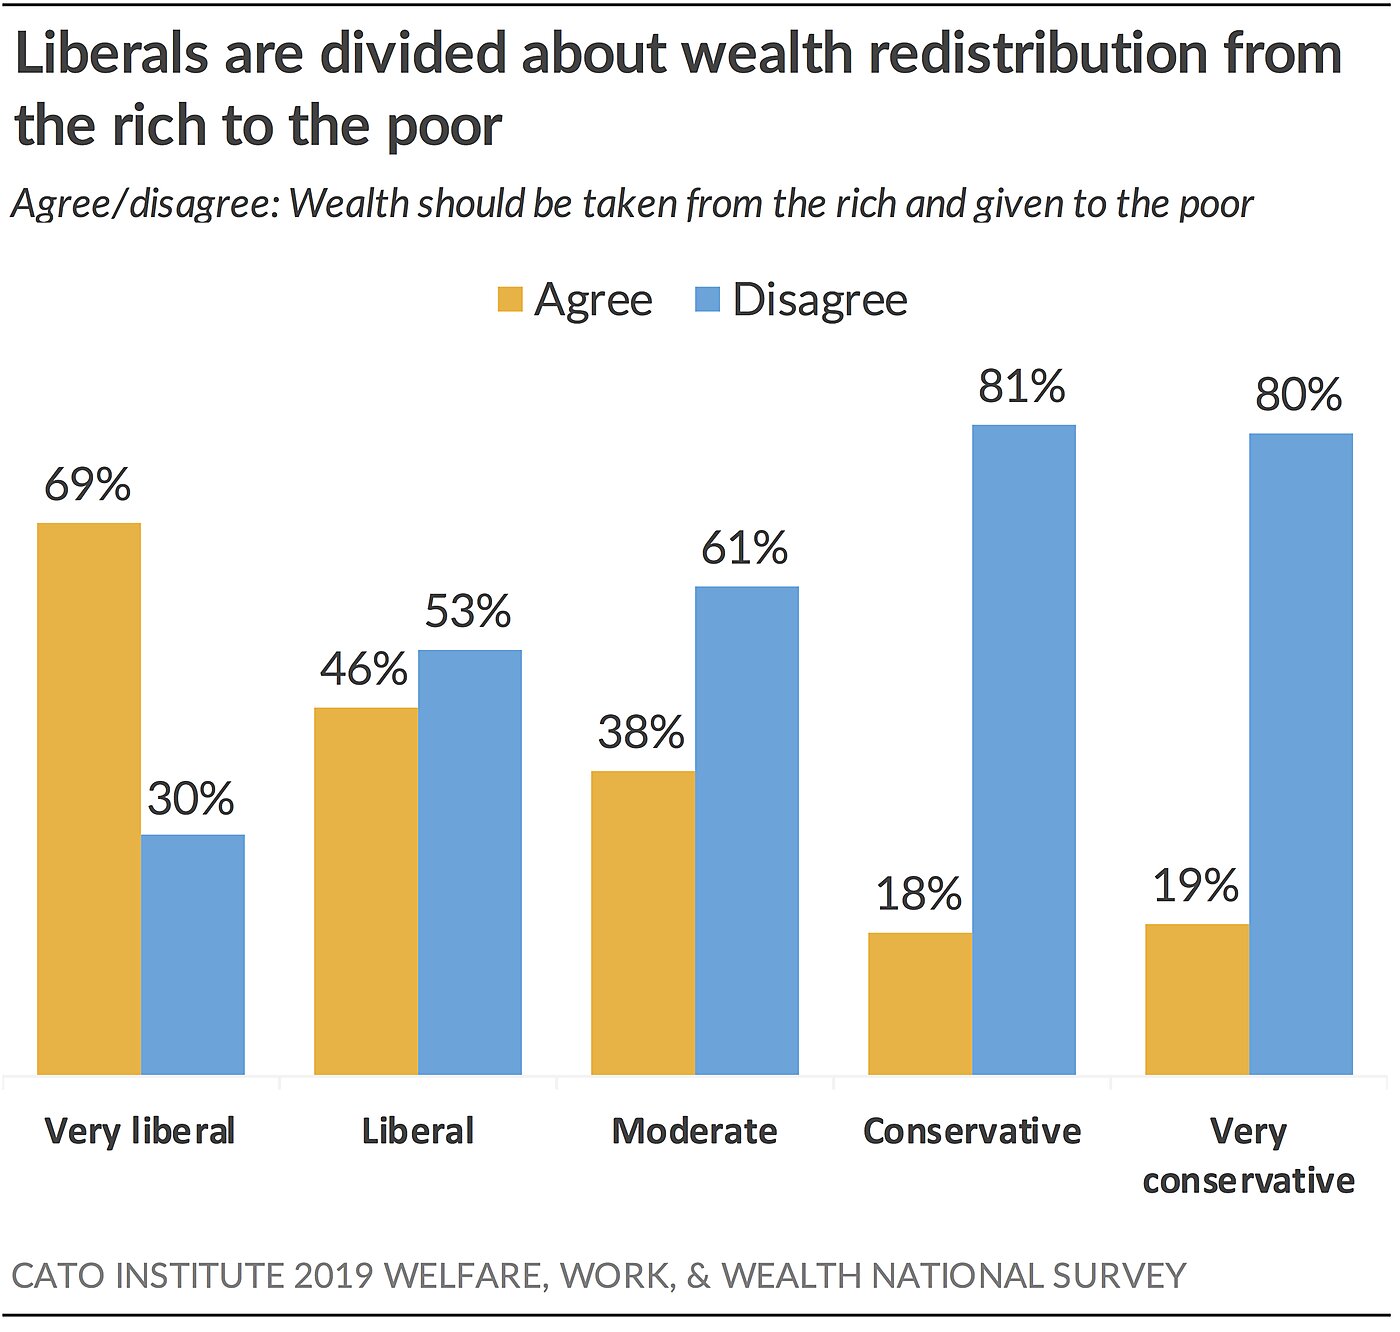
- 62% oppose redistributing wealth from the rich to the poor
Democrats favor raising taxes on incomes above $200,000 (81%), raising top marginal tax rates (75%), and redistributing wealth from the rich to the poor (58%). Republicans oppose all three: 62% oppose raising taxes on incomes above $200,000, 70% oppose raising top marginal tax rates, and 83% oppose redistributing wealth. Independents support raising the wealthy’s income taxes but do not support wealth redistribution.
Wealth redistribution divides the Democratic coalition. More than two-thirds (69%) of strong liberals agree that wealth should be redistributed from the rich to the poor, but 53% of moderate liberals disagree.
A majority (55%) of Americans 65 and over oppose raising top marginal rates on income to 70%. In contrast, 62% of Americans under 30 support raising top marginal rates.
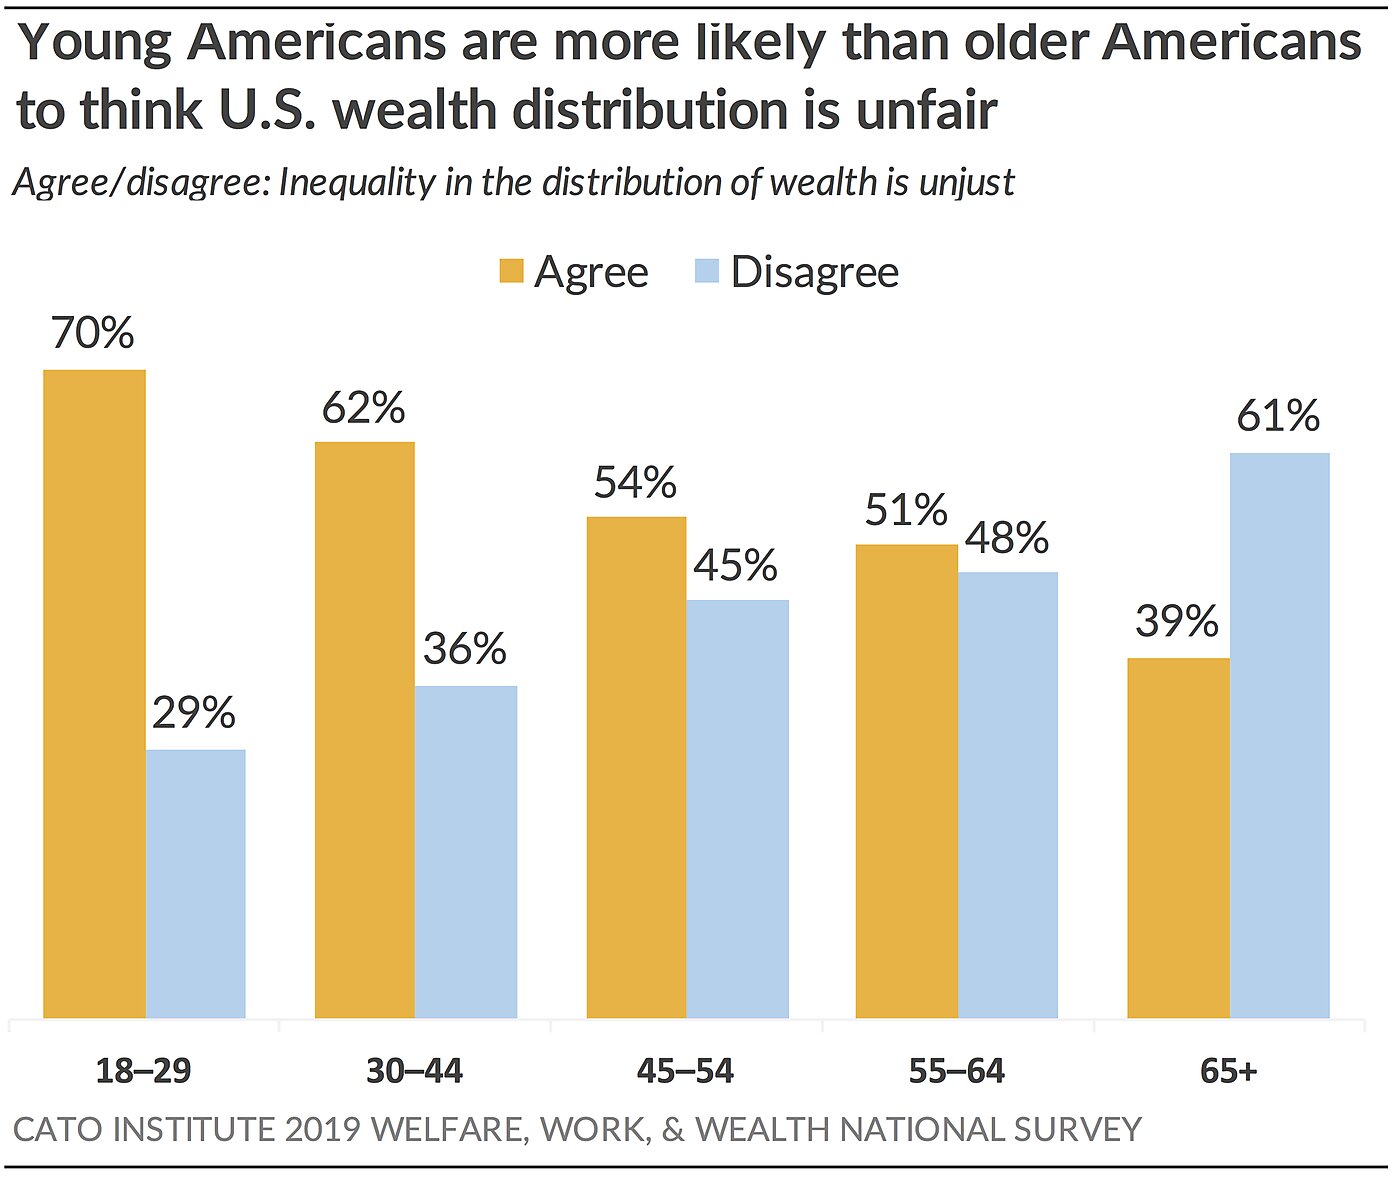
55% of Americans Believe the Distribution of Wealth in the U.S. Is Unfair
A majority (55%) of Americans believe that the wealth distribution in the United States is “unjust.” Majorities of Democrats (79%) and independents (55%) agree, but 67% of Republicans disagree. Americans 65 and over are the only age cohort with a majority (61%) who believe the distribution is fair. In contrast, Americans under 30 are the most likely to say it’s unjust (70%).
Resentment Better Predicts Attitudes toward Capitalism and Taxes Than Compassion; Both Resentment and Compassion Predict Support for Socialism
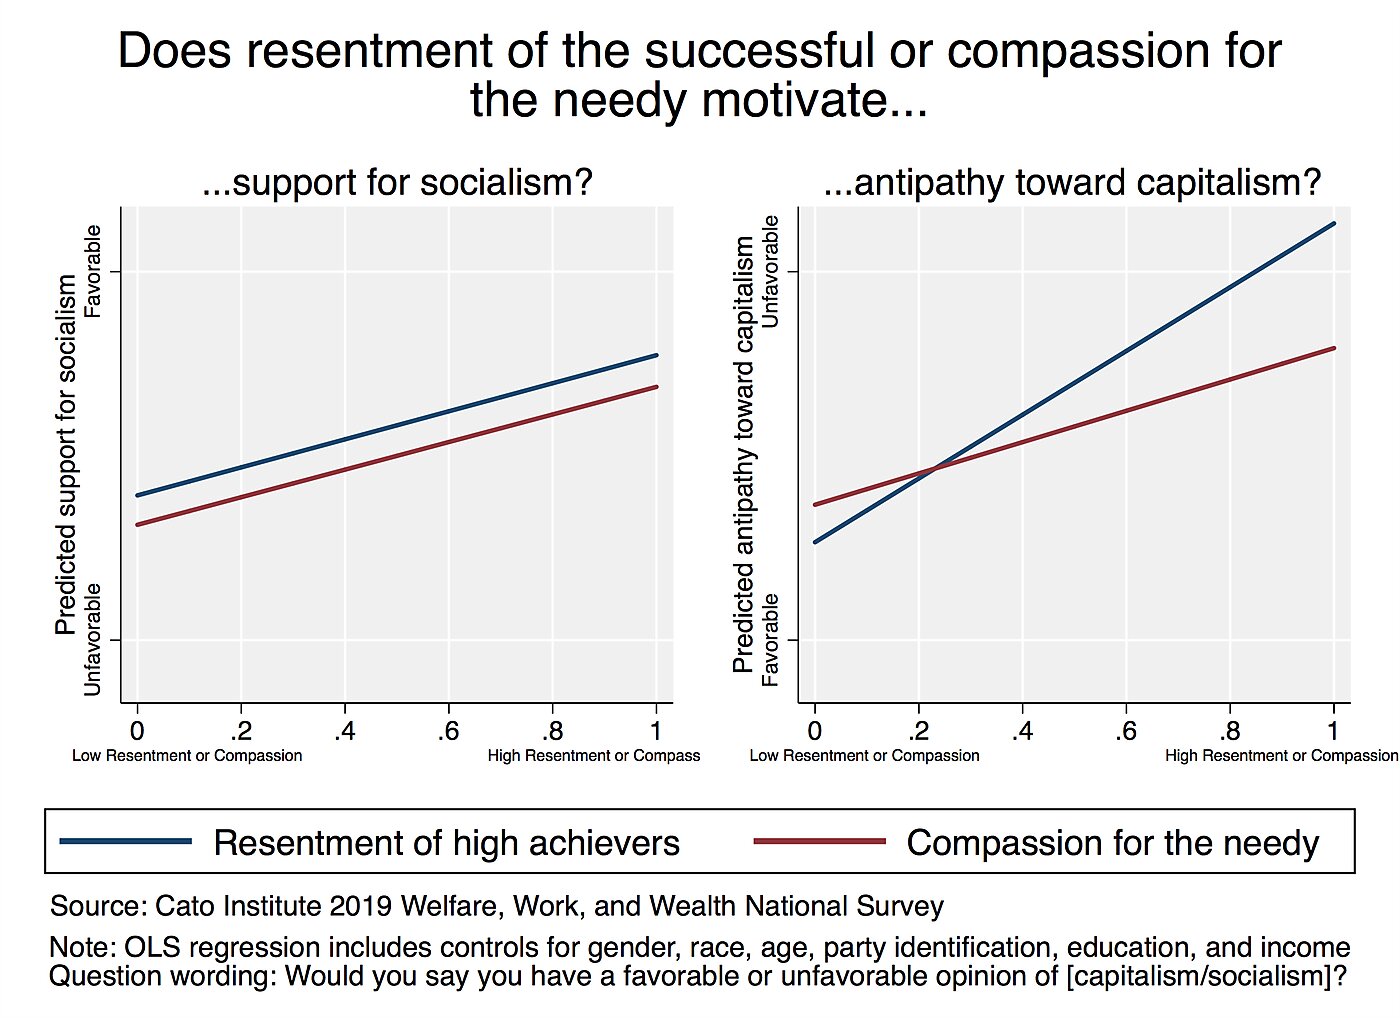
Statistical tests find that resentment of high achievers has about twice the impact as compassion for the needy in predicting hostility toward capitalism and support for raising taxes on the rich. However, compassion is a better predictor of support for increasing welfare benefits. Both resentment and compassion predict support for socialism.
Americans Believe the Rich Create Value for Society
Americans believe that the rich create value for society as they build up successful businesses that invent products and create value for customers. But Americans also believe that the rich do useful things with their wealth as investors.
- 69% agree billionaires “earned their wealth by creating value for others like inventing new technologies or starting businesses that improve people’s lives”
- 65% believe that “we are all better off when people get rich” because “they invest their money in new businesses that create jobs and new technology”
Americans Admire the Rich But Say People Admire the Rich Too Much
- 71% say they feel more “admiration” than “resentment” toward the rich, while 28% feel more “resentment”
- 75% say people admire rich people “too much”
- 23% feel “angry” when they read or hear about rich people
Nearly three-fourths (71%) of Americans admire more than resent the rich. But people also believe this admiration can be taken to excess. A similar share (75%) believe that their fellow Americans admire the rich “too much.” Few people (23%) say they go so far as to feel “angry” when they read or hear about rich people. The share who feel anger nearly doubles to 41% among strong liberals and rises to 53% among those most favorable toward socialism.
Attitudes toward the Rich Divide the Democratic Coalition
Moderate Democrats like the rich more than liberal Democrats do. Moderate Democrats are about 10–20 points more likely than liberal Democrats to:
- feel more “admiration” than “resentment” toward the rich (65% vs. 48%)
- believe the rich earned their wealth by creating value for society (64%) vs. 48%)
- agree “we are all better off when people get rich” because they invest in new businesses and technology (58% vs. 41%)
- strongly agree there’s nothing wrong with making as much money as possible (50% vs. 38%)
Liberal Democrats are more likely than moderate Democrats to have favorable views of socialism (74% vs. 49%), to believe that billionaires are a threat to democracy (58% vs. 49%), and to strongly agree that people admire the rich too much (51% vs. 36%).
Americans Don’t Think Billionaires Are Immoral or Threaten Democracy; Democrats Worry the Rich Undermine Democracy
- 82% of Americans think people “should be allowed to become billionaires”
- 75% don’t believe it’s “immoral for society to allow people to become billionaires”
Three-fourths (75%) of Americans disagree that “it’s immoral for society to allow people to become billionaires.” About a quarter (23%) agree it is immoral. This is a popular idea in socialist circles. The share of people who believe billionaire creation is immoral rises to 65% among those most favorable toward socialism.
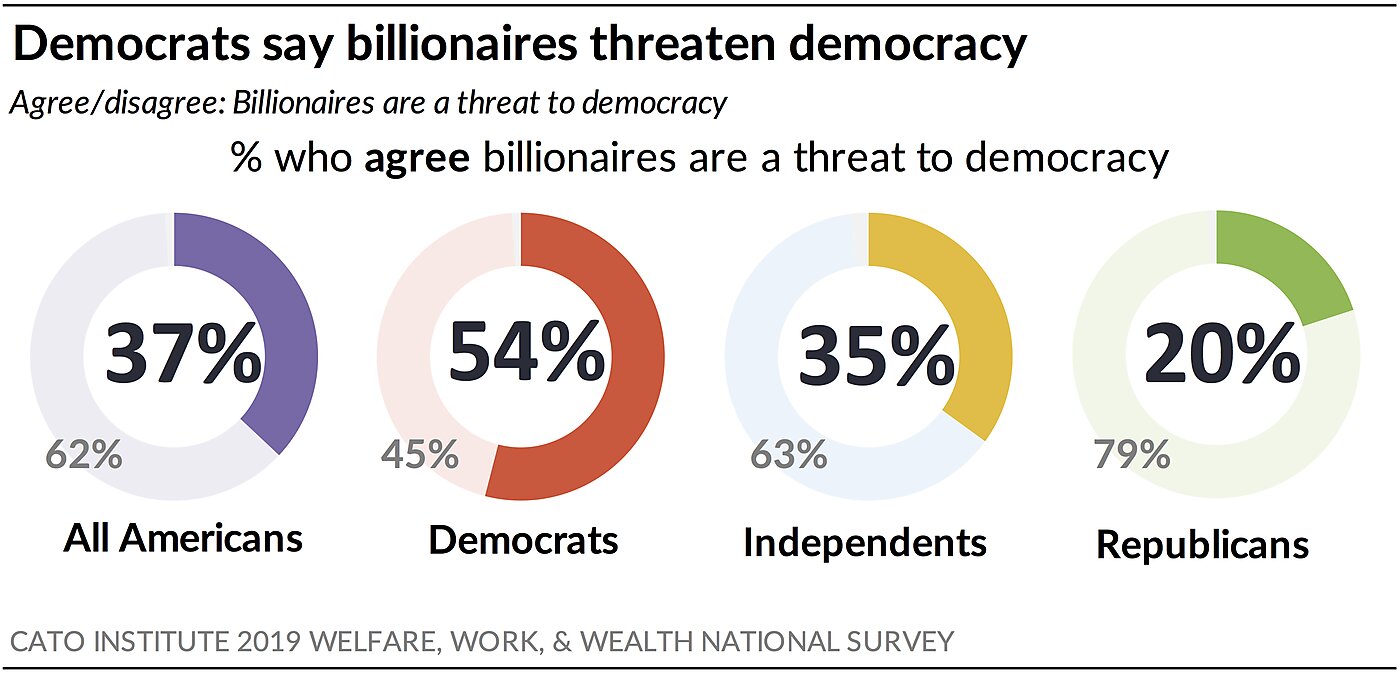
- 54% of Democrats agree that “billionaires are a threat to democracy”
Nearly two-thirds (62%) of Americans disagree that billionaires are a “threat to democracy.” Almost 4 in 10 (37%) think billionaires pose a threat. However, a majority of Democrats (54%) believe billionaires do threaten democracy. In contrast, strong majorities of independents (63%) and Republicans (79%) don’t think the very rich threaten democratic institutions.
47% of Strong Socialist Sympathizers Say Violence against the Rich Is Sometimes Justified
About a fifth (17%) of Americans agree that “citizens taking violent action against the rich” is sometimes justified; 82% say it’s never justified. More than a third of strong liberals (36%) and Americans under 30 (35%) and nearly half (47%) of those who have very favorable attitudes toward socialism say violent action against the rich is sometimes justified.
Americans under 30 Feel More Resentment toward the Rich, Are More Supportive of Socialism and Taxing the Rich
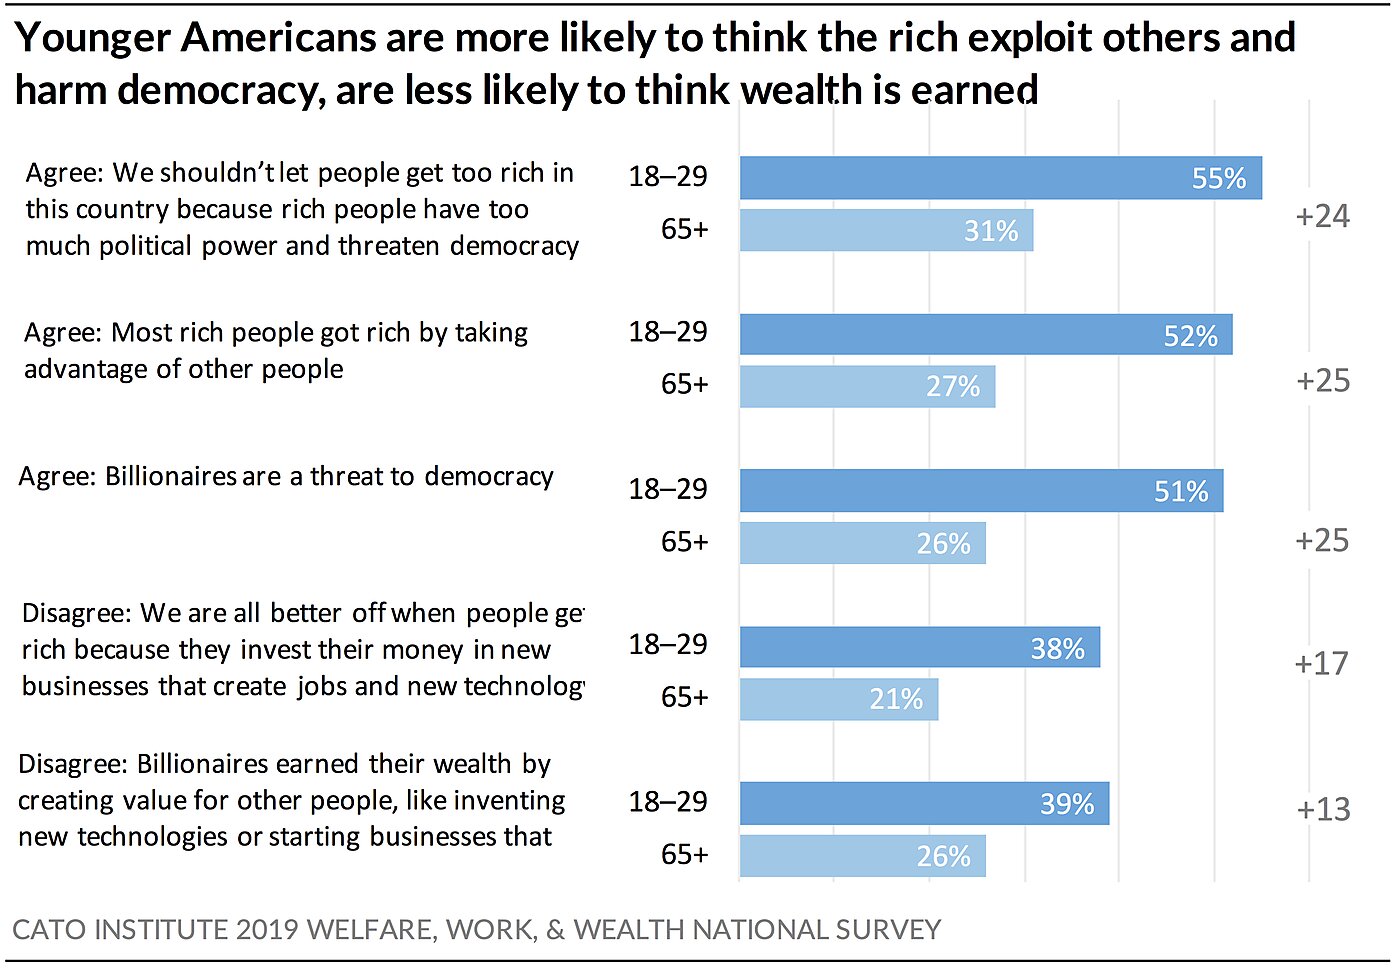
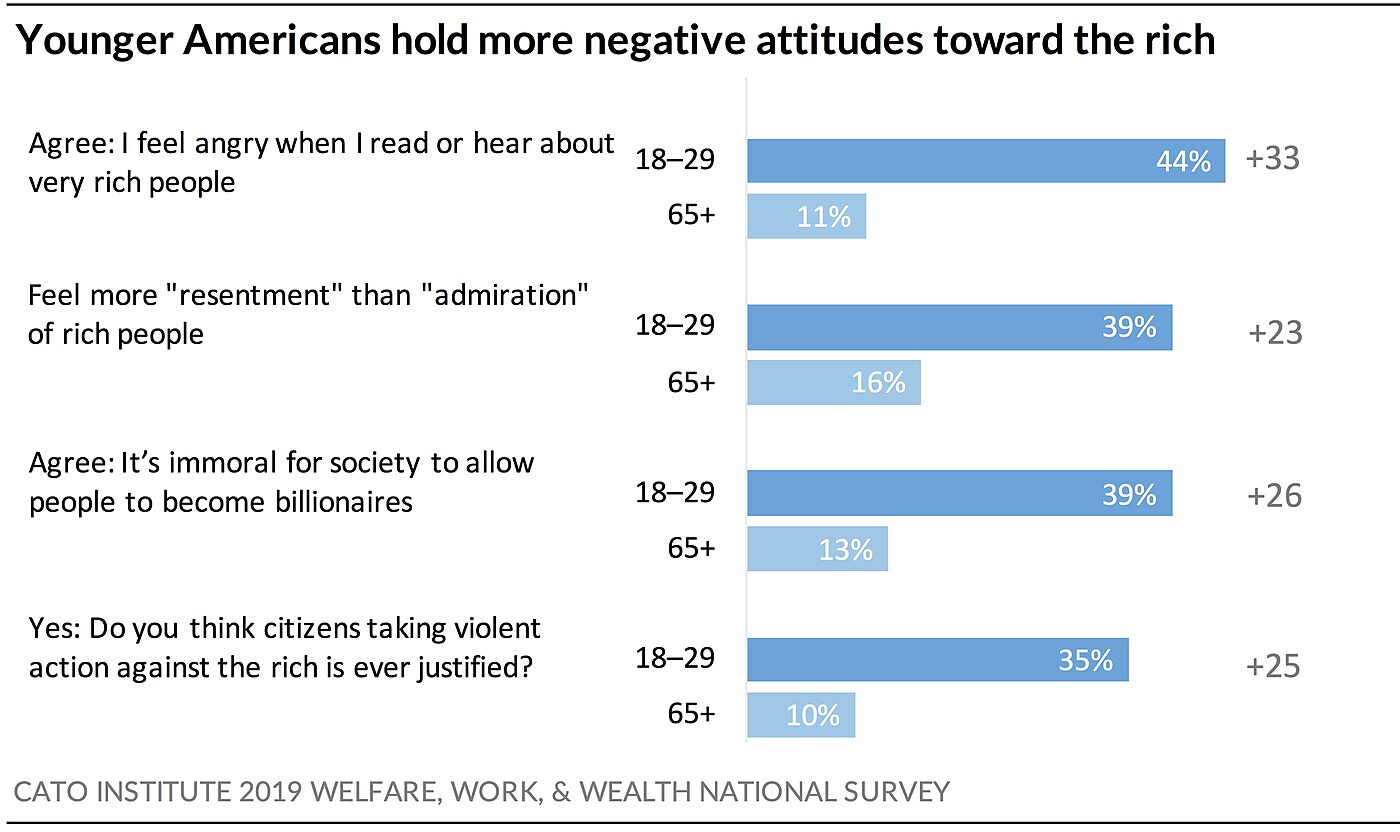
Across the board, young Americans are more likely than older Americans to hold negative attitudes toward the rich. People under 30 are about 20–30 points more likely than Americans 65 and over to:
- believe the rich got rich by “taking advantage of other people” (52% vs. 27%)
- believe billionaires are a threat to democracy (51% vs. 26%)
- feel “angry” when they read or hear about rich people (44% vs. 11%)
- believe it’s “immoral” for society to allow people to become billionaires (39% vs. 13%)
- believe that citizens taking violent action against the rich may be justified (35% vs. 10%)
- support redistributing wealth from the rich to the poor (53% vs. 20%)
- support raising top marginal tax rates (62% vs. 43%)
Young Americans are about equally favorable toward socialism (50%) and capitalism (49%). In stark contrast, Americans 65 and over solidly prefer capitalism (76%) to socialism (34%).
Americans under 30 are the only age cohort with a majority (53%) in favor of redistributing wealth from the rich to the poor. In contrast, only 20% of Americans 65 and over agree. Young people are also about 20 points more likely than seniors to support returning top marginal tax rates to 70% (62% vs. 43%).
But young people today may not be unique. A 1978 General Social Survey found that Americans under 30 at that time were also the only cohort with a majority (54%) in favor of government reducing income differences between the rich and the poor, while only 36% of Americans 65 and over agreed.
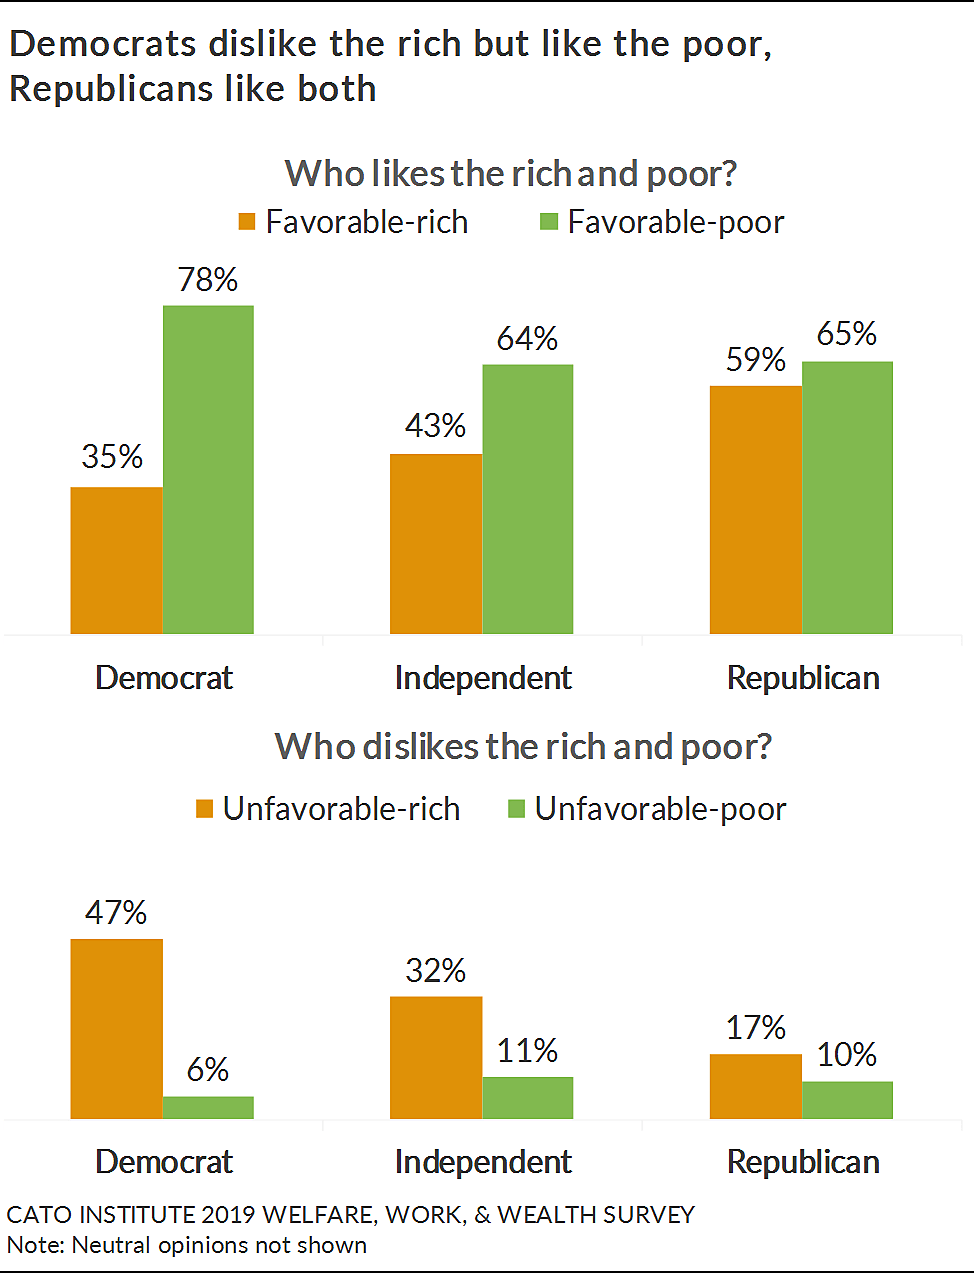
Republicans Like the Rich and Poor Equally; Democrats Favor the Poor but Resent the Rich
Republicans have similarly favorable views of both the rich (59%) and the poor (65%). Democrats, however, prefer the poor over the rich. Only a third (35%) of Democrats have favorable views of the rich, while a plurality (47%) have negative views of them. In stark contrast, 78% of Democrats have favorable views of the poor.

Vast Majority of Americans Are Skeptical of Government Efforts to Fight Poverty
- 77% say government efforts to fight poverty have been “ineffective”
- 60% don’t think welfare programs are designed to lift people out of poverty
- 68% of Republicans believe welfare creates dependency; 71% of Democrats think welfare helps people get back on their feet
- 70% say government should try to eliminate causes of poverty rather than increase welfare benefits
- 79% say economic growth will better help people climb out of poverty than more welfare spending
Although most Americans are skeptical of government efforts to fight poverty, only a minority (25%) favor cutting government food assistance. A plurality (41%) favor increasing it, and a third (33%) want to keep it the same.
72% of Americans Say Government Doesn’t Know Enough to Fix Poverty
Nearly three-fourths (72%) of Americans say that even if government were to “spend whatever is necessary” to eliminate poverty that it doesn’t “know enough” about how to actually accomplish that. This perception is post-partisan with majorities of Democrats (67%), Republicans (77%), and independents (73%) who are skeptical the government knows enough to fix poverty.
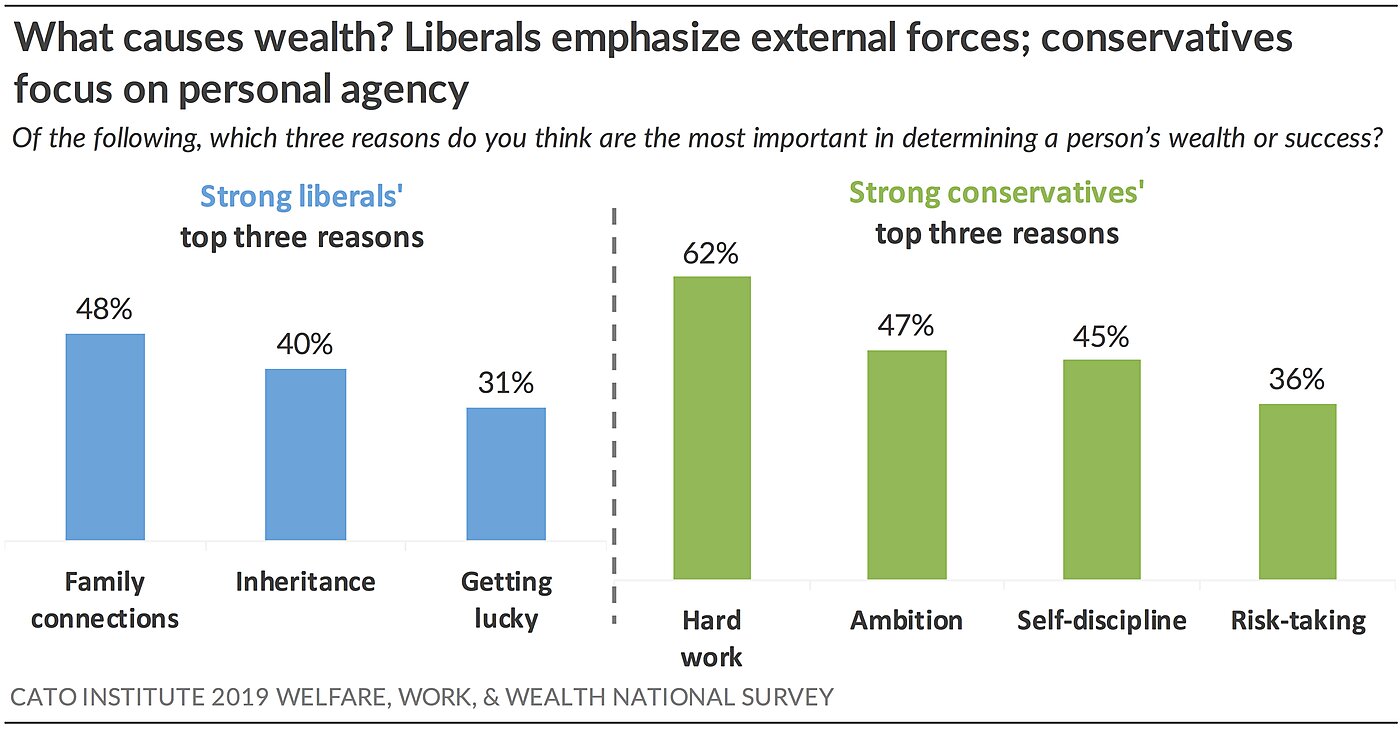
Liberals Say Wealth and Poverty Are Primarily Due to Chance; Conservatives Believe Wealth and Poverty Are Primarily Due to People’s Choices
- Strong liberals say the top drivers of wealth are family connections (48%), inheritance (40%), and getting lucky (31%)
- Strong conservatives say the top drivers of wealth are hard work (62%), ambition (47%), self-discipline (45%), and risk-taking (36%)
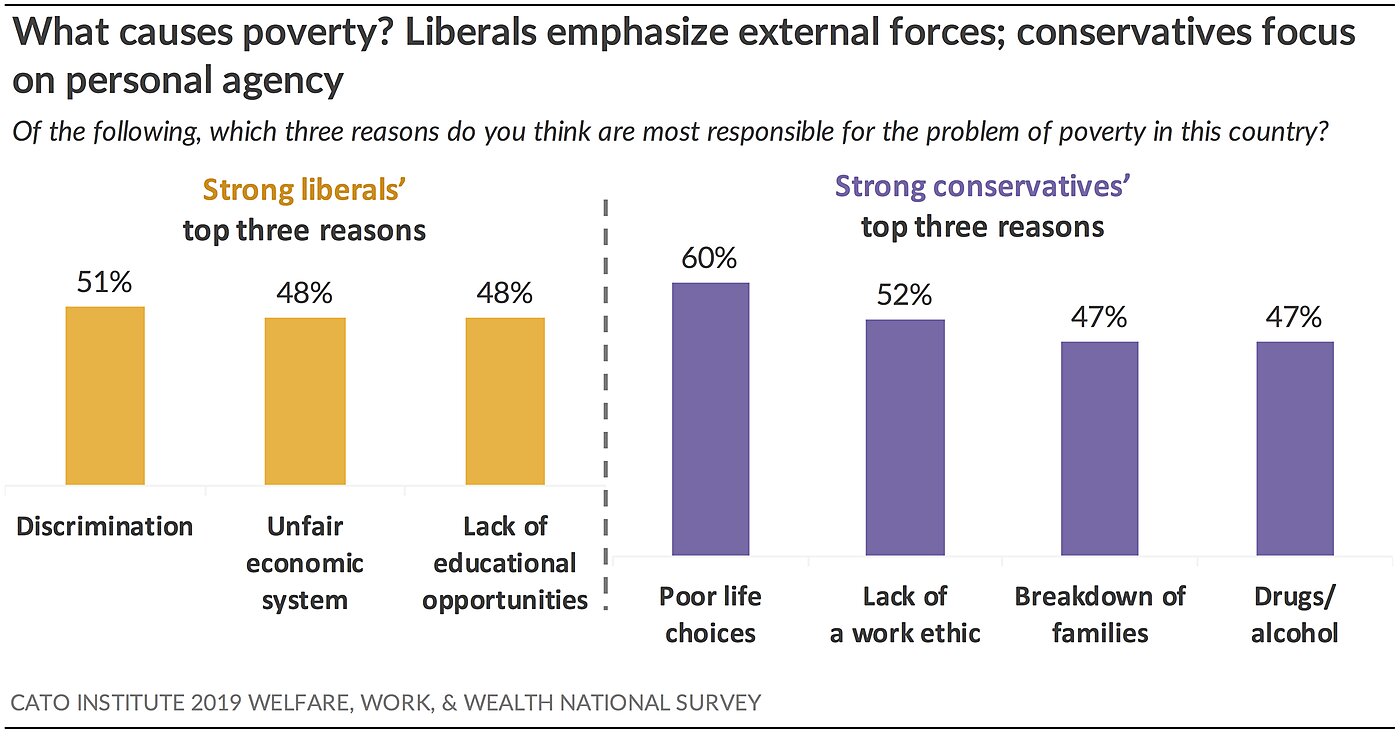
- Strong Liberals say the top causes of poverty are discrimination (51%), an unfair economic system (48%), and a lack of educational opportunities (48%)
- Strong Conservatives say the top causes of poverty are poor life choices (60%), a lack of work ethic (52%), breakdown of families (47%), and drugs and alcohol (47%)
Liberals tend to believe that people get rich by chance and that poverty is mainly the result of external forces that individuals cannot control. But conservatives tend to think that rich people earned their wealth through good personal decisions and that poverty is mainly the result of bad personal decisions. These differences in perception likely lead liberals and conservatives to reach different conclusions about how public policy should approach poverty, welfare, work, and wealth.
Key Hurdles for America’s Poor: Finding Affordable Housing and Good Jobs
- 53% of welfare recipients rate housing costs as “bad” in their neighborhoods
- 47% of welfare recipients rate the jobs market in neighborhood as “bad”
Low-income Americans receiving means-tested government financial assistance are far more likely than nonrecipients to rate the conditions in their neighborhoods as “bad” for accessing decent affordable housing (53% vs. 38%), moving up financially (53% vs. 33%), and finding good jobs (47% vs. 30%). Nearly 8 in 10 (78%) welfare recipients say the high cost of housing prevented them from moving to a better neighborhood.
Americans Say Housing Is Too Expensive, 59% Support New Construction in Their Own Neighborhoods
A majority (56%) of Americans say expensive housing costs prevented them from moving to a better location. Nearly half (44%) rate housing prices in their current neighborhoods as “bad.”
This may contribute toward the majority (59%) of Americans who support “building more houses, condos, and apartment buildings” in their community.
Majorities of Democrats (67%), independents (57%), and Republicans (52%) favor building more housing in their neighborhoods. But notably, only a slim majority of Republicans agree. Almost as many (46%) would oppose more construction in their metaphorical backyard.
55% of Americans Favor Decriminalizing Drug Offenses
Decriminalizing drugs would reduce the number of people who have difficulty finding employment because of a nonviolent drug offense. A majority (55%) of Americans favor recategorizing drug offenses from felonies to civil offenses so that the offenses would be treated as minor traffic violations rather than crimes. Forty-four percent (44%) oppose this proposal. Majorities of Democrats (69%) and independents (54%) support decriminalizing drug offenses. A majority of Republicans (59%), however, oppose.
45% of Welfare Recipients Say Lack of Occupational License Prevented Them or Someone They Know from Getting a Job They Were Capable of Doing
Nearly half, 45%, of current welfare recipients say the lack of an occupational license barred them or someone they know from getting a job they were capable of doing. This number declines to 29% among nonrecipients.
55% of Americans Would Prefer to Send Their Kids to Private School; 59% of Democrats Prefer Public School
About 90% of children in elementary and secondary schools attend public schools.2 But a majority (55%) of Americans would rather send their kids to a private school. Majorities of Latinos (57%), Whites (54%), and Blacks (51%) prefer that their kids receive an education from a private school.
A substantial minority (25%) of Americans rate their local public schools as “bad.” This share rises to 37% among low-income Americans currently receiving welfare benefits.
58% Favor Vouchers for K–12 Private School; African Americans, Republicans, and Low-Income Americans Are Most Supportive
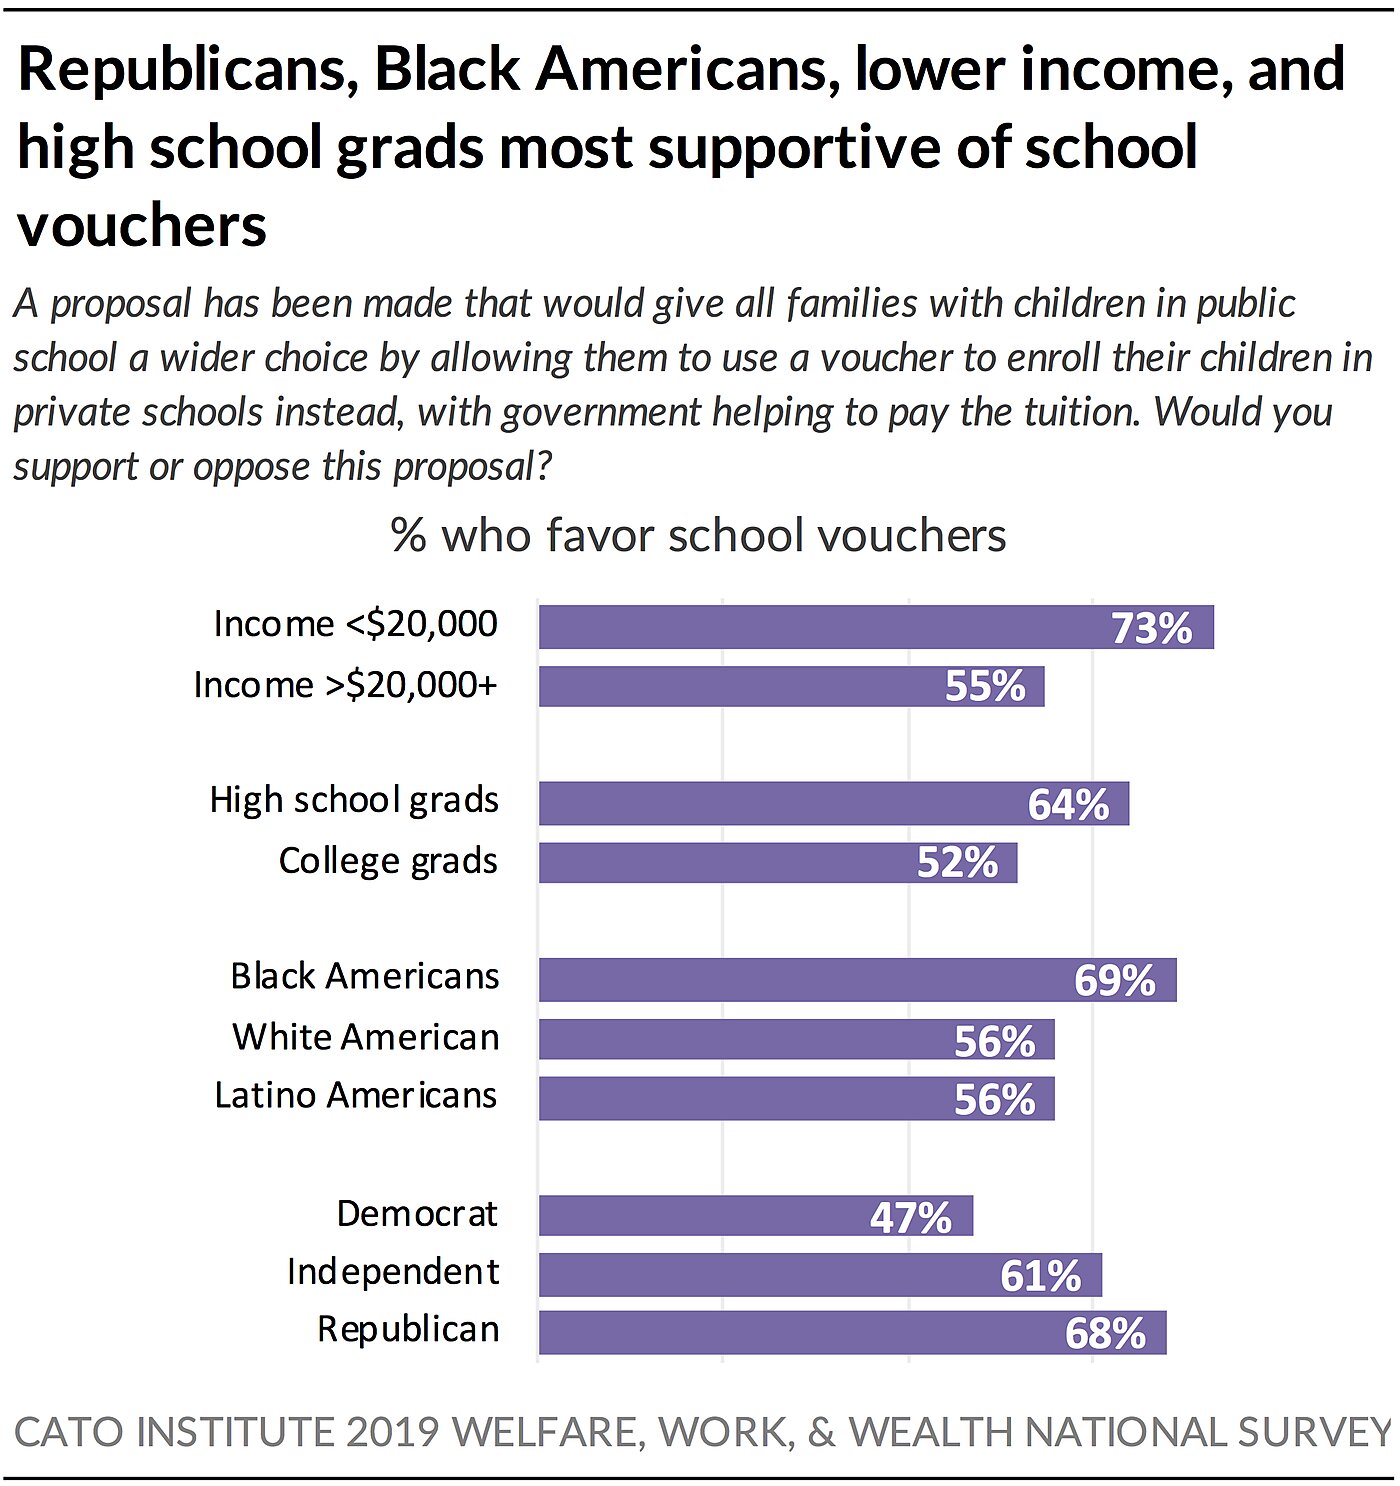
A solid majority (58%) of Americans favor a proposal that would allow parents of children in public school “to use a voucher to enroll their children in a private school” with “government helping to pay the tuition” while 40% oppose this.
African Americans (69%), Republicans (68%), households earning less than $20,000 annually (73%), and high school graduates without a college degree (64%) are much more supportive of school vouchers. Although majorities favor, White and Latino Americans (56%), college graduates (52%), and those with annual incomes above $20,000 (55%) are comparatively less likely to support school vouchers. Half (50%) of Democrats oppose and 47% favor them.
63% of Americans Were Worried They Couldn’t Pay Bills in Past Year
Nearly two-thirds (63%) report they were worried in the past year that their income wouldn’t cover their bills. This includes 21% who say they were unable to pay their bills, and 42% who were worried but ultimately covered their expenses. About a third (36%) say they weren’t worried about bills in the previous year.
80% of Americans Agree “Work Is Its Own Reward”
Eight in 10 Americans (80%) agree that “work is its own reward,” including 40% who strongly agree. Some Americans are more enthusiastic than others. Republicans (50%), seniors (50%), and weekly churchgoers (58%) are about 20 points more likely than Democrats (33%), Americans under 30 (31%), and nonchurchgoers (31%) to strongly agree work has inherent value.
Americans Who Value Work, Responsibility, and Personal Agency Find Most Meaning in Their Lives
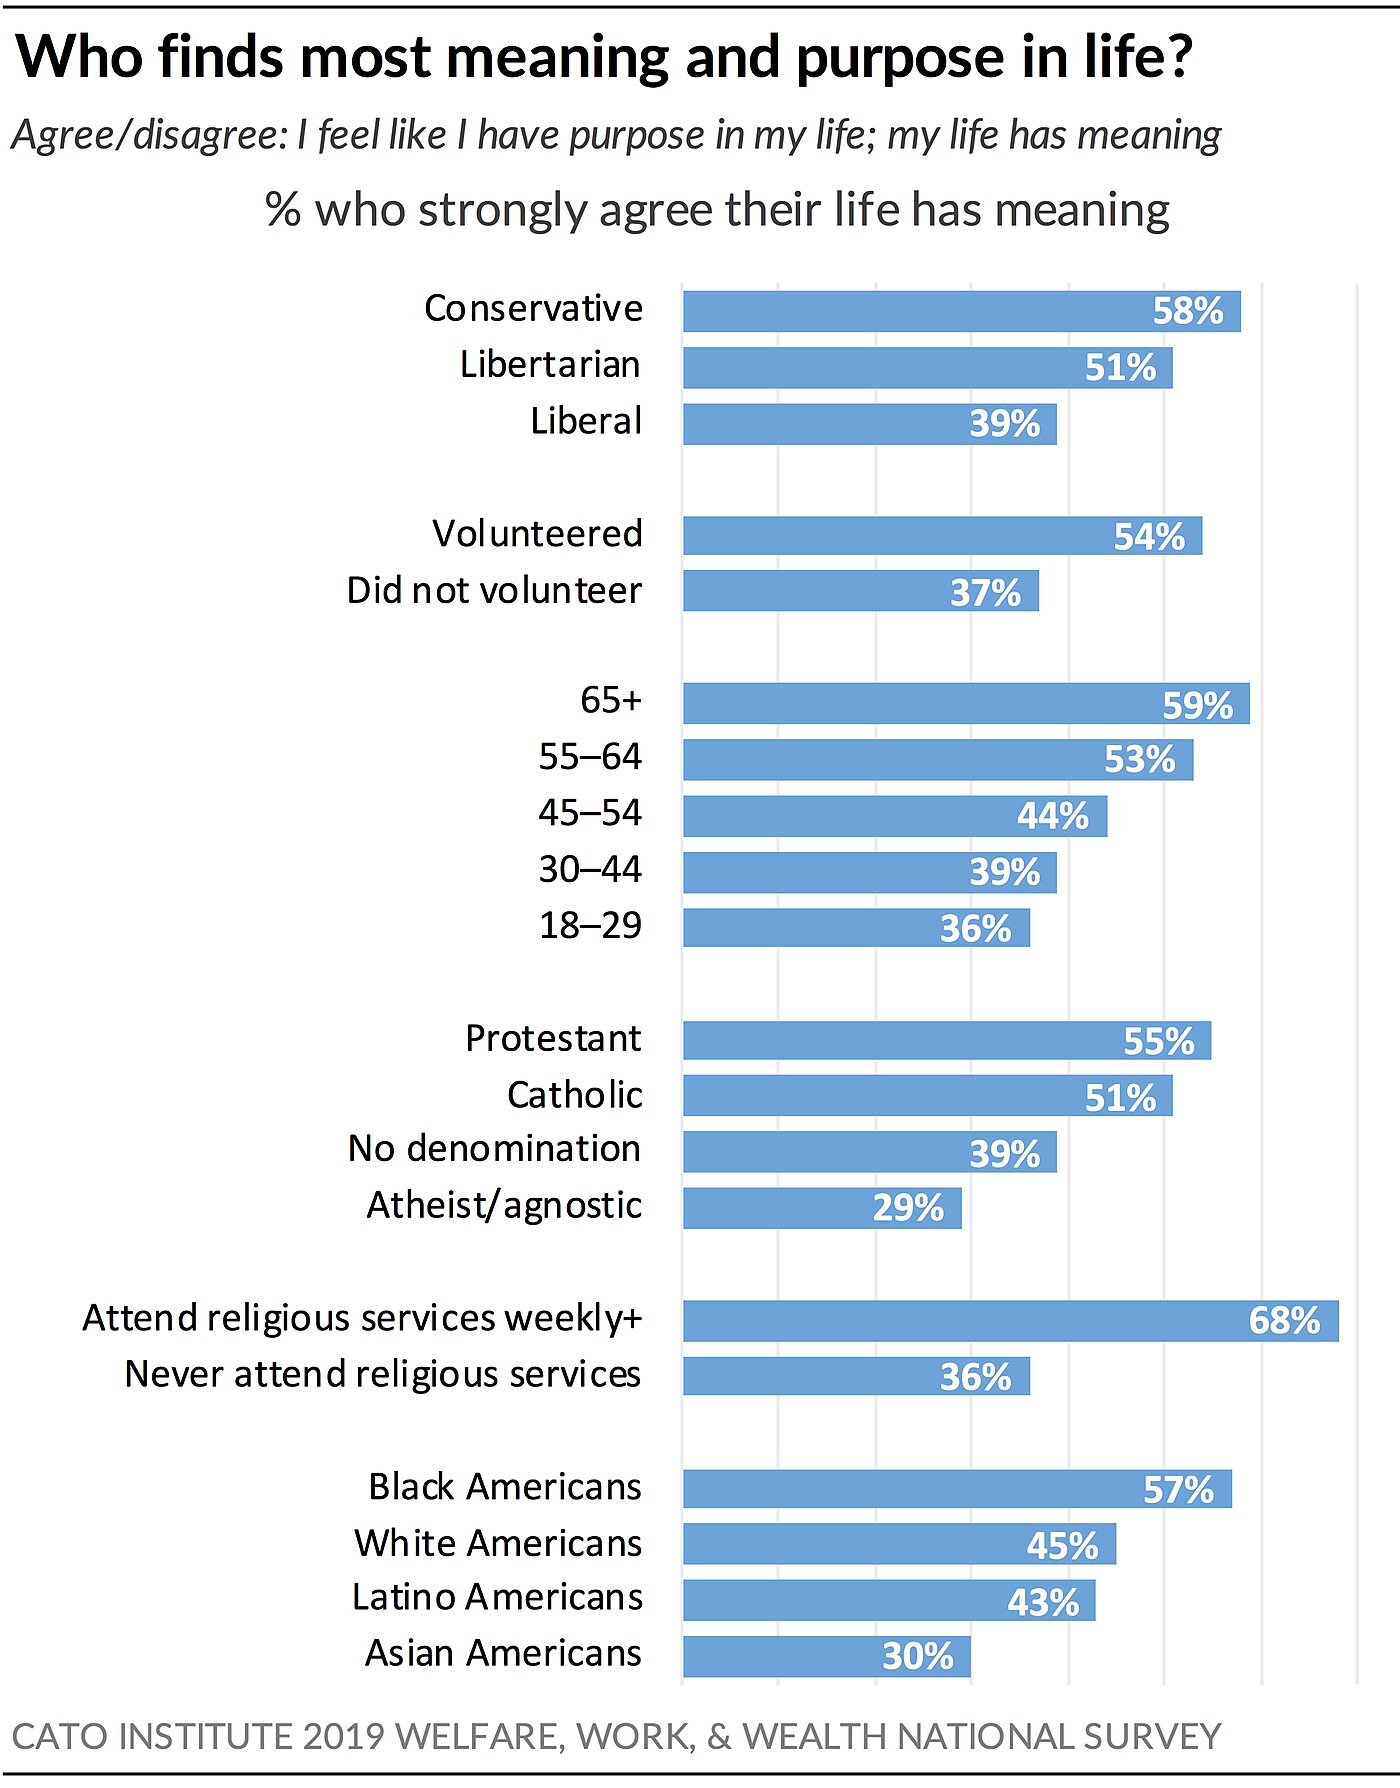
Eight in 10 (83%) Americans agree “I feel like I have purpose in my life; my life has meaning.” This includes a little less than half (46%) who strongly agree. Some types of people are more likely than others to feel their lives are imbued with meaning and purpose. This includes people who:
- strongly believe hard work is its own reward (74%)
- strongly believe they have personal agency (68%)
- strongly believe in personal responsibility (60%)
- are very compassionate (58%)
- are not very envious (70%) or resentful (63%)
Conservatives (58%) are more likely than liberals (39%) to strongly agree their lives have purpose and meaning. Very frequent churchgoers (68%), religious people, such as Protestants (55%) or Catholics (51%), seniors (59%), African Americans (57%), and volunteers (54%) are more likely to find meaning and purpose in their lives than nonvolunteers (37%), nonchurchgoers (36%), atheists or agnostics (29%), Americans under 30 (36%), or White (45%) or Latino (43%) Americans.
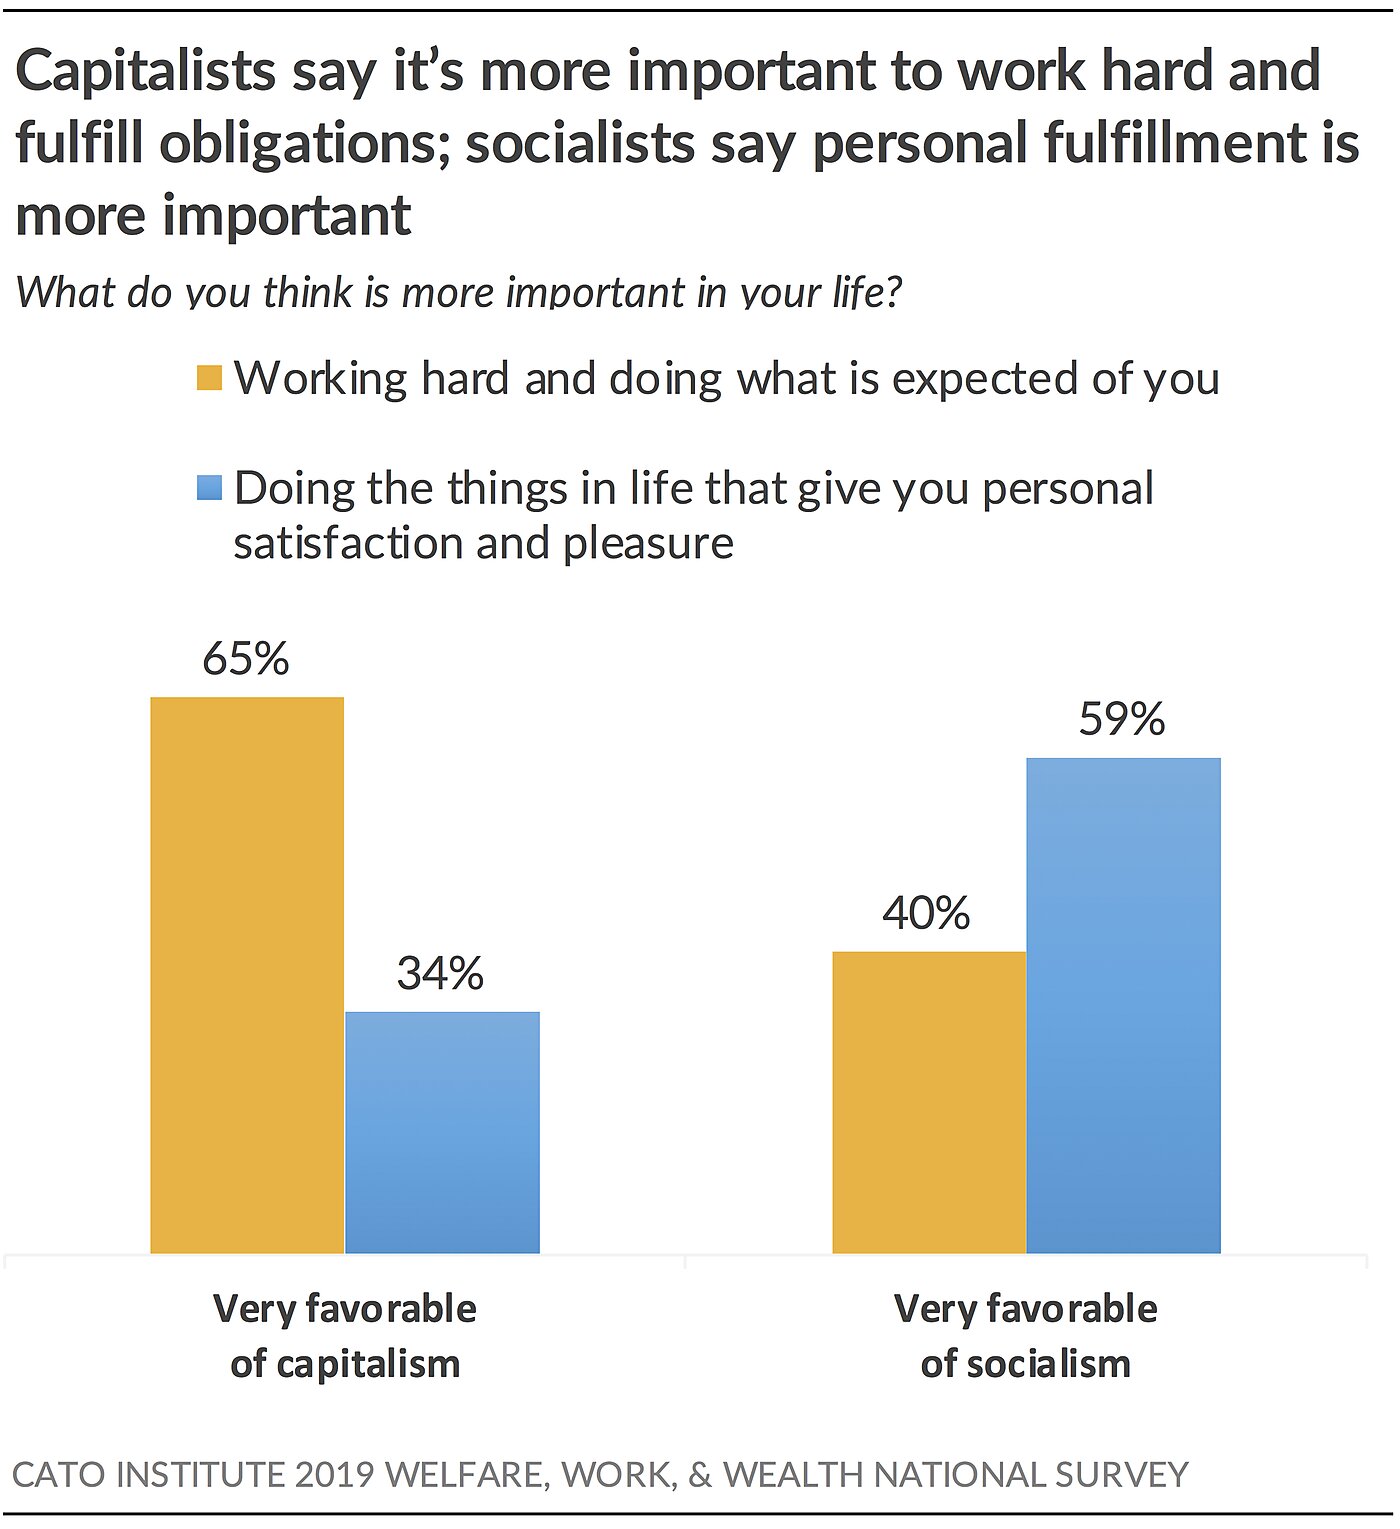
Democrats Say Seeking Personal Satisfaction Is More Important to Them; Republicans Say It’s Fulfilling Obligation
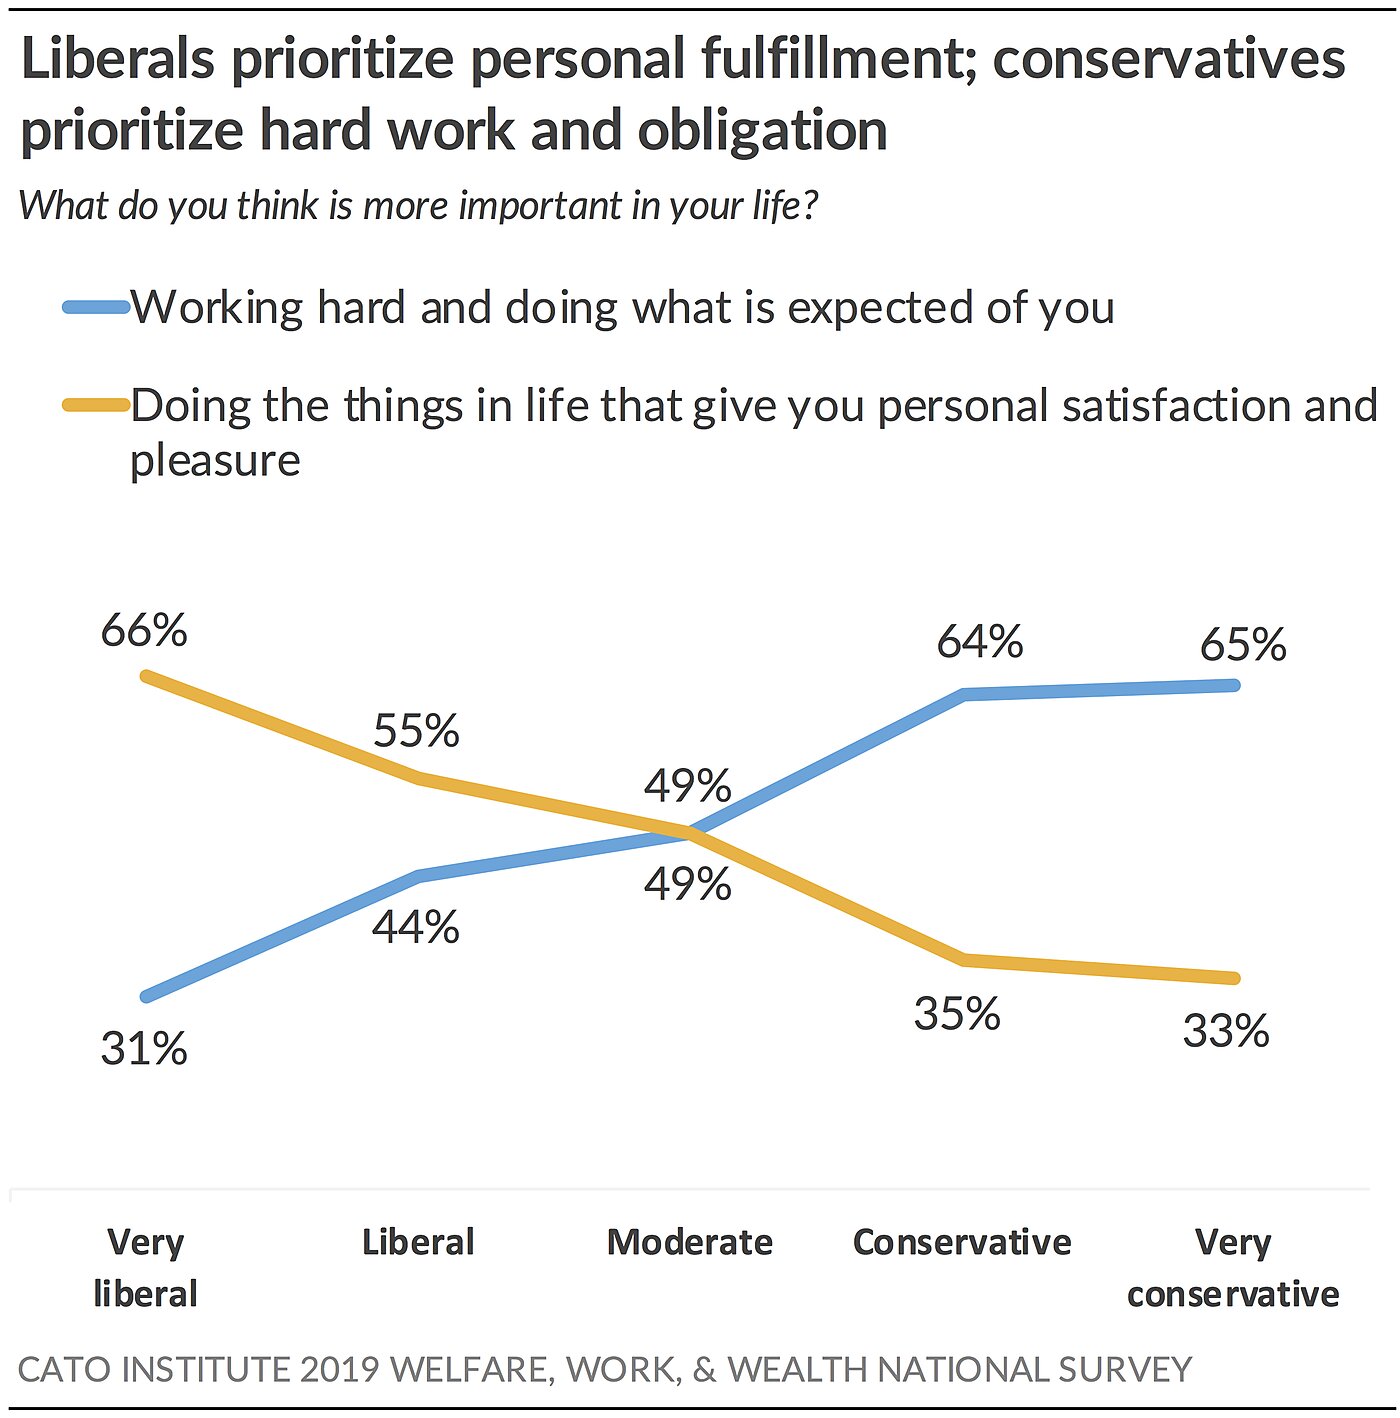
A slim majority (52%) of Americans say it’s more important to them personally to “work hard and do what is expected of you.” Nearly the same share (47%) alternatively say it’s more important to “do things in life that give you personal satisfaction and pleasure.” This question starkly divides partisans. Nearly two-thirds (65%) of Republicans say it’s more important to work hard and do what is expected of them. A solid majority (57%) of Democrats say it’s more important to do things in life that give them pleasure and personal satisfaction.
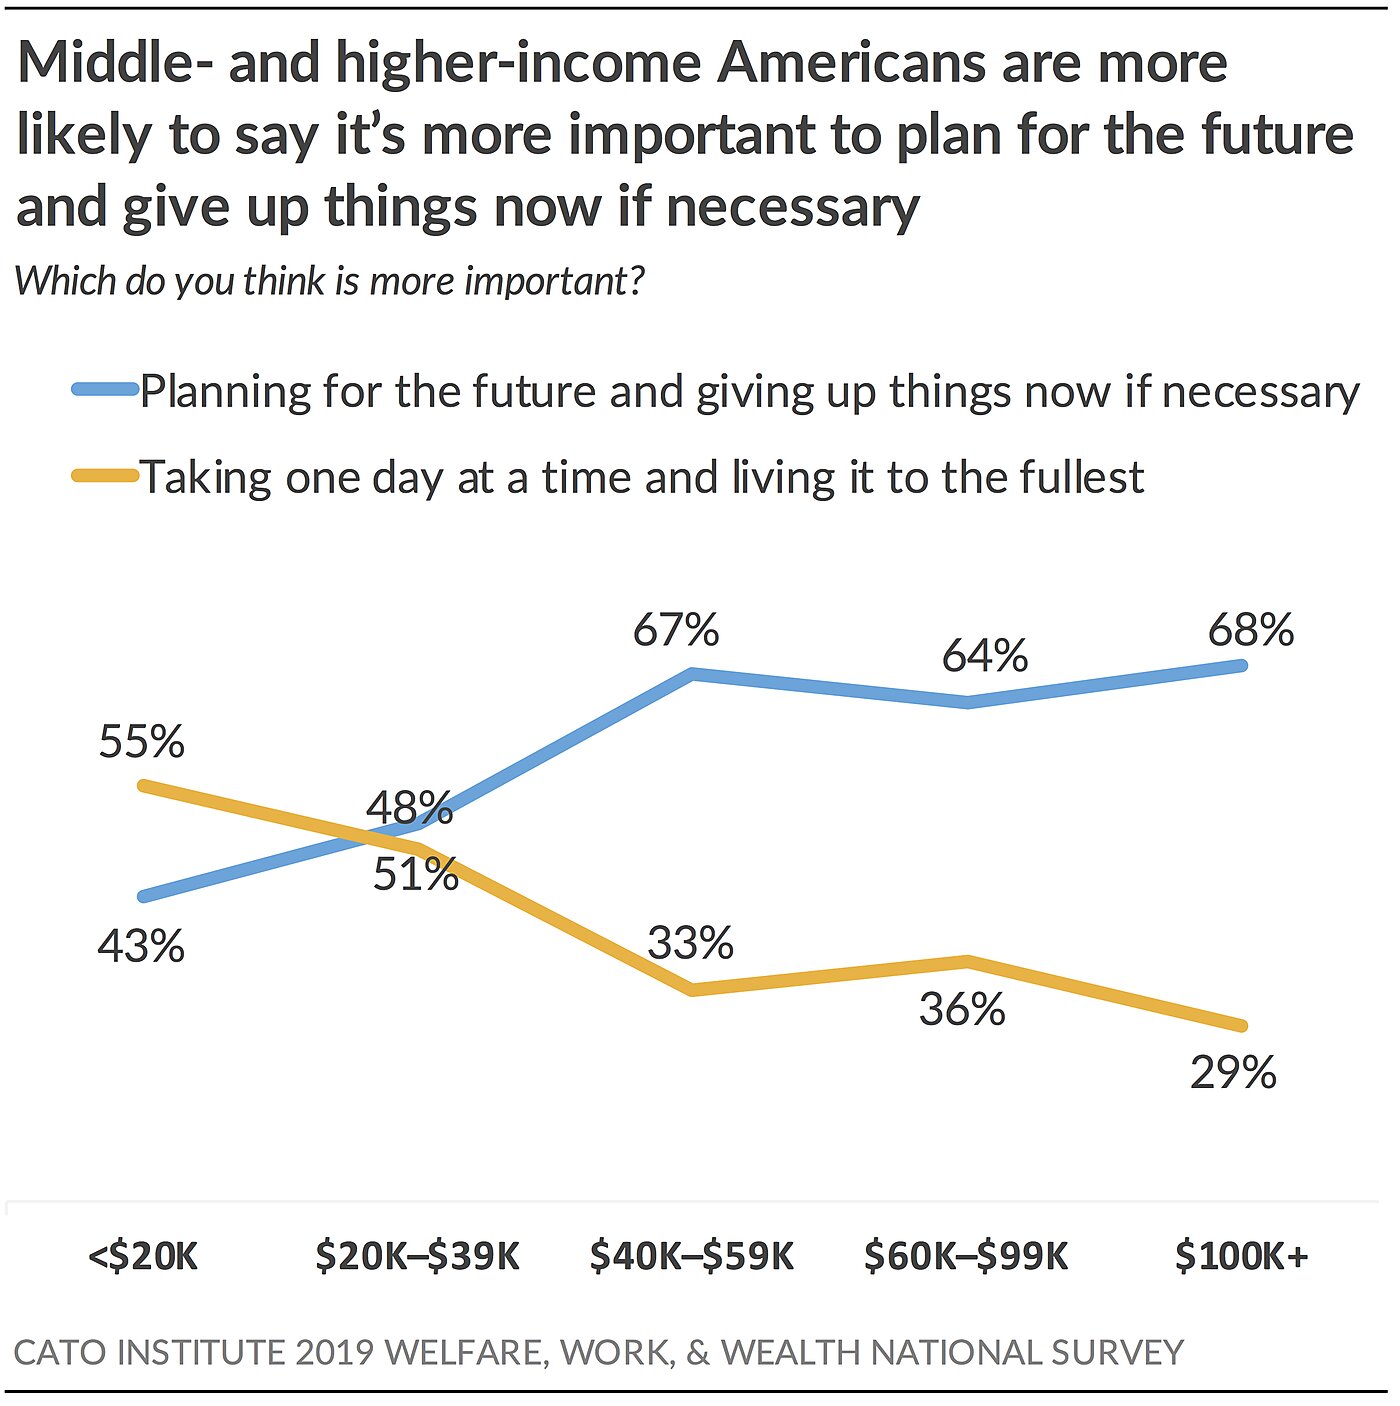
59% Say Planning for the Future Is More Important Than Living Today to the Fullest
Nearly 6 in 10 (59%) Americans say it’s more important to “plan for the future and give up things now if necessary,” while 40% say it’s more important to “take one day at a time and live life to the fullest.”
Attitudes differ by income. A majority (55%) of people earning less than $20,000 a year say it’s more important to take it one day at a time and live life to the fullest rather than give up things now to plan for the future. In contrast, 66% of Americans earning more than $40,000 annually say it’s more important to plan for the future and give up things now if necessary.
Attitudes about Wealth and Poverty
What Americans Think Cause Poverty and Wealth
Americans have complicated views about where wealth and poverty originate. On average, Americans tend to emphasize the role of personal choices and agency but also acknowledge the role of external forces beyond the control of the individual.
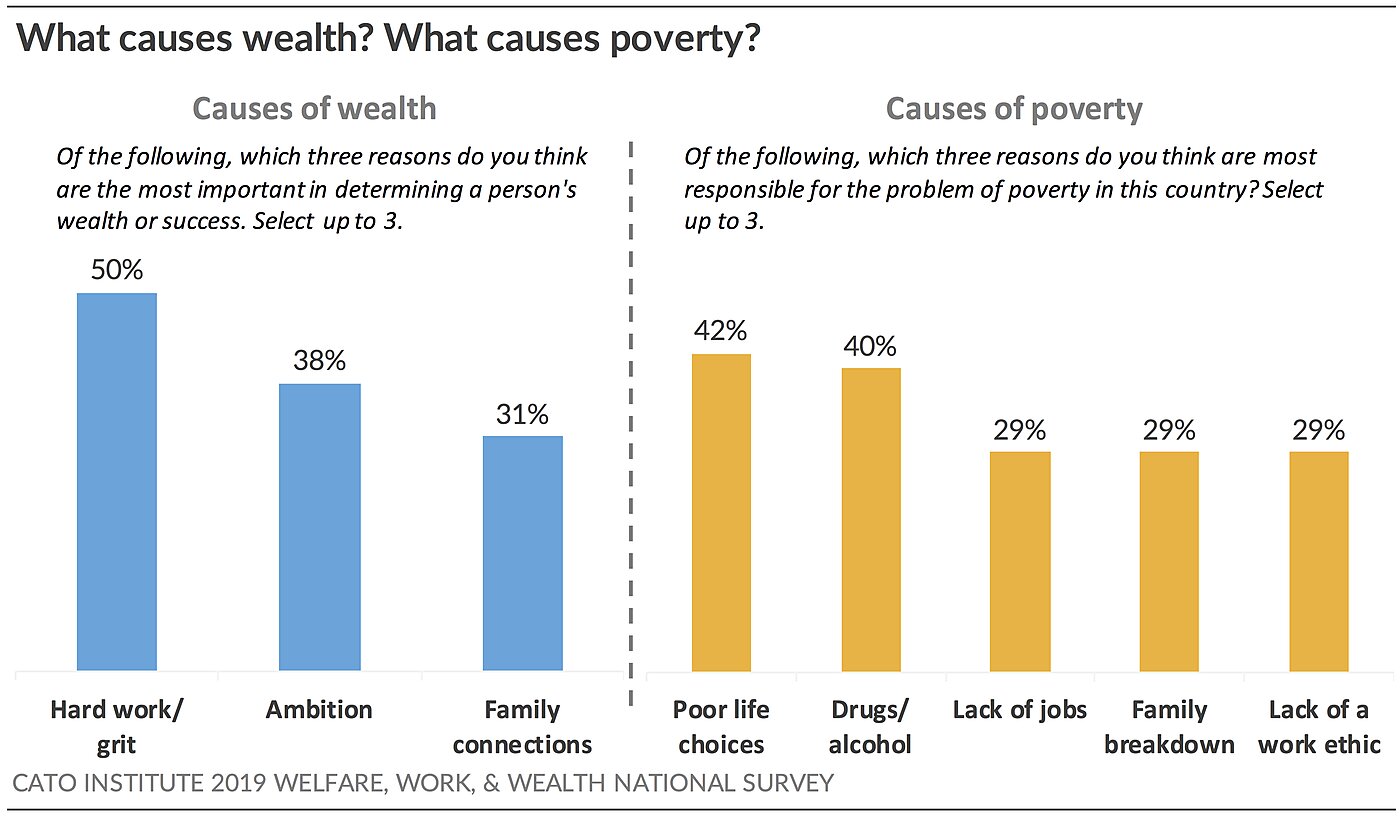
Americans Say Hard Work, Ambition, and Family Connections Drive Wealth
Americans believe the top three reasons most important for determining a person’s wealth and success are hard work and grit (50%), ambition (38%), and family connections (31%). Not far behind include a willingness to take risks (29%), education (27%), inheritance (27%), self-discipline (27%), luck (20%), natural intelligence (18%), race and gender (11%), and special favors from government (9%).
Overall, most Americans tend to believe that wealthy people gain their wealth through the choices they make, such as working hard and being ambitious. Fewer people tend to emphasize external forces responsible for people’s wealth, such as immutable traits like race, intelligence, or luck.
What Do the Rich Say Makes People Rich?
Households that earn $200,000 annually or more believe hard work (47%), ambition (32%), risk-taking (31%), self-discipline (30%), and education (30%) are the top reasons for a person’s wealth and success.
Income Americans regardless of income tend to rate hard work and grit as the top reason for wealth and success. People earning less than $20,000 annually (53%) are about as likely as those earning between $40,000 and $60,000 (49%) or over $100,000 a year (51%) to believe hard work is a top contributor to success.
Ideological Divide Liberals tend to believe that people get rich by getting lucky. But conservatives tend to think that rich people earned their wealth through good choices and grit.
When asked the top three reasons people become wealthy, strong liberals selected family connections (48%), inheritance (40%), and luck (31%). In contrast, strong conservatives selected hard work and grit (62%), ambition (47%), self-discipline (45%), and risk-taking (36%). Thus, conservatives’ views are more aligned with what higher-income people think leads to wealth and success.
Liberals largely believe that wealth comes from forces outside of a person’s control or agency. Conservatives, on the other hand, believe that wealth primarily results from the choices that people make with their agency.
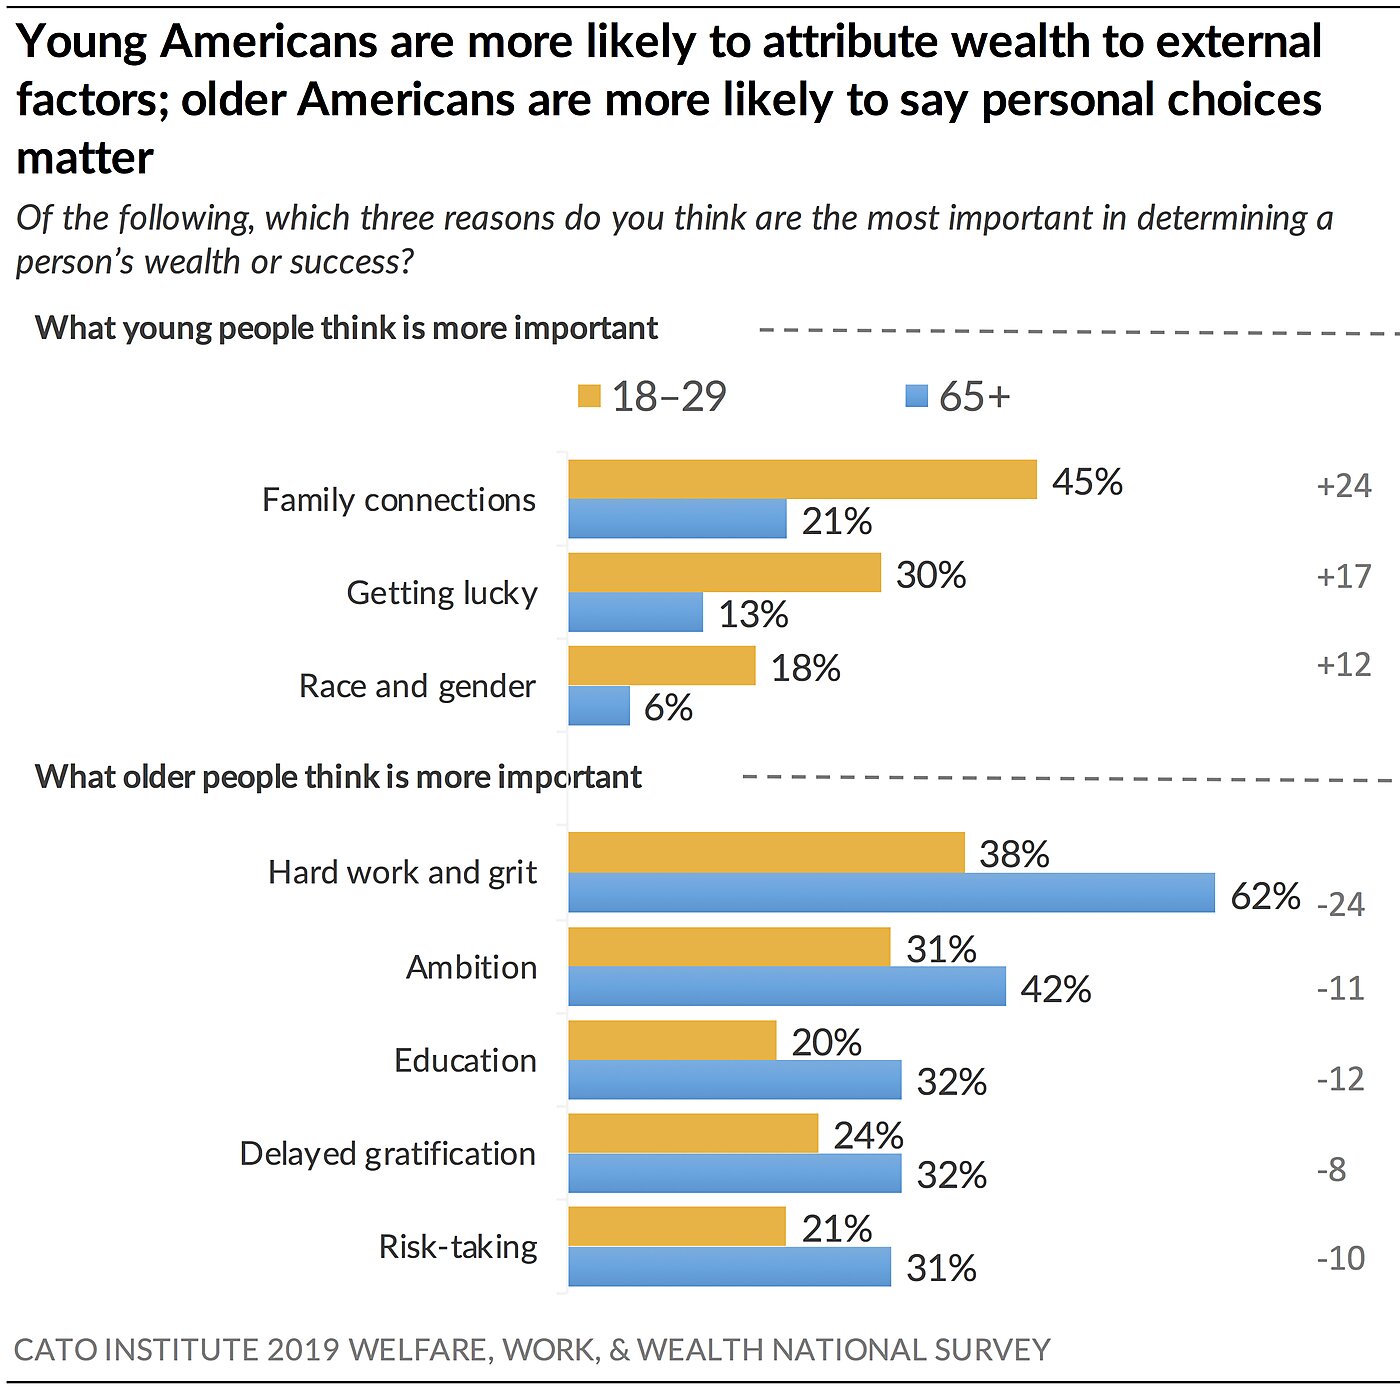
Age Older and younger Americans think differently about how a person becomes rich. Younger Americans are considerably more likely than older Americans to attribute wealth to factors external to a person’s choices. For instance, the top explanations of a person’s wealth and success among Americans under age 30 include:
- 1) Family connections (45%)
- 2) Hard work and grit (38%)
- 3) Ambition (31%)
- 4) Getting lucky (30%)
Thus, two external factors and two internal factors. Conversely, older Americans tend to believe that personal choices are key to driving success:
- 1) Hard work and grit (62%)
- 2) Ambition (42%)
- 3) Self-discipline (32%)
- 4) Education (32%)
- 5) Risk-taking (31%)
Comparing the two groups directly, we find that older people are about 10–25 points more likely than younger people to attribute wealth and success to hard work and grit (62% vs. 38%), ambition (42% vs. 31%), education (32% vs. 20%), and risk-taking (31% vs. 21%). In contrast, younger people are about 10–20 points more likely than older people to attribute wealth to family connections (45% vs. 21%), getting lucky (30% vs. 13%), or race or gender (18% vs. 6%).
Race White, Black, and Latino Americans tend to agree that hard work and grit is a top reason for a person’s wealth and success; however, African Americans are more skeptical. Whites (54%) and Latinos (45%) are more likely than African Americans (39%) to believe that hard work and grit drives wealth.
White Americans’ top explanations for wealth include hard work (54%), ambition (41%), family connections (33%), and risk-taking (31%). African Americans identify hard work (39%), education (38%), and ambition (32%). Latinos say hard work (45%), education (34%), ambition (29%), risk-taking (27%), and family connections (26%) are most important.
White Americans are more likely than Black and Hispanic Americans to say that ambition (41% vs. 32% vs. 29%) or family connections (33% vs. 25% vs. 26%) are key reasons for a person’s wealth.
Black Americans (27%) are about three times more likely than White (8%) and Latino (10%) Americans to believe that a person’s race or gender drive wealth and success. Latinos (34%) and African Americans (38%) are more likely than White Americans (23%) to identify education as a top determinant for a person’s success.
Americans Most Likely to Agree Poor Choices and Drug Abuse Cause Poverty
When asked the top three causes of poverty in this country, Americans agree that poor life choices (42%) and abuse of drugs and alcohol (40%) are key. But the public is divided about what the third factor is: about 3 in 10 think lack of job opportunities (29%), breakdown of families (29%), and a lack of work ethic (29%) are some of the most important reasons. After that, about a quarter say that a lack of educational opportunities (27%), discrimination like racism and sexism (25%), and an unfair economic system (22%) are the primary causes. Fewer say that government programs fostering dependency (14%), inadequate government programs (13%), lack of role models (8%), or a lack of delayed gratification (7%) are the most important causes of poverty in the United States.
Ideological Divide Similar to attitudes about wealth, conservatives tend to believe that poverty is mainly the result of bad personal decisions. Liberals, on the other hand, tend to believe that poverty is mainly the result of external forces that individuals cannot control.
When asked the top three reasons for the continuing problem of poverty in the country, strong liberals selected discrimination like racism and sexism (51%), an unfair economic system (48%), and lack of educational opportunities (48%). Strong conservatives have a different perception. Instead, they believe poverty is caused primarily by poor life choices (60%), lack of work ethic (52%), breakdown of families (47%), and abuse of drugs and alcohol (47%).
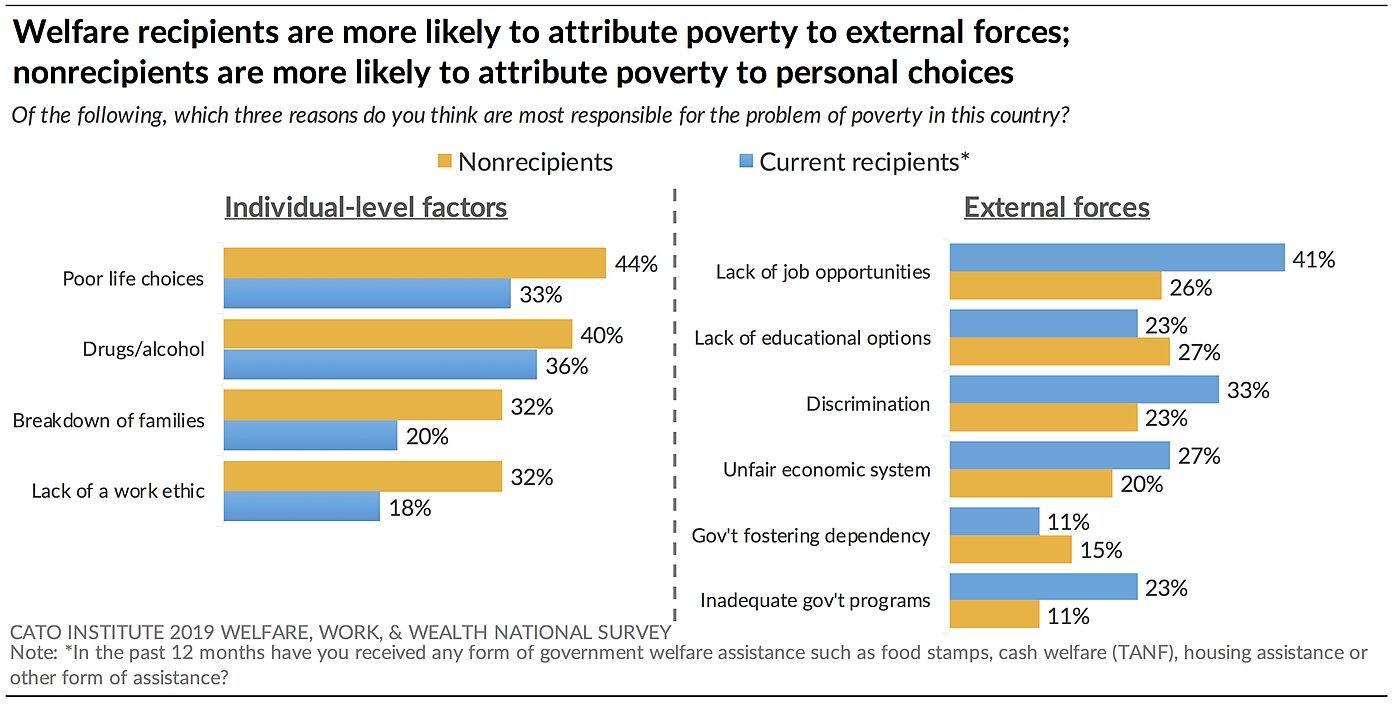
What Do Low-Income Americans Say Causes Poverty?
Americans currently receiving some form of means-tested welfare benefits believe the top reasons for poverty are a lack of job opportunities (41%), drug and alcohol abuse (36%), poor life choices (33%), and discrimination (33%). Those who have not received means-tested welfare benefits agree that poor life choices (44%) and drug and alcohol abuse (40%) are top reasons for poverty. But they also cite a lack of work ethic (32%) and the breakdown of families (32%) as one of the top three factors.
Overall, current recipients of government assistance are more likely than nonrecipients to believe that external factors rather than personal choices are primarily responsible for poverty. For instance, current recipients are about twice as likely as nonrecipients to say that a lack of job opportunities (41% vs. 26%) and inadequate government programs (23% vs. 11%) are primary causes of poverty. Conversely, people not receiving welfare are more likely than current recipients to say that poor life choices (44% vs. 33%), breakdown of families (32% vs. 20%), and lack of work ethic (32% vs. 18%) are primarily to blame for poverty.
Racial Divide
White, Black, and Latino Americans have different views about the causes of poverty. White Americans believe the top causes of poverty include:
- 1) Poor life choices (45%)
- 2) Drug and alcohol abuse (42%)
- 3) Breakdown of families (33%)
- 4) Lack of a work ethic (33%)
While Black and Latino Americans agree that poor life choices are a top reason for poverty, they also believe other factors like discrimination are causes. Notably, while 33% of White Americans and 26% of Latino Americans say a lack of a work ethic is a major driver of poverty, only 13% of Black Americans agree.
The top reasons Black Americans give for poverty include:
- 1) Discrimination like racism (42%)
- 2) Lack of job opportunities (39%)
- 3) Poor life choices (33%)
Latino Americans say the top causes of poverty are:
- 1) Drug or alcohol abuse (42%)
- 2) Poor life choices (34%)
- 3) Discrimination like racism (30%)
Beliefs about Personal Agency
The extent to which people believe personal decisions or external forces determine the direction of people’s lives undergirds what people think causes wealth and poverty. In other words, to what extent do people believe that a person’s agency governs?
This idea is related to a concept in psychology called the locus of control. People who tend to believe events in their lives are within the control of the individual are described as having an internal locus of control. Those who tend to believe events in their lives are outside of a person’s control are described as having an external locus of control. While in reality both external forces and personal choices play a role, the question is what individuals emphasize.
Psychologists have developed survey questions intended to measure if one tends to have an internal or external locus of control. The Cato 2019 Welfare, Work, and Wealth Survey included a battery of these survey questions developed by psychologist Hanna Levenson to measure the extent to which Americans feel an internal or external locus of control.3 (See Appendix A to read more about the Belief in Personal Agency Index).
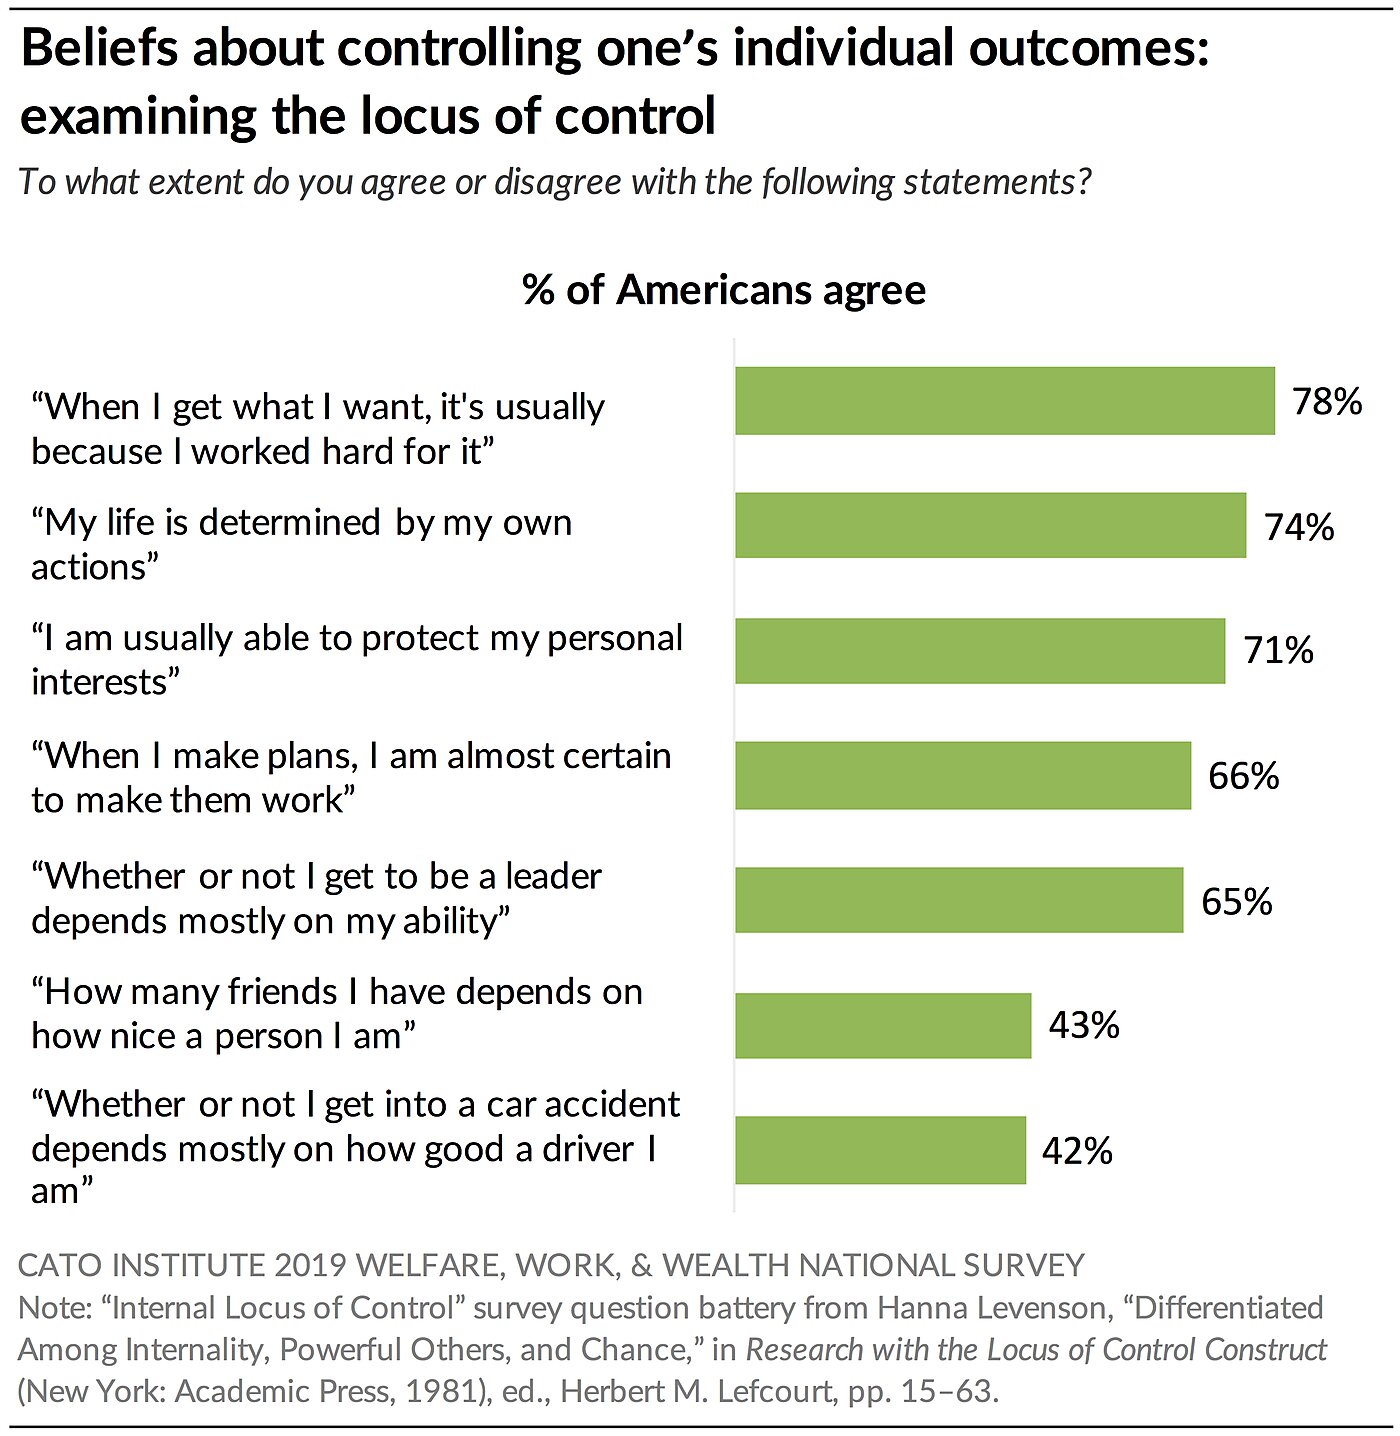
In general, a majority of Americans tend to feel that individuals have personal agency, or an internal locus of control. For instance, 74% of Americans agree that their lives are determined by their actions, and 78% believe that when they get what they want it’s usually because they worked hard to get it.
The survey also included several questions psychologists have used to measure the extent to which people believe their lives are controlled by “powerful others” as a form of an external force.4 About a quarter (23%) of Americans agree that “I feel like what happens in my life is mostly determined by powerful people.” However, about twice that (47%) disagree and 29% don’t feel strongly either way. Americans are more evenly divided in their agreement that “people like myself have very little chance of protecting our personal interests when they conflict with those of strong pressure groups” with about a third who agree, disagree, and don’t have an opinion, respectively.
Democrats Emphasize External Forces; Republicans Emphasize Personal Choices
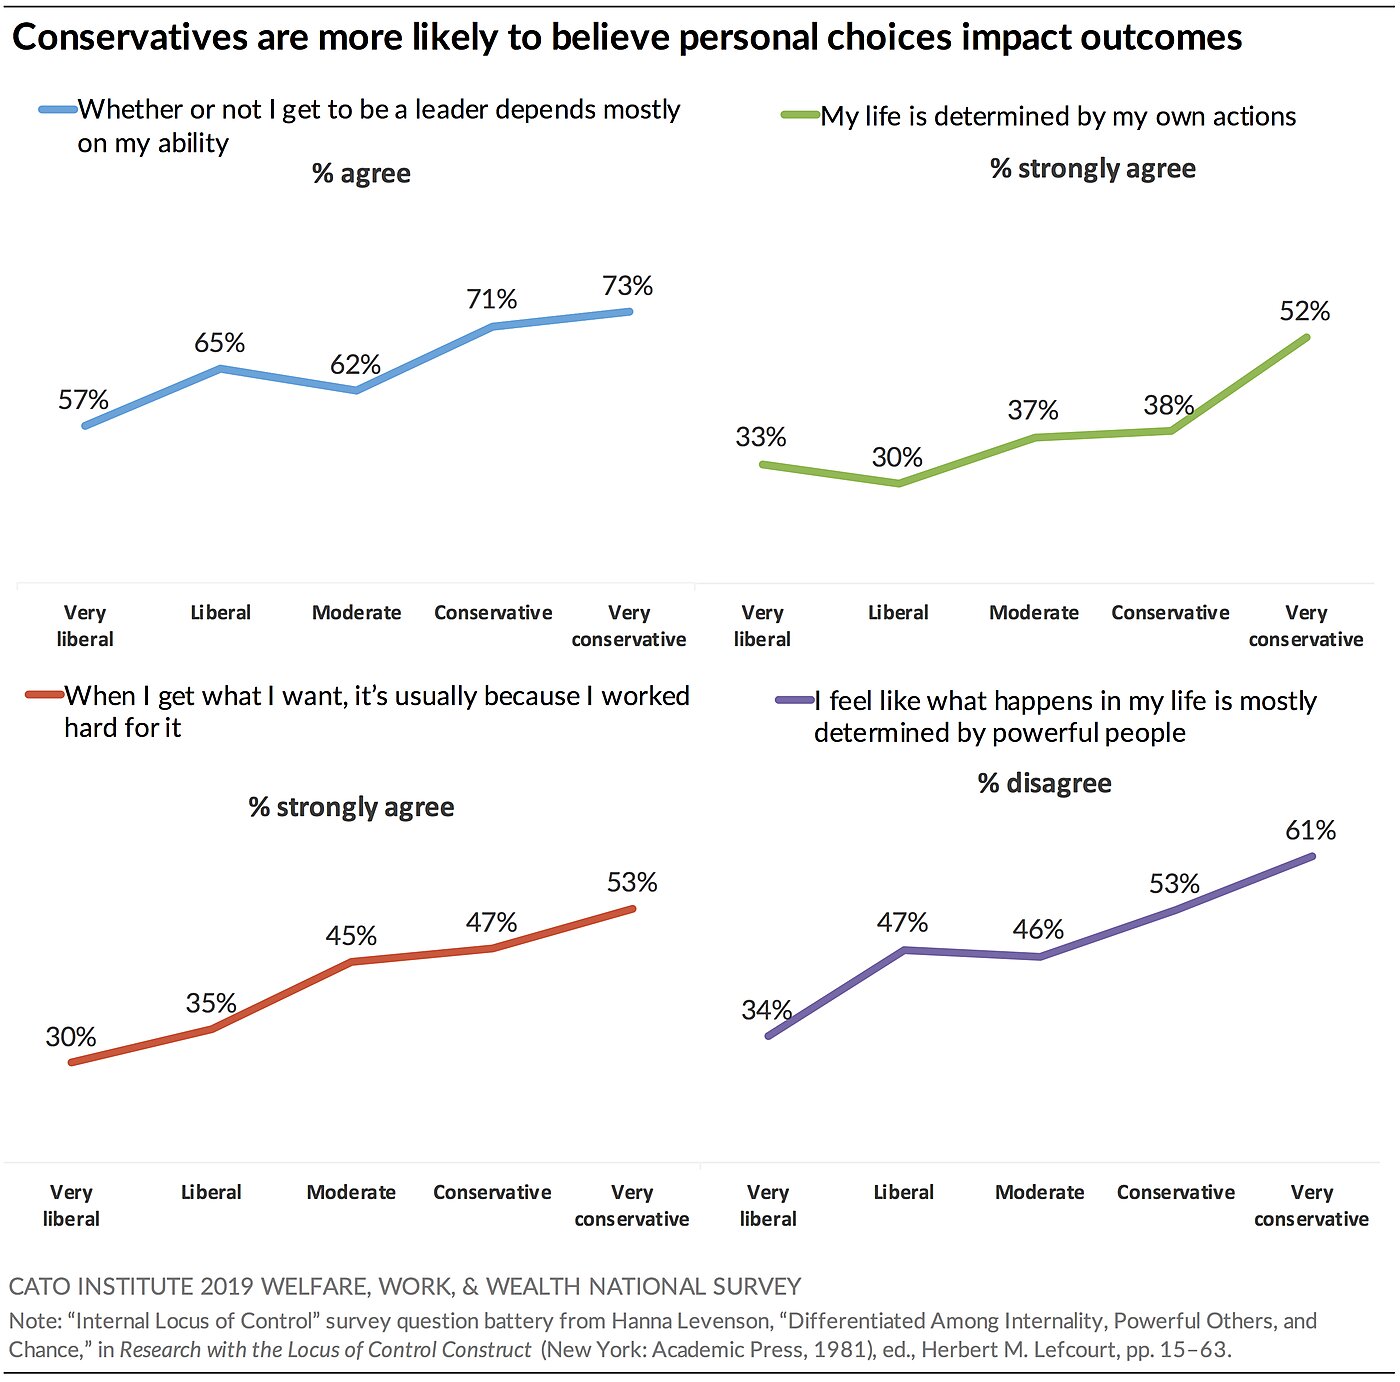
Consistent with attitudes about the origins of wealth and poverty, we find that liberals emphasize external forces and that conservatives emphasize personal choices in explaining personal outcomes. Strong conservatives are about 15–20 points more likely than strong liberals to agree that “whether or not I get to be a leader depends mostly on my ability” (73% vs. 57%), to strongly agree that “my life is determined by my own actions” (52% vs. 33%), and to strongly agree that “when I get what I want, it’s usually because I worked hard for it” (53% vs. 30%).
Conservatives are less likely than liberals to believe that “powerful others” direct their lives. Six in 10 (61%) strong conservatives disagree that what happens in their lives is “mostly determined by powerful people” compared to 34% of strong liberals.
These data demonstrate that liberals and conservatives emphasize the impact of personal agency on outcomes differently. Conservatives are more likely to believe that people are responsible for their situations and use their agency to direct their lives, and liberals are more likely to believe that people’s situations are shaped by their environment and other external factors. These differences in perception and emphasis likely lead liberals and conservatives to reach different conclusions about how public policy should approach poverty, welfare, work, and wealth.
Attitudes toward Capitalism and Socialism
59% of Americans Have Favorable Views of Capitalism; 59% Have Unfavorable Views of Socialism
Americans continue to have more favorable attitudes toward “capitalism” than “socialism.” However, groups vary significantly in their reactions to the terms.
A majority (59%) of Americans have favorable views of the word “capitalism,” while 39% have an unfavorable view of it. In reverse, 39% of Americans have a favorable view of the word “socialism,” while 59% view socialism negatively.
Democrats Feel More Favorable toward Socialism Than Capitalism
Democrats stand out with a majority (64%) who have a favorable view of socialism, while less than half (45%) have a favorable view of capitalism. Instead, a majority of Democrats (54%) have a negative view of capitalism.
In contrast, majorities of Republicans and independents have favorable views of capitalism and unfavorable views of socialism. But Republicans are considerably more favorable toward capitalism than independents by a margin of 77% to 52% and more unfavorable toward socialism, 85% vs. 58%.
Democrats Turn Against Capitalism and Toward Socialism during the Trump Era
Survey data over time reveals that Democrats began turning against capitalism and toward socialism during the Trump era. Historical Gallup surveys show that Democrats were about equally favorable toward socialism and capitalism in 2010 (53% vs. 53%), 2012 (55% vs. 53%), and 2016 (58% vs. 56%). After 2016, however, Democratic support for capitalism started to lose out to socialism. By 2018, Gallup found 57% of Democrats had a favorable view of socialism while fewer (47%) had a favorable view of capitalism.5 The Cato survey conducted in 2019 finds the gap widening with 64% of Democrats who have favorable views of socialism and 45% who have favorable views of capitalism. Republicans, on the other hand, have remained resolutely in favor of capitalism and opposed to socialism since at least 2010.
50% of Democrats Say Trump Has Soured Their View of Capitalism
Attitudes toward Donald Trump may have something to do with changing Democratic opinions. Fully 50% of Democrats say that President Trump has made them “like capitalism less,” while 44% say he has had no impact on their perceptions. In contrast, majorities of independents (76%) and Republicans (64%) say Trump has not influenced their views either way.
Given that 90% of Democrats have an unfavorable view of the president, they may have lost confidence in an economic system that seemed to benefit Trump, a billionaire businessman.
Who Likes Capitalism; Who Likes Socialism?
African Americans, younger people, and lower-income Americans are most suspicious of capitalism and sympathetic to socialism.
Race Nearly two-thirds (62%) of African Americans have a favorable view of socialism, compared to about a third of Hispanic (36%), White (36%), and Asian Americans (33%). Instead, two-thirds of Hispanics (60%), Whites (63%), and Asians (64%) have negative views of socialism. African Americans are also less favorable toward capitalism. A majority (55%) of Black Americans have an unfavorable view while 40% have a favorable view. In contrast, majorities of White (64%), Asian (60%), and Latino (52%) Americans have a positive view of capitalism.
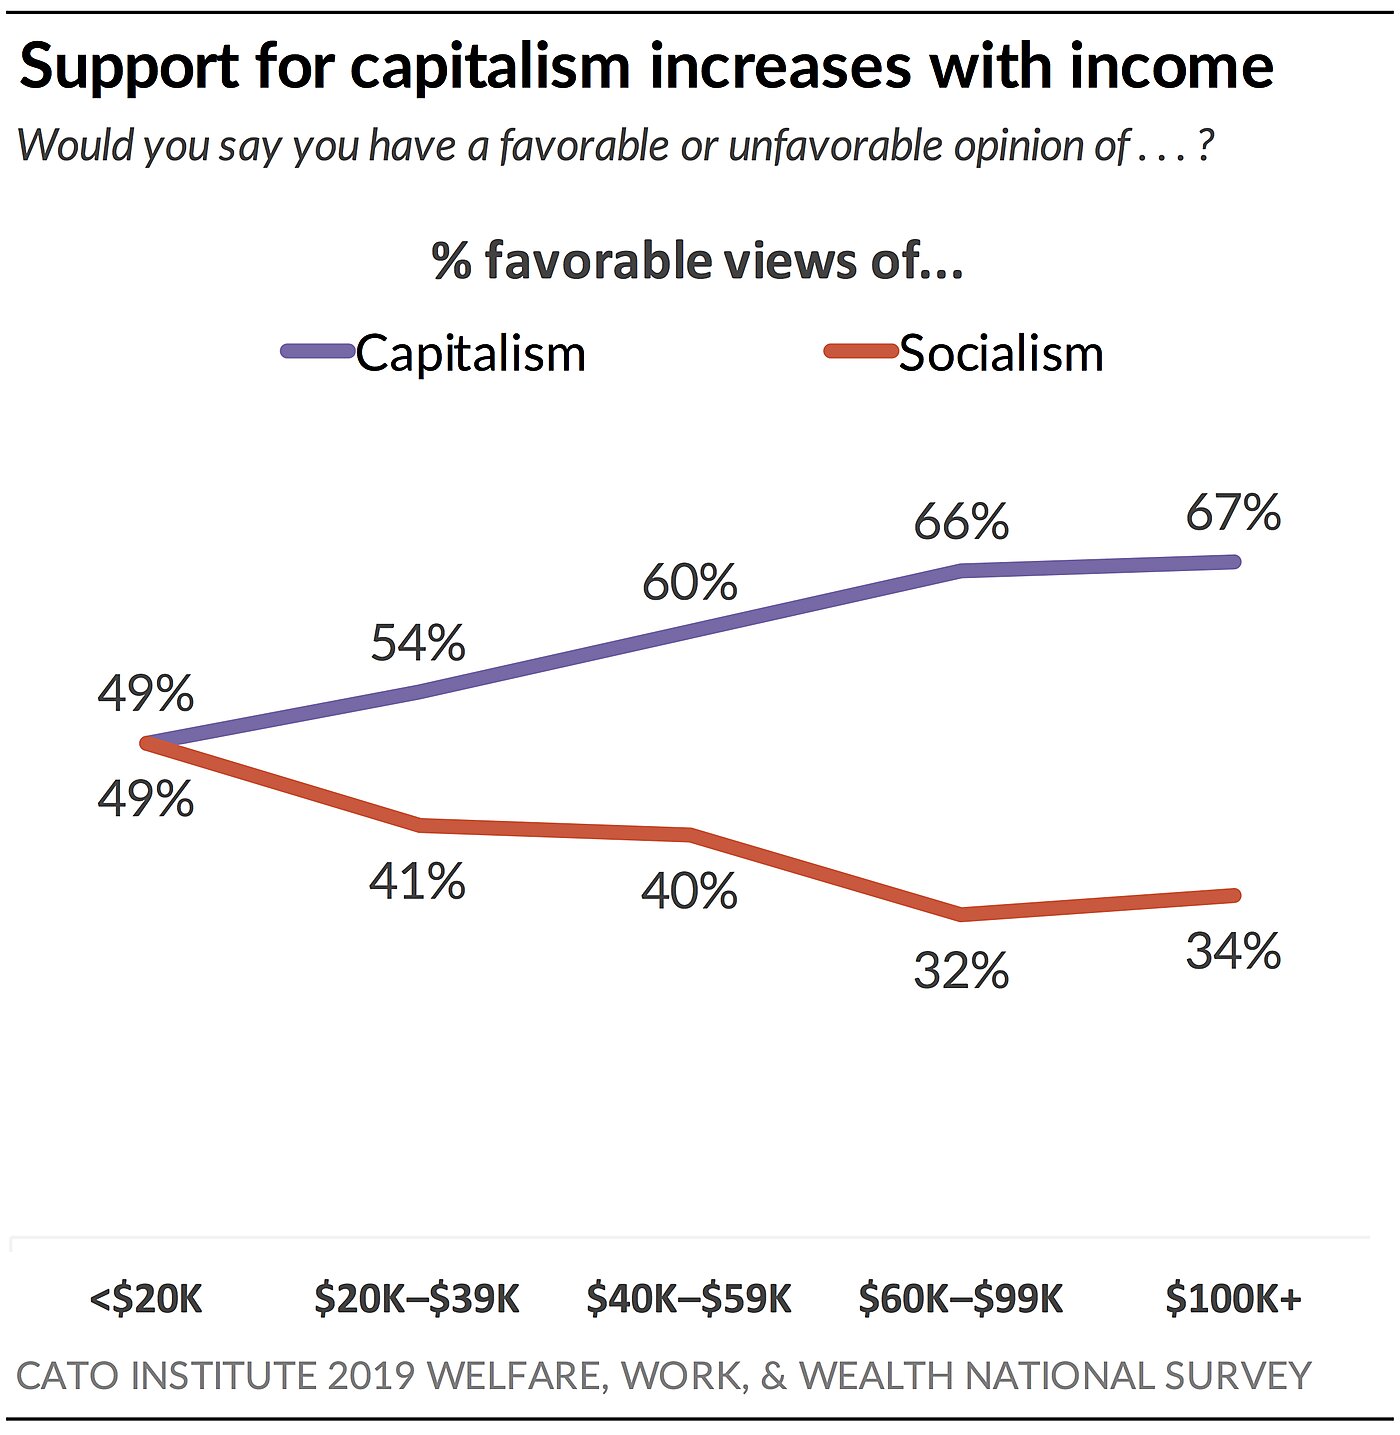
Income Lower-income Americans are ambivalent in their feelings toward socialism and capitalism. Equal shares of Americans earning less than $20,000 a year have a favorable view of capitalism (49%) and socialism (49%). However, once annual incomes reach $20,000 to $40,000, Americans show a clear preference for capitalism (54% favorable) over socialism (41% favorable). Two-thirds (66%) of Americans with incomes above $60,000 a year have positive reactions to the word “capitalism,” while half that (33%) have positive views of socialism.
Age Younger Americans are also divided in their feelings toward capitalism and socialism. Among those under 30, half (50%) have favorable views of socialism and about half (49%) have favorable views of capitalism. However, Americans over age 30 express a preference for capitalism over socialism. Support for capitalism increases to 58% among those 45–54, to 65% among those 55–64, and to 76% among those 65 and over.6
Support for capitalism doesn’t increase among Americans 30–44, but rather, support for socialism declines to 43%. Support for socialism drops further to 33% among those over 45.
It’s unclear if support for capitalism rises and socialism declines with age because people are changing their minds or because today’s younger cohort is permanently more skeptical of capitalism. Given that Americans 30 to 44 years old reached adulthood in the Great Recession era, it’s plausible they may remain distrustful of capitalism going forward.
What’s Fair: Getting What You Earn or Getting What You Need?
Behind American attitudes toward capitalism and socialism is really a question about how people think resources and rewards ought to be distributed in society. Should they be distributed “from each according to his ability, to each according to his needs” as Karl Marx urged?7 Or should resources and rewards go to the people who produce what is valued in the marketplace of their peers? Ultimately, this is a question about what Americans think is fair. Is fairness getting what you earn (just deserts) or getting what you need? The survey asked several questions to investigate Americans’ penchant for just deserts.
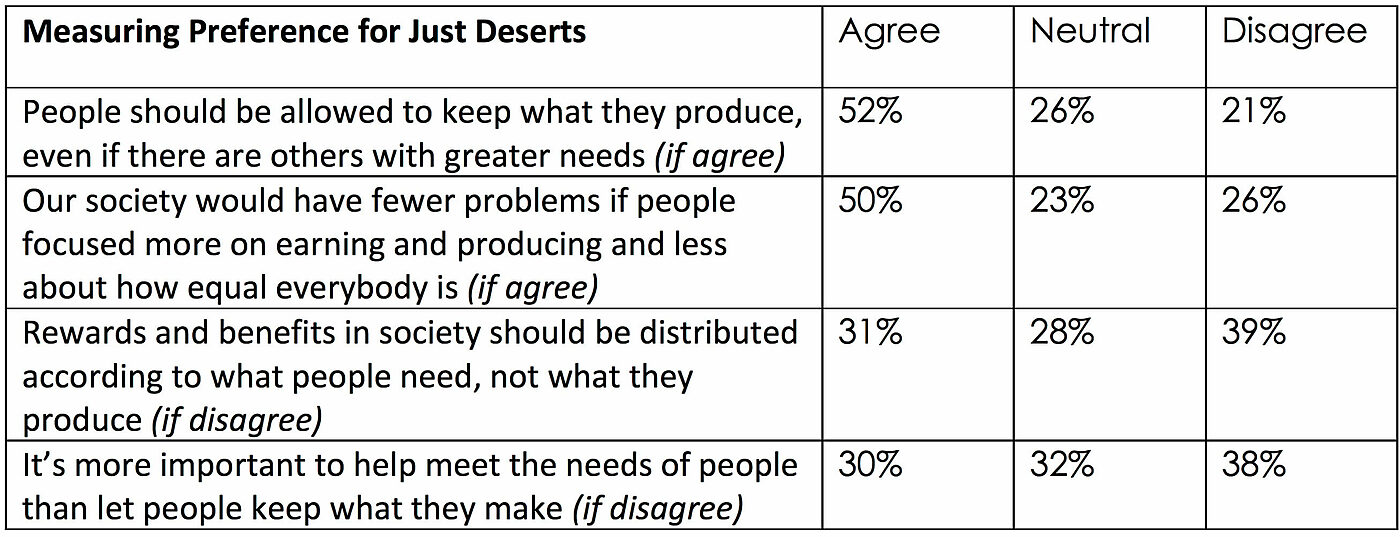
Americans agree that “people should be allowed to keep what they produce, even if there are others with greater needs” (52% agree vs. 21% disagree) and that “our society would have fewer problems if people focused more on earning and producing and less about how equal everybody is” (50% agree vs. 26% disagree). Slightly more disagree than agree that “rewards and benefits in society should be distributed according to what people need, not what they produce” (39% disagree vs. 31% agree) and that “it’s more important to help meet the needs of people than let people keep what they make” (38% disagree vs. 30% agree).
Conservatives Believe Fairness Is Getting What You Earn; Liberals Believe Fairness Is Getting What You Need
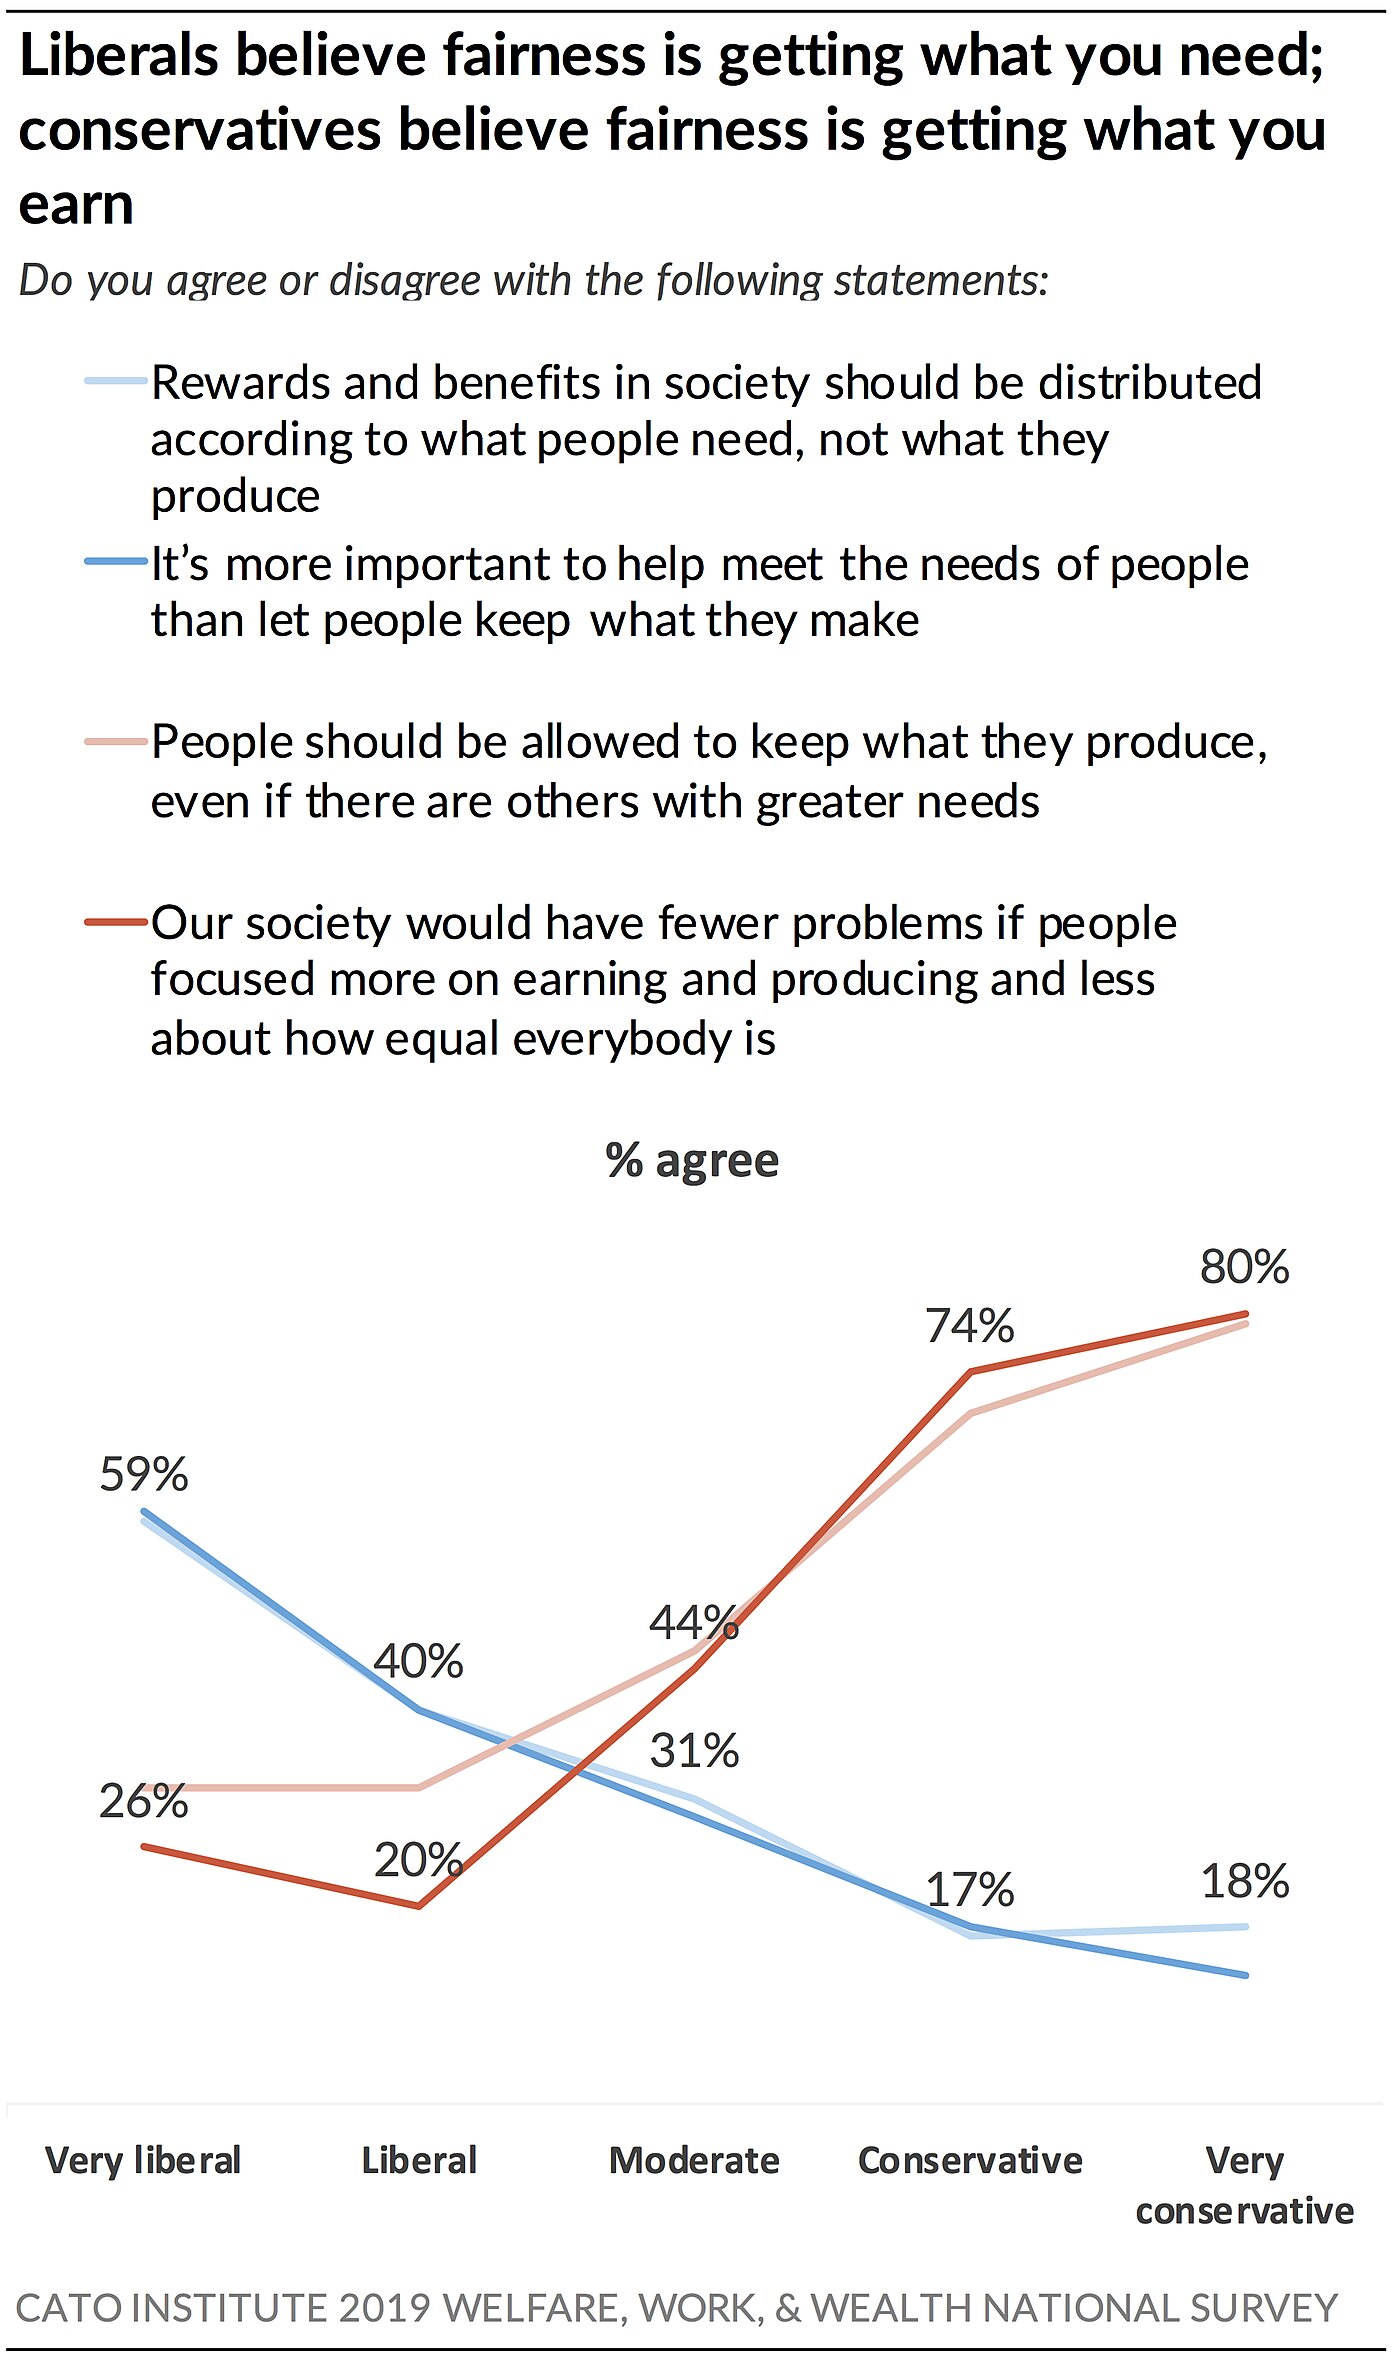
Strong liberals are nearly 50 points more likely than strong conservatives to agree that “rewards and benefits in society should be distributed according to what people need” (59% to 18%) and to believe “it’s more important to help meet the needs of people than let people keep what they make” (60% vs. 13%).
Conversely, strong conservatives are about 50 points more likely than strong liberals to agree that “people should be allowed to keep what they produce, even if there are others with greater needs” (79% vs. 32%) and to believe “society would have fewer problems if people focused more on earning” and “less about how equal everybody is” (80% vs. 26%).
In sum, conservatives believe that fairness is getting what you earn, and liberals believe that fairness is getting what you need.
Answers to these four questions were averaged together to create the Just Deserts Index referenced in the next section. This index measures a respondent’s preference for just deserts. (See Appendix B for more information.)
Value Differences People who have a “reap what you sow” or “just deserts” conception of economic justice are most opposed to socialism and most supportive of capitalism. Among those who score high on the Just Deserts Index, fully 97% have an unfavorable view of socialism and 94% have a favorable view of capitalism.8 (See Appendix B.) Conversely, among those who score low on the Just Deserts Index, 70% have favorable views of socialism, and 37% have favorable views toward capitalism.
Attitudes toward the Rich and the Poor
Attitudes about Taxing the Rich
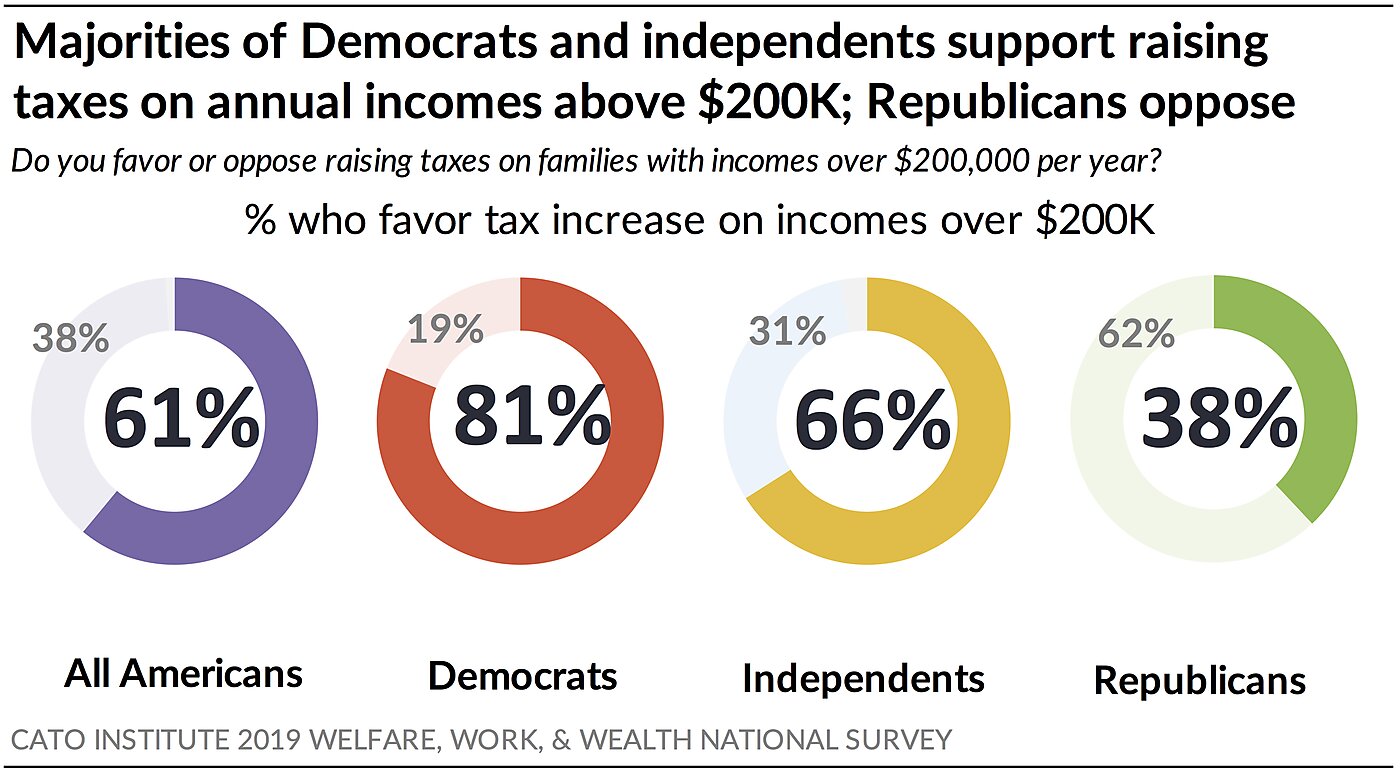
61% of Americans Favor Raising Taxes on Families Earning over $200,000 a Year
Nearly two-thirds (61%) of Americans favor raising taxes on families with incomes over $200,000 per year while 38% oppose. Such a policy is highly partisan with 81% of Democrats and 66% of independents in favor and 62% of Republicans opposed.
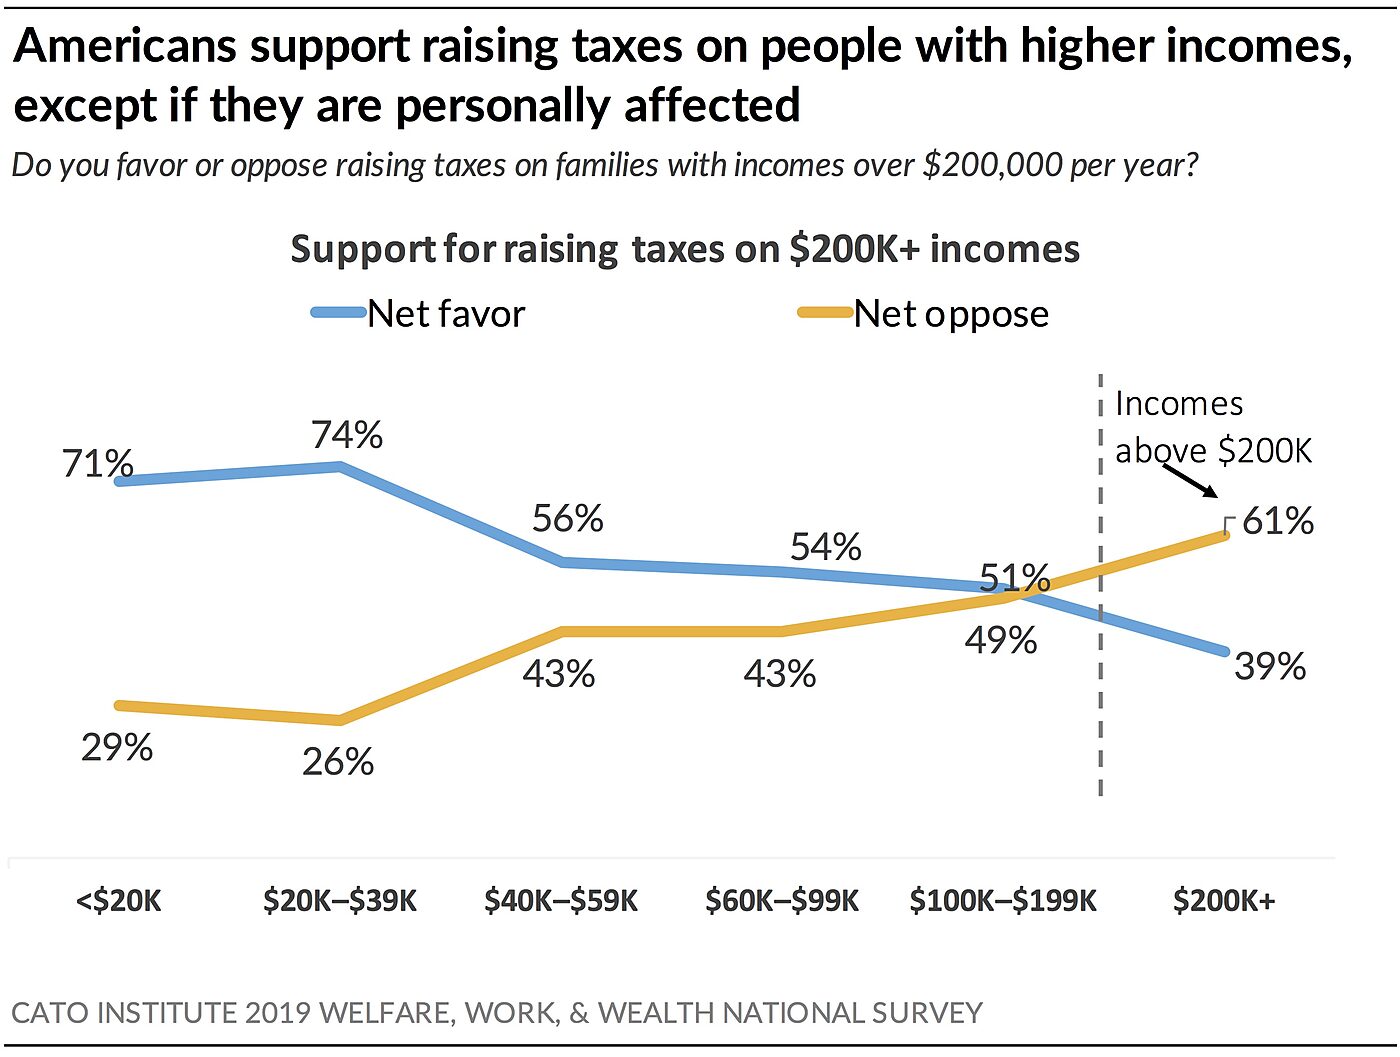
Richer Americans Oppose Raising Their Taxes
Raising taxes on other people is easier than raising taxes on yourself. Americans become opposed to raising taxes on incomes above $200,000 when their income rises above that threshold.
For instance, 73% of Americans earning less than $40,000 a year support raising taxes on households earning $200,000 per year. Support declines to 55% among those earning between $40,000 and $99,999 per year and reaches parity among those earning $100,000 to $199,999 per year. However, among those earning more than $200,000 per year, and thus impacted by a tax increase, people become opposed. In that cohort, 61% oppose a tax increase while 39% support it. In sum, Americans are more supportive of raising taxes on people other than themselves.
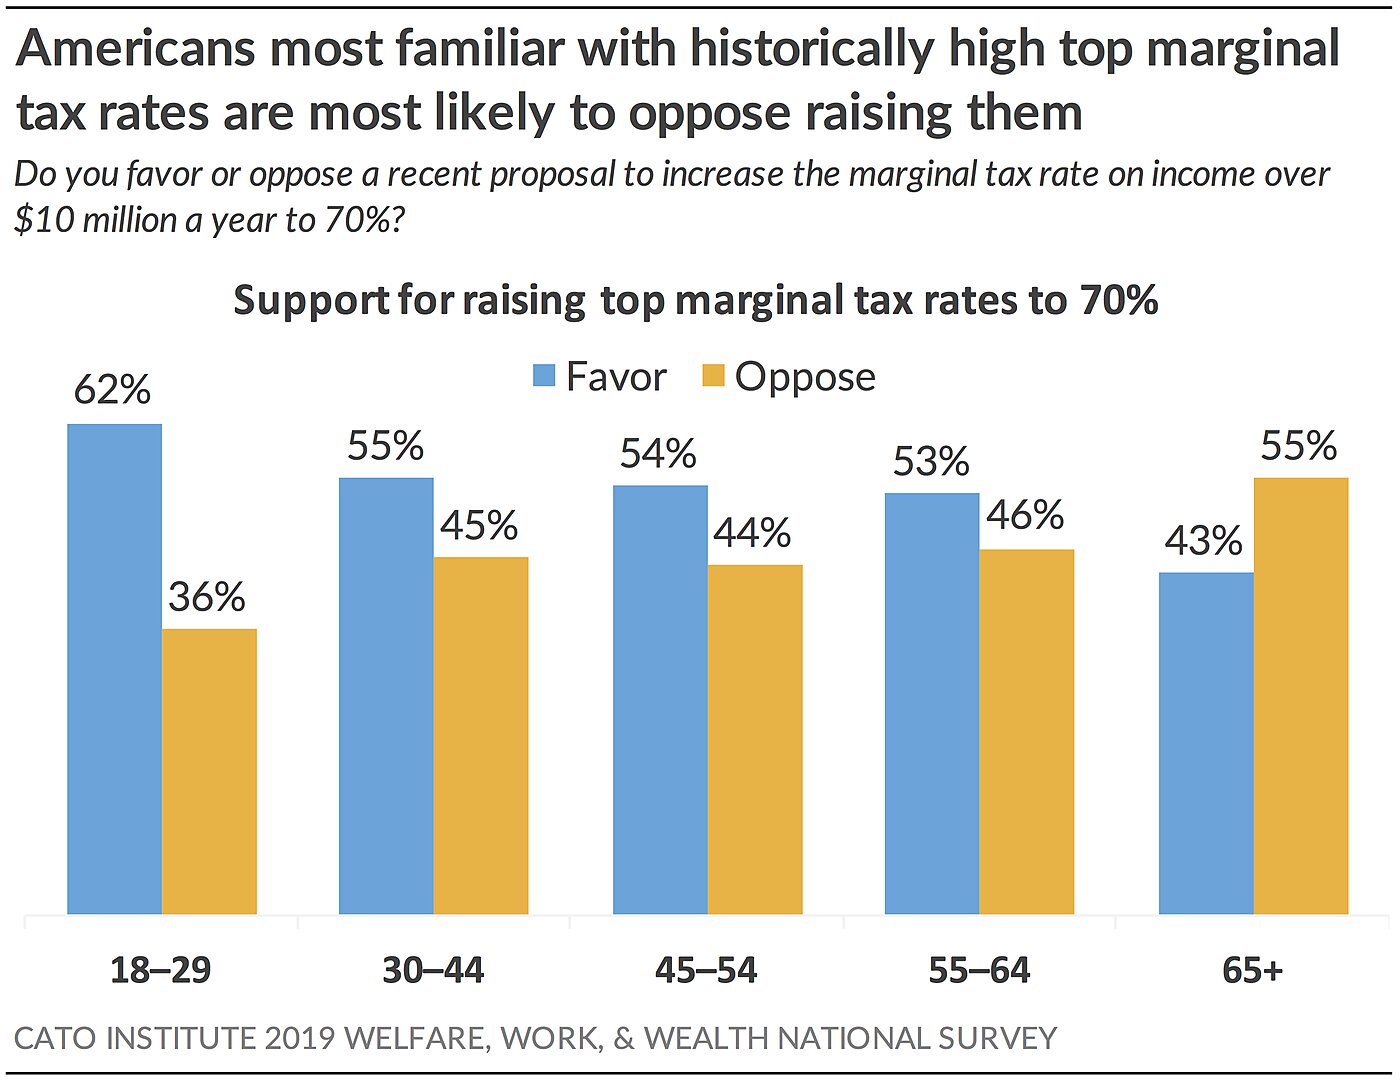
53% of Americans Favor Raising Top Marginal Tax Rate to 70% on Income over $10 million
A slim majority (53%) of Americans support a proposal made by lawmakers to increase the top marginal tax rate to 70% on incomes over $10 million a year, while 46% oppose.
Support is highly partisan with 75% of Democrats in support and 70% of Republicans opposed. Independents lean with Democrats with 58% in favor.
Older Americans are opposed to reinstating high top marginal tax rates. A majority (55%) of those 65 and over oppose raising top marginal tax rates to 70%. In stark contrast, two-thirds (62%) of Americans under 30 favor doing so. Notably, the age cohort that experienced a period in American history with high top marginal tax rates is also the cohort most opposed to returning marginal rates to those higher levels.9
Psychology might also influence how people think about top marginal tax rates. Americans who score high on the Resentment of High Achievers Index (RHAI) are 43 points more likely than those who score low to support raising top marginal tax rates (74% vs. 31%). (The RHAI index measures Americans’ propensity to feel resentment and envy in upward social comparisons; see Appendix E for more information.) But also, respondents who score high on the Dispositional Compassion Index (DCI) are 22 points more likely to support raising top marginal tax rates compared to those who score low on compassion (67% vs. 45%). (The DCI measures Americans’ propensity to feel empathy for others; see Appendix C for more information.) Thus, motives for raising top marginal tax rates might include both resentment of the successful and compassion for the needy.
62% of Americans Oppose Redistributing Wealth from the Rich to the Poor; 58% of Democrats Favor
Although Americans support raising income taxes on top earners, they oppose the idea of redistributing wealth from the rich to the poor. The survey finds that 62% of Americans disagree that “wealth should be taken from the rich and given to the poor” while 37% agree.
Democrats stand out with a majority (58%) who agree “wealth should be taken from the rich and given to the poor.” Conversely, majorities of Republicans (83%) and independents (64%) disagree.
Redistribution of wealth divides the Democratic coalition. An overwhelming majority (69%) of strong liberals agree that wealth should be redistributed from the rich to the poor. But a majority (53%) of moderate liberals disagree. Conservatives, on the other hand, are united. Strong and moderate conservatives overwhelmingly oppose (80%) taking wealth from the rich to give to the poor.
55% of Americans Say Wealth Distribution in the United States Is Unfair
Although Americans don’t want to redistribute wealth from the rich to give to the poor, most remain dissatisfied with the nation’s distribution of wealth.
A majority (55%) of Americans believe that the wealth distribution in the U.S. is unjust, while 44% disagree. Republicans stand out with 67% who do not think the distribution is unfair. But majorities of Democrats (79%) and independents (55%) disagree and believe it is unfair.
There are significant differences across age groups. A solid majority (70%) of Americans under age 30 agree the distribution of wealth in the U.S. is unjust. This share declines to 54% among those 45–54 and to 39% among seniors. Older Americans disagree with their kids and grandkids. A majority (61%) of Americans age 65 and over do not believe the distribution of riches in the U.S. is unjust.
Attitudes toward the Rich
Some may believe that public support for raising taxes on the wealthy indicates a resentful desire to “soak the rich.” However, survey data show that Americans like rich people and endorse the pursuit of amassing great wealth.
84% of Americans Say There’s “Nothing Wrong” with Trying to Make as Much Money as Possible
Eighty-four percent (84%) of Americans agree, including 54% who strongly agree, that “there is nothing wrong with a person trying to make as much money as they honestly can.” Fifteen percent (15%) disagree. This share has declined slightly since it was asked in 1958, when 95% of Americans agreed.10
These sentiments are post-partisan: 90% of Republicans, 80% of independents, and 80% Democrats agree. But, partisans agree with different levels of intensity. Seven in 10 (70%) Republicans “strongly agree” compared to 4 in 10 Democrats (43%) and independents (45%) who “strongly agree.” A minority of Democrats (20%) and independents (19%), compared to 9% of Republicans, believe something is wrong with trying to make as much money as one can.
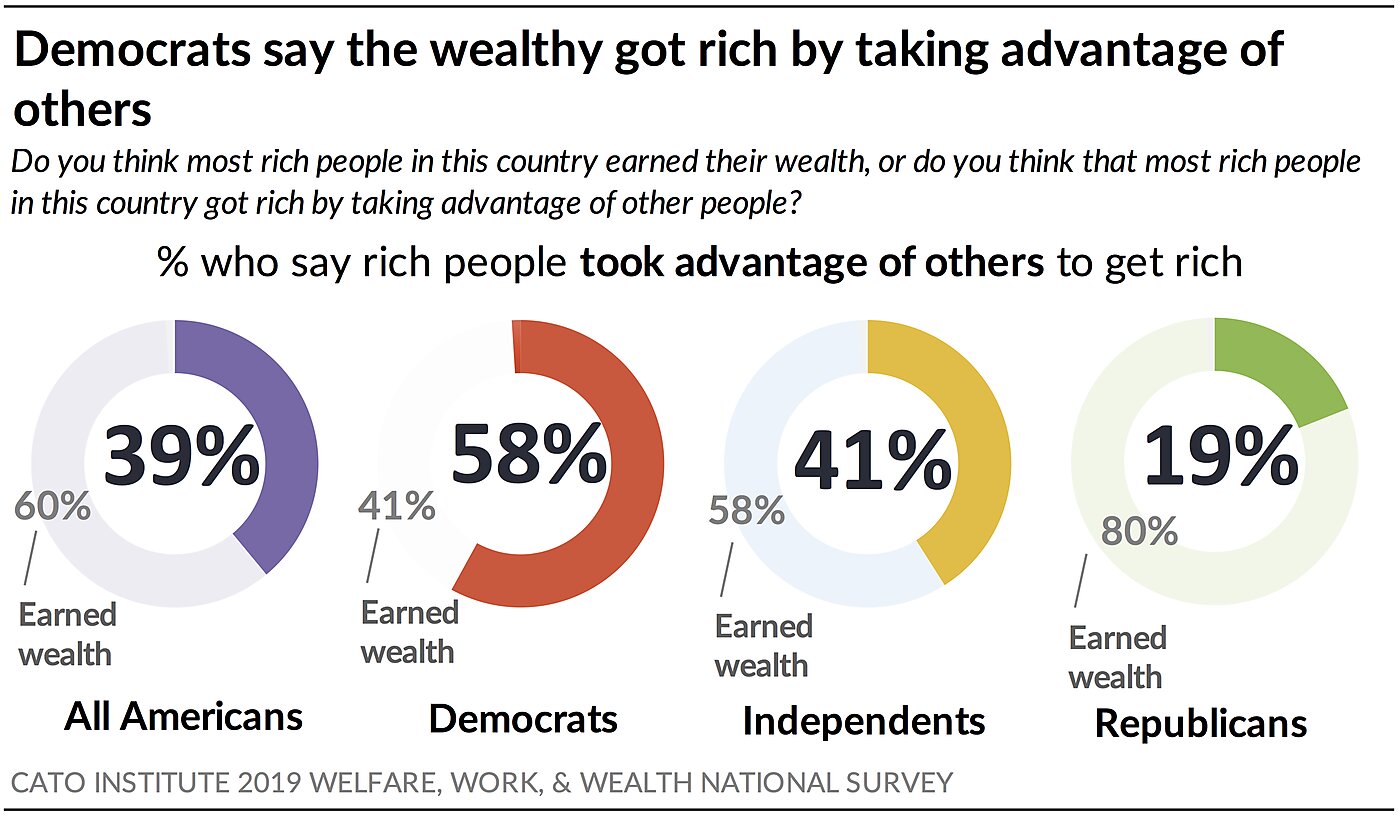
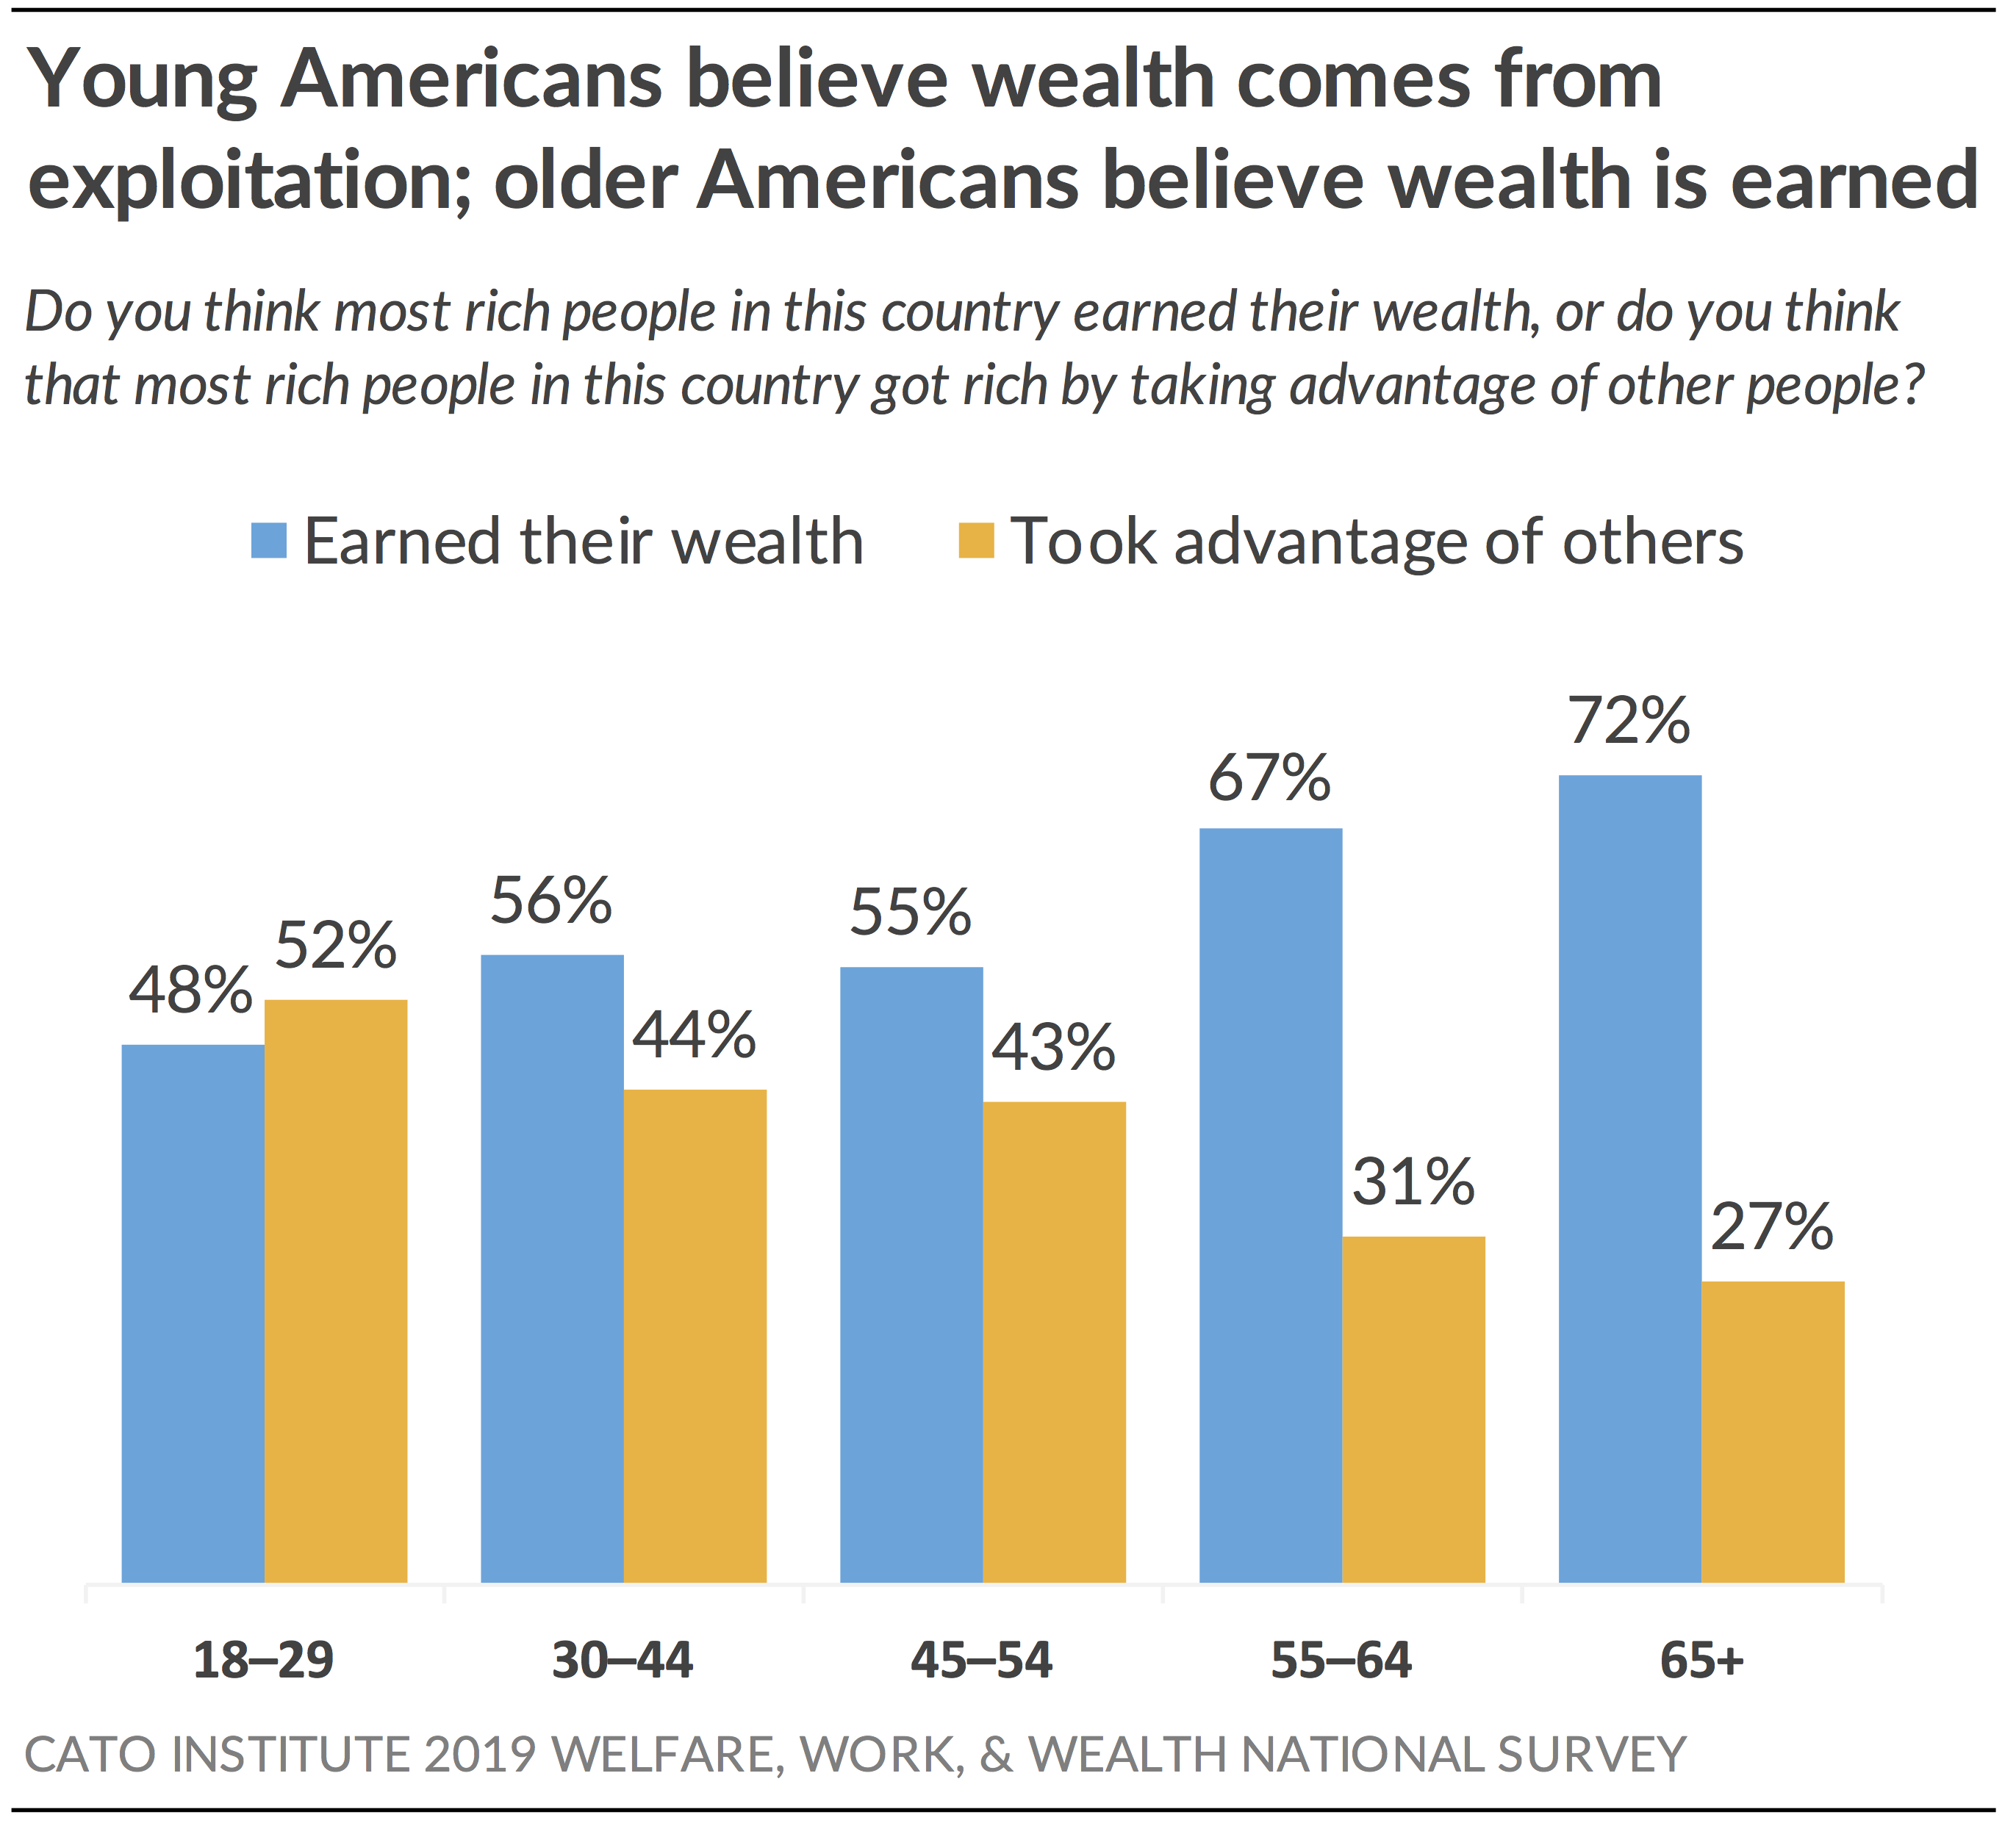
6 in 10 Americans Believe the Rich Earn Their Wealth through Value Creation, Not Exploitation
Six in 10 (60%) Americans believe that “most rich people” in the United States “earned their wealth” while 39% believe that most wealthy people got rich by “taking advantage of other people.”
58% of Democrats Believe People Get Wealthy by Taking Advantage of Others
Democrats stand out from Americans overall with a majority (58%) who believe that most rich people in the United States got wealthy through taking advantage of others. Forty-one percent (41%) believe most earned their wealth. Conversely, an overwhelming majority of Republicans (80%) and a majority of independents (58%) say most wealthy people earned their wealth rather than exploited people to get it.
Why do some people perceive that the wealthy earned their wealth while others say that the wealthy gained it through exploitation of others? Differences in personality and psychology may help explain. Specifically dispositions that people have toward high achievers, beliefs about personal agency, and one’s tendency to empathize may play a role.
The resentment people have toward high achievers may influence how they perceive the rich. Americans who score high on the Resentment of High Achievers Index (RHAI) are more than 50 points more likely than people who score low to believe the rich gained their wealth by taking “advantage of other people” by a margin of 70% to 17%. Less resentful people, or Americans who score low on the RHAI, are far more likely than those who score high to believe the rich earned their wealth by a margin of 82% to 29%. (See Appendix E for more information on the RHAI.)
Belief in personal agency may also shape perceptions. People who believe that their choices largely direct their lives, or those who score high on the Belief in Personal Agency Index, are 25 points more likely to believe the rich earned their wealth than people who believe that external forces largely determine outcomes by a margin of 72% to 47%. (See Appendix A for more information on the Belief in Personal Agency Index.)
Compassion for the vulnerable may also play a role. Those who express higher levels of empathy, or score high on the Dispositional Compassion Index (DCI), are 16 points more likely than those who express less empathy, or score low on the DCI, to believe the wealthy took advantage of others to get rich (48% vs. 32%). (See Appendix C for more information on the Dispositional Compassion Index.)
Nevertheless, resentment of high achievers is more highly correlated with the perceptions people have about how the rich got rich than beliefs about personal agency or compassion for the dispossessed.
69% of Americans Say the Rich Earned Their Wealth by Creating Value for Others
One reason the public believes the wealthy “earned their wealth” may be that they think the rich create value for others by being both inventors and investors.
First, the survey finds that 69% of Americans believe that people get rich by “inventing new technologies or starting new businesses that improve people’s lives.” A little less than a third (30%) disagree with this sentiment.
Second, 65% agree that “we are all better off when people get rich” because “they invest their money in new businesses that create jobs and new technology.” About a third (34%) disagree.
There are notable partisan differences. Eight in 10 Republicans and 7 in 10 independents agree that the rich earn their wealth by creating value for others and continue to invest their money in a way that helps society. However, Democrats are conflicted. While 55% of Democrats believe that the very rich earned their wealth by creating value for others, a slim majority (51%) disagree that “we are all better off when people get rich.” In other words, Democrats believe that the rich create value for others by inventing technologies and starting businesses, but they are skeptical of how once-amassed wealth creates value for society.
75% of Americans Don’t Believe It’s Immoral for Society to Allow Billionaires
Some newly elected lawmakers have made comments about the morality of the capitalist system that allows billionaires to exist.11 The survey sought to measure how much of the public shares these views.
About a quarter (23%) of Americans agree that “it’s immoral for society to allow people to become billionaires.” But most Americans (75%) do not believe it’s immoral for society to allow people to become as wealthy as a billionaire. Majorities of Democrats (66%), independents (73%), and Republicans (86%) agree that it is not immoral.
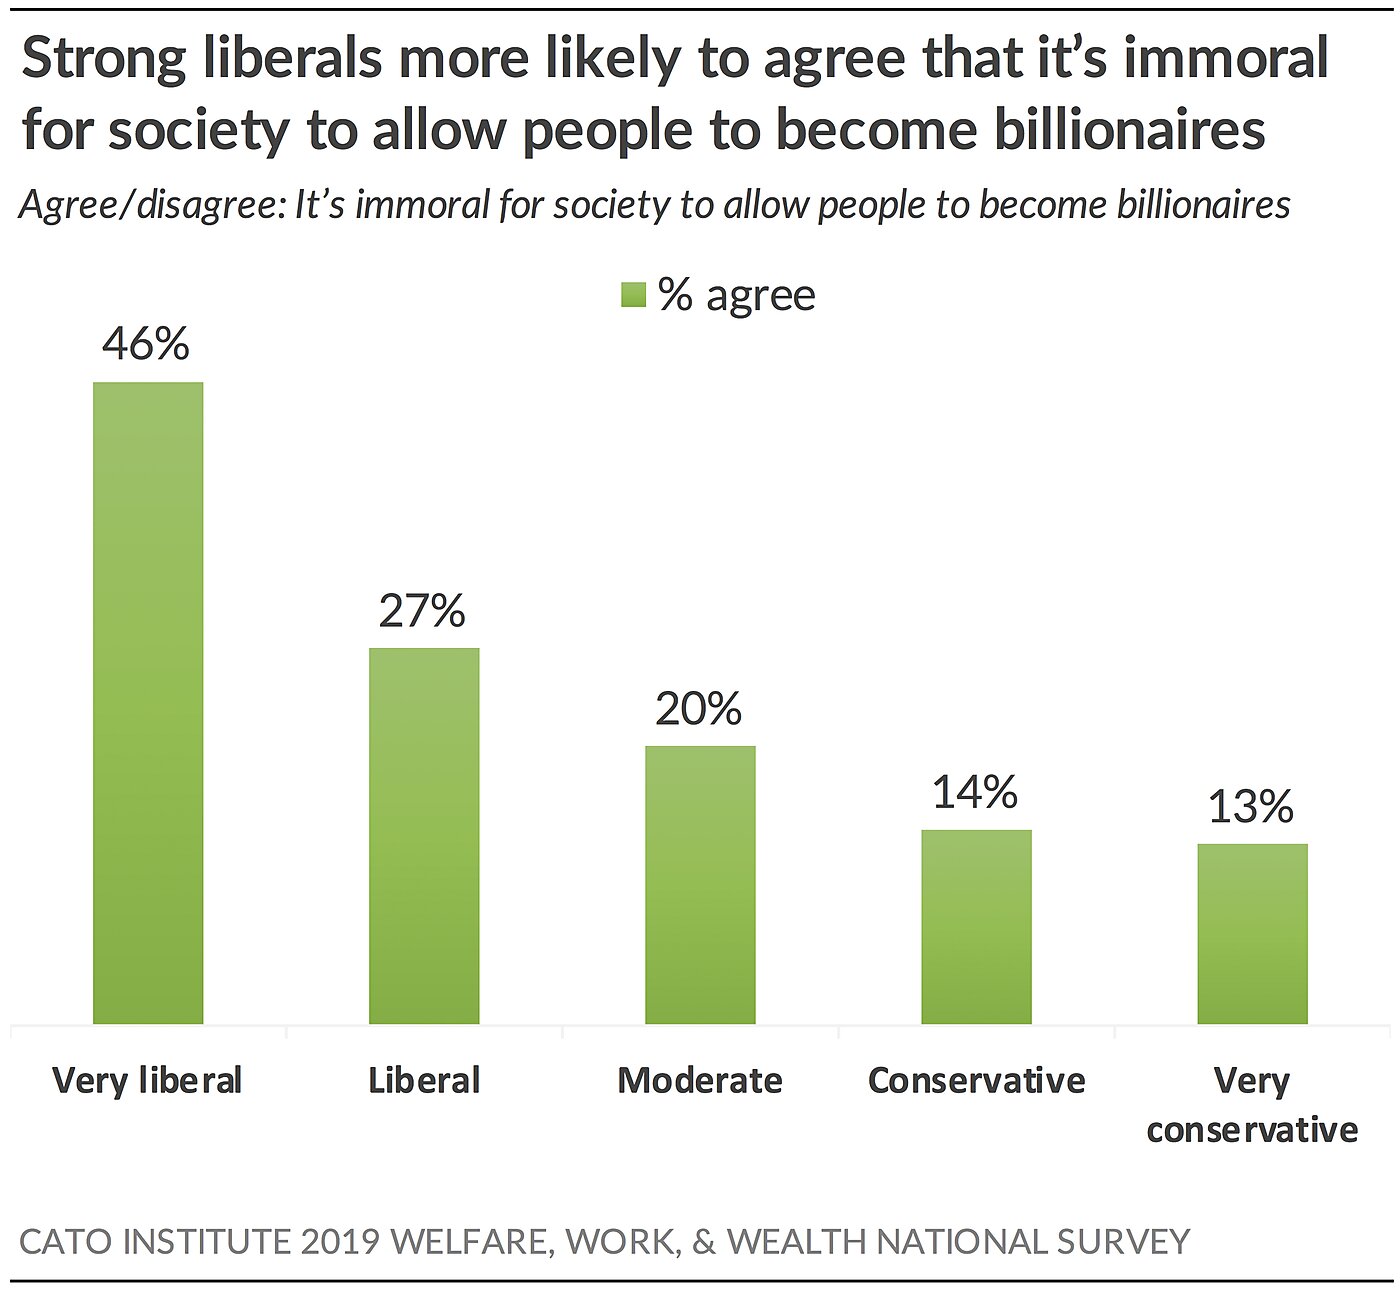
Some groups are more likely to worry about the morality of billionaire creation, particularly within socialist circles. Nearly two-thirds (65%) of Americans with very favorable views of socialism believe allowing the creation of billionaires is morally wrong.12
The question divides the Democratic coalition: strong liberals (46%) are about 20 points more likely than moderate liberals (27%) (and about 30 points more likely than strong conservatives [13%]) to think the system is immoral to allow the creation of billionaires.
Young Americans (18–29) are also more likely to share this sentiment with 39% who agree, compared to 30% of those 30–44, 20% of those 45–54, and 13% of those over 55.
62% of Americans Say Billionaires Don’t Threaten Democracy, but 54% of Democrats Say Billionaires Are a Threat
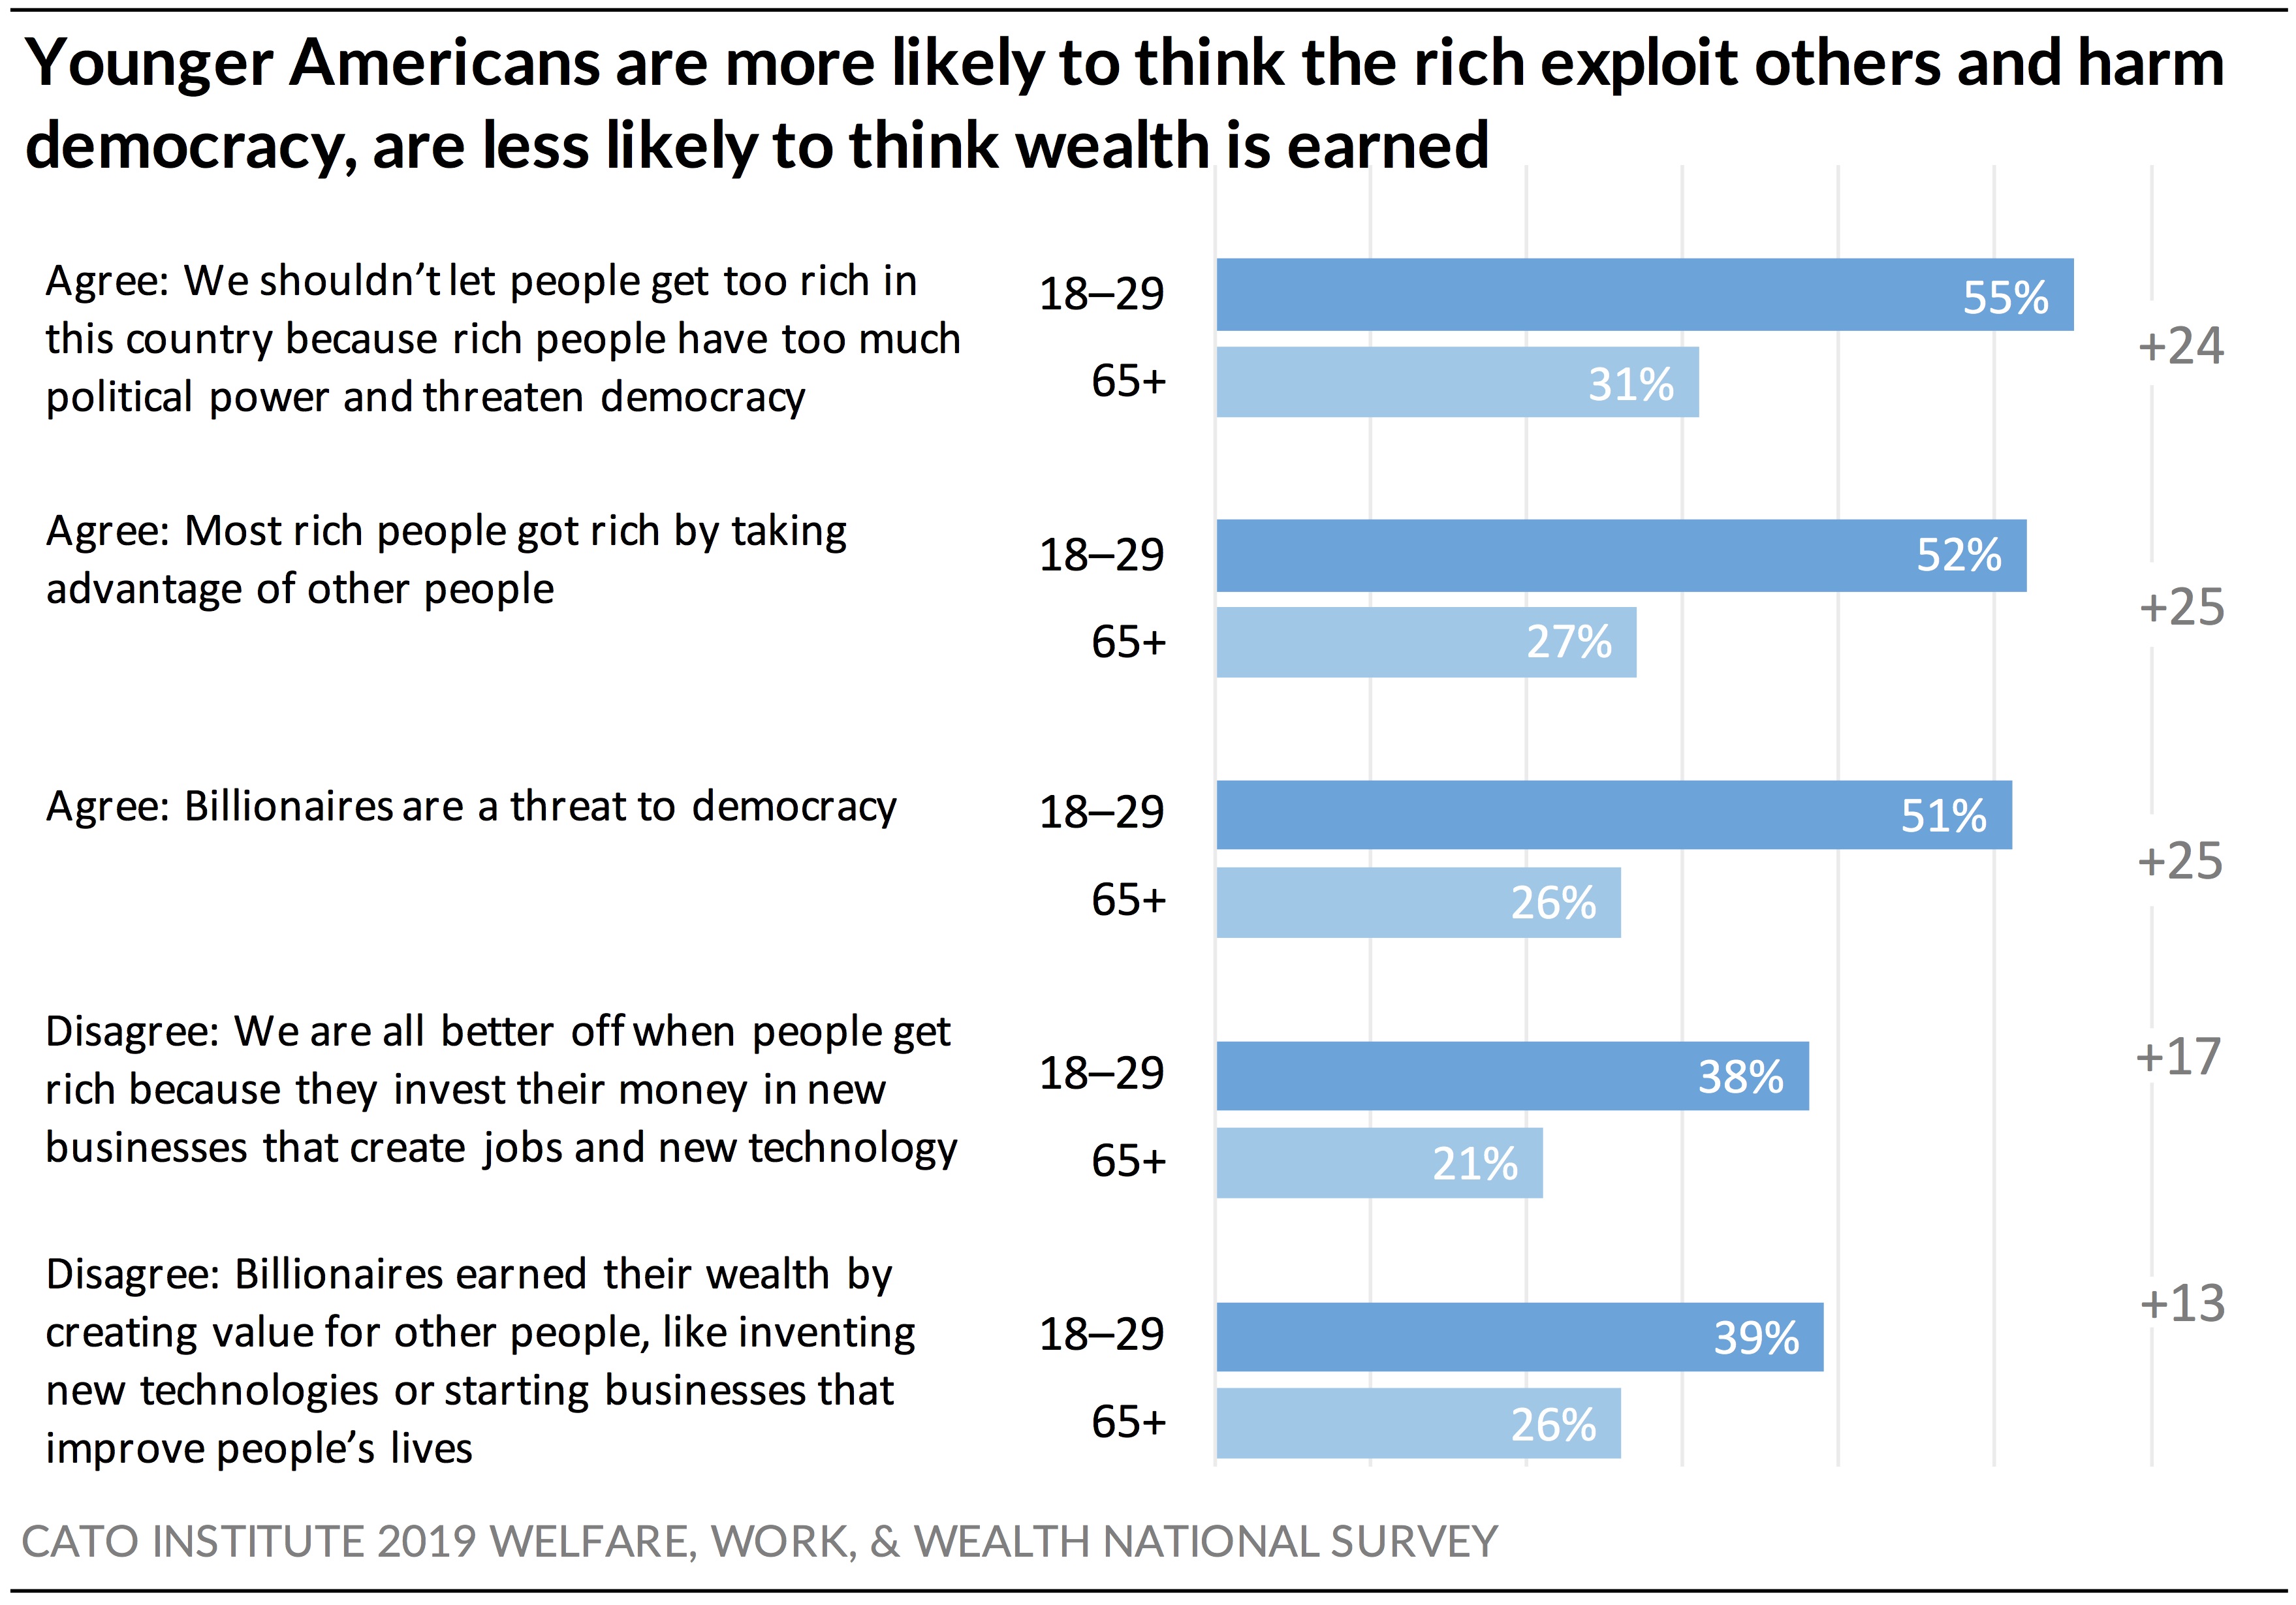
Most Americans, nearly two-thirds (62%), do not believe that “billionaires are a threat to democracy.” But a sizable minority disagree. Thirty-seven percent (37%) of Americans believe that billionaires do pose a threat to democracy. A similar share (42%) agree that “we shouldn’t let people get too rich in this country because rich people have too much political power and threaten democracy.” Nevertheless, most Americans (57%) disagree.
Overall, Americans don’t think that it’s worth restricting a person’s wealth because of the risk they might pose to the democratic process. Instead, Americans are comfortable with people getting rich. Thus, 84% believe there is “nothing wrong with a person trying to make as much money as they honestly can.”
Democrats stand out with 54% who agree that billionaires are a threat to democracy; 45% disagree. In contrast, 63% of independents and 79% of Republicans reject the claim that billionaires threaten the democratic process.
This question divides the Democratic coalition, however. Nearly two-thirds (66%) of strong liberals agree that billionaires threaten democracy compared to 48% of moderate liberals.
Young Americans ages 18–29 are also more likely to accept the claim, with 51% who believe billionaires threaten democracy, compared to 40% of those ages 30–44, a third of people ages 45–64, and 26% of seniors.
75% of Americans Say People Admire Rich People Too Much
Americans don’t resent the rich, but they do think people admire them excessively. Three-fourths (75%) agree that “people admire rich people too much.” Consistent with the American egalitarian tradition, Americans tend to believe that citizens regardless of economic class are imbued with inherent equal worth and dignity.
Majorities across partisan groups agree, including 83% of Democrats, 78% of independents, and 65% of Republicans who say people admire the rich “too much.”
23% of Americans “Feel Angry” When They Read or Hear about Rich People
Although most Americans think their fellow citizens excessively fawn over the rich, few would go so far to say that rich people make them “angry.”
About a quarter (23%) say they “feel angry” when they “read or hear about very rich people.” Three-fourths (76%) do not feel angry when they read or hear about rich people.
Democrats feel more resentment toward the rich than Republicans. In fact, Democrats (32%) are twice as likely as Republicans (14%) to say they feel angry when they read or hear about very rich people. Resentment toward the wealthy divides Democrats. Strong liberals (41%) are almost twice as likely as moderate liberals (26%) to say they feel anger when reading or hearing about the rich.
Young people are also about four times as likely as older people to feel anger toward rich people. Almost half (44%) of people under 30 say they feel angry when they read or hear about rich people, compared to 11% of those over age 65.
Notably, neither income nor education appear to drive anger toward the wealthy. Similar shares express resentment toward the rich regardless if those shares have a high school diploma or less (26%) or a post-graduate degree (25%) or earn less than $20,000 a year (24%) or more than $100,000 a year (23%).
This suggests that class cleavage doesn’t drive anger toward the wealthy as much as psychological and ideological dispositions might.
A Third of Strong Liberals Say Violence against the Rich Sometimes Is Justified
Americans don’t want to “eat the rich.” Only 17% say that “citizens taking violent action against the rich” is “sometimes justified.” Instead, 82% say it’s “never justified.”
To put this in context, a CBS/New York Times national survey found that 23% of Americans say it’s sometimes justified to take violent action against the government; 69% believe it’s never justified.13 Thus, few Americans believe violence is the solution to conflict. However, slightly more Americans may be sympathetic to fighting the government than fighting the wealthy.
Strong liberals (36%) are about twice as likely as strong conservatives (16%) to feel that violence against the rich may be justified. In fact, the issue divides the Democratic coalition. Strong liberals (36%) are more than twice as likely as moderate liberals (17%) to say violence against the wealthy may be justified.
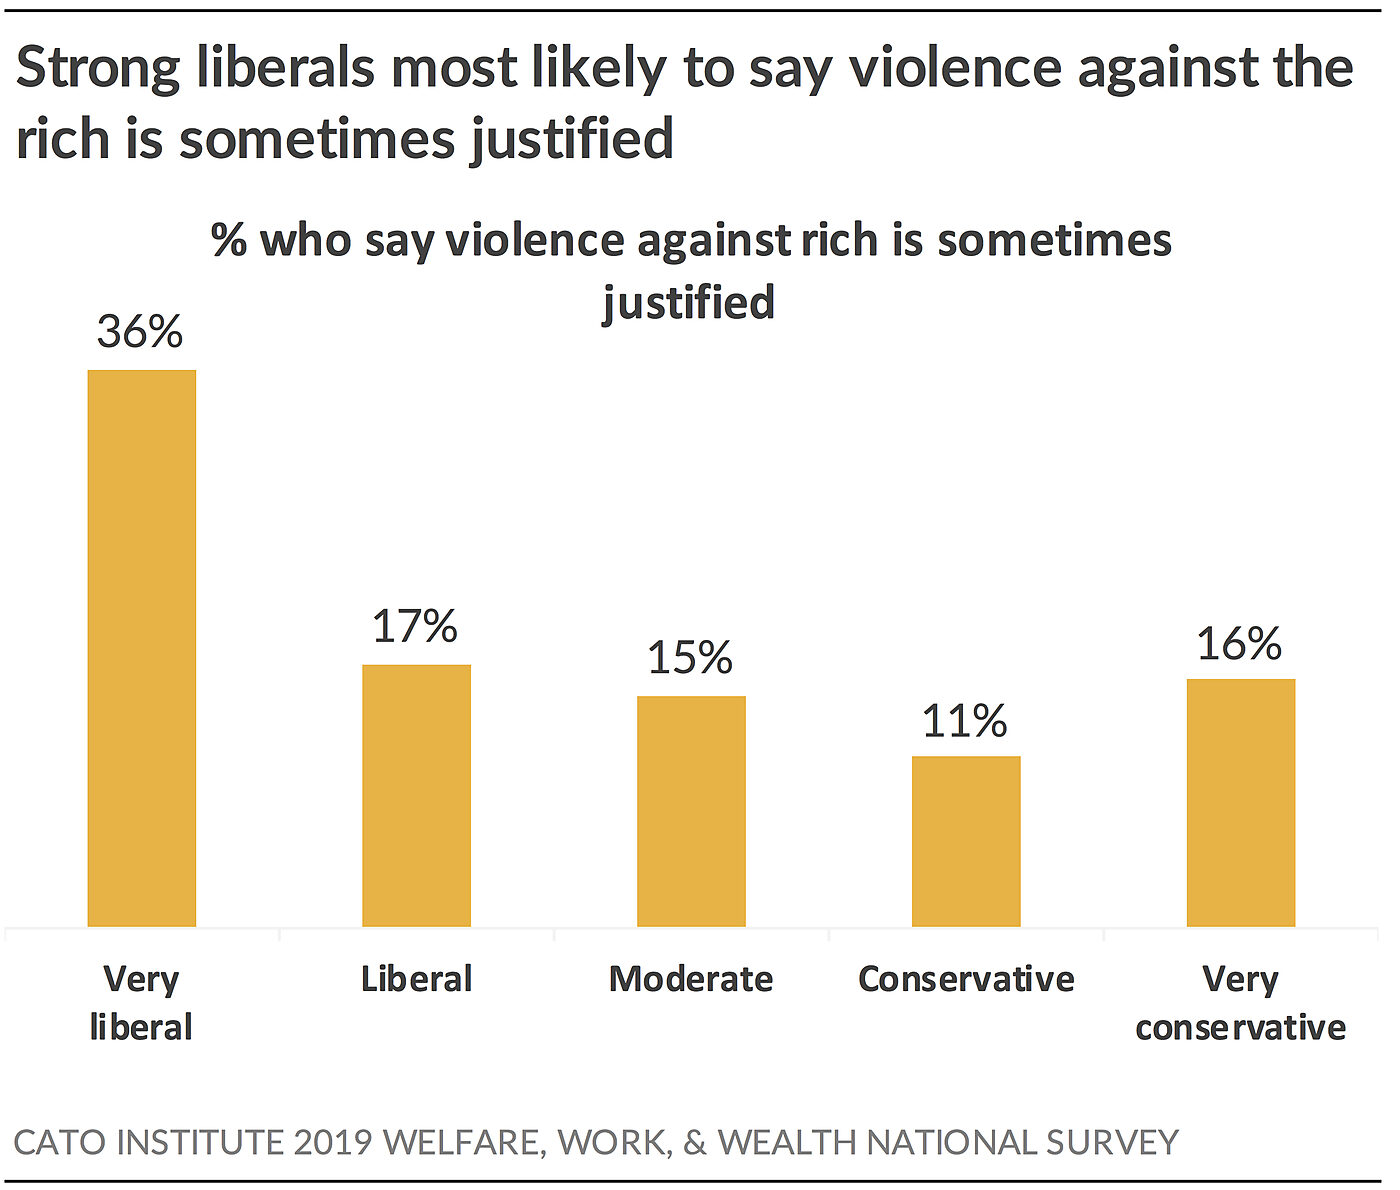
Young Americans are also more likely to support taking violent action against the rich. A little more than a third (35%) of Americans under 30 say violence against the wealthy may sometimes be justified. In contrast, this share drops to 20% among those 30–44 and to 10% among those over 45.
Socialist sympathizers are most inclined to believe that citizens taking violent action against the wealthy is sometimes warranted. Nearly half (47%) of Americans who have very favorable views of socialism believe violence against the rich is justified compared to 10% of those who have unfavorable views of socialism.
Discussion
Americans don’t want to “soak the rich” or “tax the hell out of the rich” for its own sake. Americans idealize the rich and want to join their ranks. The public believes, by and large, that most wealthy Americans earned their wealth through invention, creating jobs, or investing in the economy. Most Americans also reject the idea that rich people threaten democracy or that their wealth should be curtailed to preempt potential usurpation of the political process. These data suggest that many Americans support tax increases on higher-income people perhaps because of their perceived ability to pay rather than as a means to punish the rich.
A Closer Look at Young Americans’ Attitudes toward Capitalism, Wealth, and the Rich
Young Americans stand out from their parents and grandparents’ particularly in their attitudes toward socialism, capitalism, and resentment toward the rich. Young people also differ from older people by expressing higher levels of envy and resentment toward high achievers and lower levels of confidence in their personal agency.
Young Americans Are Equally Favorable toward Capitalism and Socialism
Young Americans under age 30 stand out from their elders with their relative ambivalence toward capitalism and much greater support for socialism. Barely half of Americans under 44 have favorable views of capitalism compared to 58% of those ages 45–54, 65% of people ages 55–64, and 76% of seniors (ages 65+). In reverse fashion, 50% of Americans under 30 have favorable views of socialism, compared to 43% of those 30–44, and a third of Americans over age 45.

Young Democrats Are Far More Supportive of Bernie Sanders
Consistent with attitudes toward capitalism and socialism, young Democrats are about three times more likely to support self-described democratic socialist Sen. Bernie Sanders (I‑VT) for the Democratic nomination for president. As of spring 2019, 40% of under-30 Democrats supported Bernie Sanders compared to 14% of Democrats over age 65. In reverse, older Democrats were nearly three times as likely as younger Democrats to prefer that former Vice President Joe Biden be the party’s nominee (28% vs. 11%).
Young Americans Feel More Resentment toward the Rich
Young Americans are the only cohort in which a majority believe the wealthy didn’t earn their wealth. A slim majority (52%) of Americans under 30 say that “most” rich people in the United States got rich “by taking advantage of other people.” In contrast, a strong majority (72%) of seniors (65+) say that most wealthy people in America “earned their wealth” without exploiting people.
Across the board, younger people are more likely than older people to hold negative attitudes toward the rich. Americans under 30 are about 20–35 points more likely than Americans age 65 and older to feel “angry” when they read or hear about rich people (44% vs. 11%), to feel more “resentment” than “admiration” of rich people (39% vs. 16%), to believe it’s “immoral” for society to allow people to become billionaires (39% vs. 13%), and to believe that citizens taking violent action against the rich is sometimes justified (35% vs. 10%). Young people are also about 10–25 points more likely than older people to believe billionaires are a threat to democracy (51% vs. 26%), to disagree that billionaires earned their wealth by creating value for others (39% vs. 26%), and to disagree that rich people make society better off by investing in new businesses that create jobs and invent technology (38% vs. 21%).
Young People Are More Supportive of Taxes on the Rich
Consistent with these findings, young people are also more supportive than older Americans of raising taxes on the rich. Wealth redistribution produces the greatest age gap. Americans under 30 are the only age cohort with a majority (53%) in favor of redistributing wealth from the rich to the poor. In contrast, 20% of Americans 65 and over agree.


Young Americans are also nearly 20 points more likely than older Americans to support raising top marginal tax rates. Nearly two-thirds (62%) of young Americans favor raising the top marginal tax rate on income over $10 million to 70%, while less than half (43%) of seniors favor the policy. Instead, a majority (55%) of those 65 and over oppose returning top marginal tax rates to 70%.
Are young people today unique? Perhaps not. A General Social Survey conducted in 1978 found that Americans under 30 were also more supportive of wealth redistribution. At that time, Americans under 30 were the only age cohort in which a majority (54%) supported the government “reducing income differences between rich and poor” by “raising the taxes on wealthy families or by giving income assistance to the poor.” In contrast, only about a third (36%) of Americans 65 and over agreed.
Attitudes toward the Poor
Seventy percent (70%) of Americans express favorable feelings toward poor people, 8% have unfavorable feelings, and 21% have neither favorable nor unfavorable feelings.14
Majorities of Republicans (65%), Democrats (78%), and independents (64%) have favorable feelings toward poor people in the United States. Few have unfavorable feelings: 10% of Republicans, 6% of Democrats, and 11% of independents.
The survey asked respondents to rate their feelings toward rich and poor people respectively on a scale of 0 to 100, in which 0 indicates they feel as cold and unfavorable as possible and 100 indicates they feel as warm and favorable as possible. Favorable attitudes were defined as scores 52–100, unfavorable attitudes were defined as scores 0–48, and neutral attitudes were defined as scores 49–51. On average, on a scale of 0–100, Americans rated the rich a 51 and the poor a 70.
Americans Don’t Dislike the Rich; They Are More Sympathetic toward the Poor
Not surprisingly, Americans have more sympathetic feelings toward the poor than they do the rich: 70% have favorable views of the poor while 46% have favorable views of the rich. Nevertheless, more people like the rich (46%) than dislike the rich (32%). Almost a quarter have neutral feelings toward the rich (22%) and the poor (21%).
Democrats Dislike the Rich but Like the Poor; Republicans Like Both
Stereotypically, Republicans are believed to be the party of the rich (because they usually oppose tax increases on the rich) and the party against the poor (because they usually oppose expansions of social services). However, Republicans express similarly favorable views of both the rich (59%) and the poor (65%) with slightly better views of the poor. Thus, Republicans rate rich and poor about the same.
Democrats, however, make a distinction, being much more favorable toward the poor than the rich. Only a third (35%) of Democrats have favorable views of the rich; in fact, a plurality (47%) have negative views of them. In stark contrast, 78% have favorable views of the poor.
This helps explain why Republicans have been viewed as the party of the rich and Democrats the party of the poor, because Democrats have such disparate views of rich and poor and Republicans are relatively more favorable of the rich and relatively less favorable of the poor.
71% of Americans Say They Volunteered or Donated to Charity in Past Year
Nearly three-fourths (71%) of Americans say that in the past year they volunteered their time or donated money, food, or clothing to charity or a community group. About a quarter (28%) neither volunteered nor donated to charity.
Partisans are about equally likely to have volunteered or donated, but Republicans (75%) are slightly more likely than Democrats (68%) and independents (70%).
Volunteer work and charitable giving is not just for the wealthy. Half (50%) of people earning less than $20,000 a year have volunteered or donated in the past year. This share rises to 66% among those earning $20,000 to $39,999, 72% of those earning $40,000 to $59,999, and about 82% for those earning $60,000 or more a year. Thus, charitable giving is an American middle-class endeavor as well.
What Motivates Attitudes toward Capitalism, Socialism, Billionaires, Welfare, and Tax Policy?
With the 2020 presidential election around the corner, a variety of candidates and lawmakers have proposed a number of new tax increases on the wealthy as well as expansions of government social services. For instance, presidential hopefuls and new lawmakers have proposed returning the top marginal tax rate to 70%, levying wealth taxes, or “taxing the hell out of the wealthy,” as New York City Mayor Bill de Blasio put it.15 Sen. Elizabeth Warren (D‑MA) told voters that they could attribute frustrations in their lives to the rich and powerful: “You’ve got things that are broken in your life; I’ll tell you exactly why. It’s because giant corporations, billionaires have seized our government.”16 Others have claimed that capitalism is “irredeemable” and a system that “allows billionaires to exist” is “immoral.”17 Concomitantly, many have also noticed the uptick in support for socialism as well as the increasing popularity of candidates affiliating with the “democratic socialist” moniker.18
Supporters contend their motivation is compassion for the dispossessed. However, with such a rhetorical focus on the rich and powerful, critics ask if the motivations are simply about compassion or whether envy and resentment also play a role.To find out, the survey asked respondents to answer several batteries of questions that psychologists have developed to measure dispositional compassion, envy, and resentment of high achievers, respectively. These questions don’t mention politics or policy or even the rich specifically. This section analyzes which of these motivations better predicts policy opinions. First, levels of compassion, envy, and resentment among all Americans are examined. Then statistical tests are employed to determine which of these emotions best predicts policy attitudes.
How Compassionate Are Americans?
Americans were asked to what extent they agree or disagree with the following statements that were developed by psychologists to measure a person’s level of compassion.19 Agreement with the first three statements and disagreement with the latter four statements indicates a higher level of compassion. Answers to these seven questions were averaged together into a Dispositional Compassion Index (DCI). (See Appendix C for further information.)
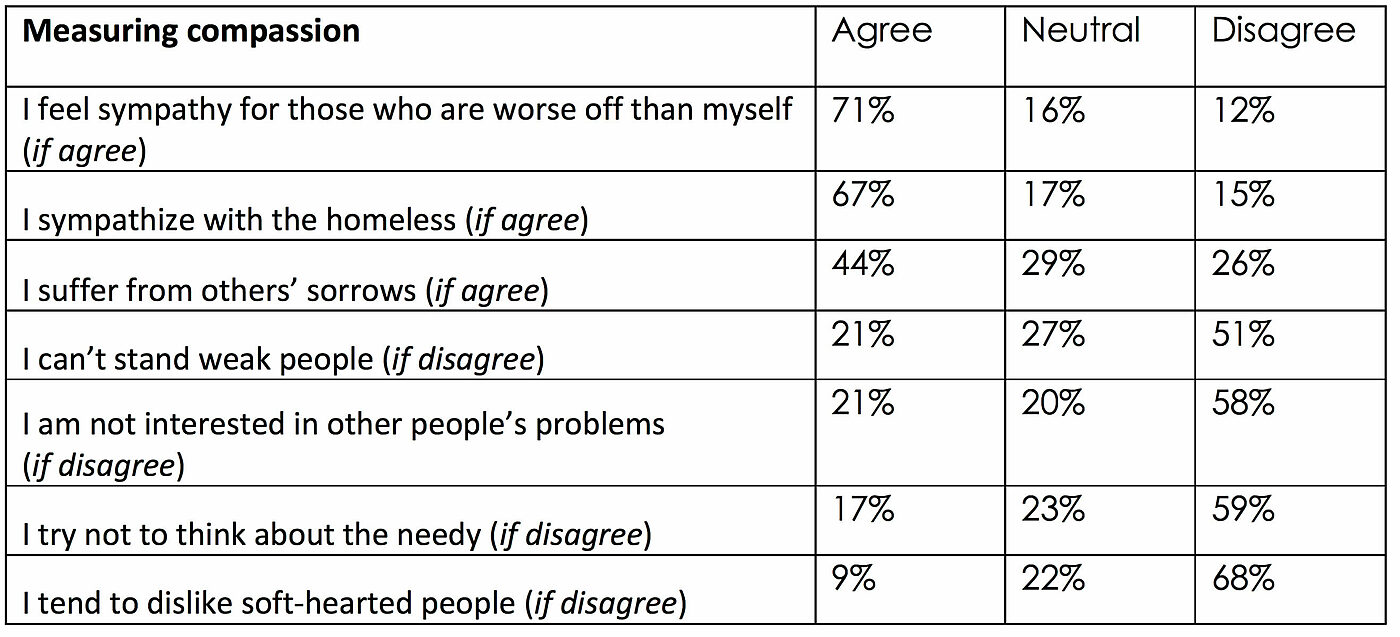
Liberals and conservatives both express compassion for others; however, liberals express more empathy on average than conservatives. Most notably, 57% of strong liberals say they “suffer from others’ sorrows” compared to 38% of strong conservatives. Also, 86% of strong liberals say they feel sympathy for the worse off compared to 63% of strong conservatives. As the chart shows, liberals are more likely than conservatives to provide the empathetic response on each of the seven questions.
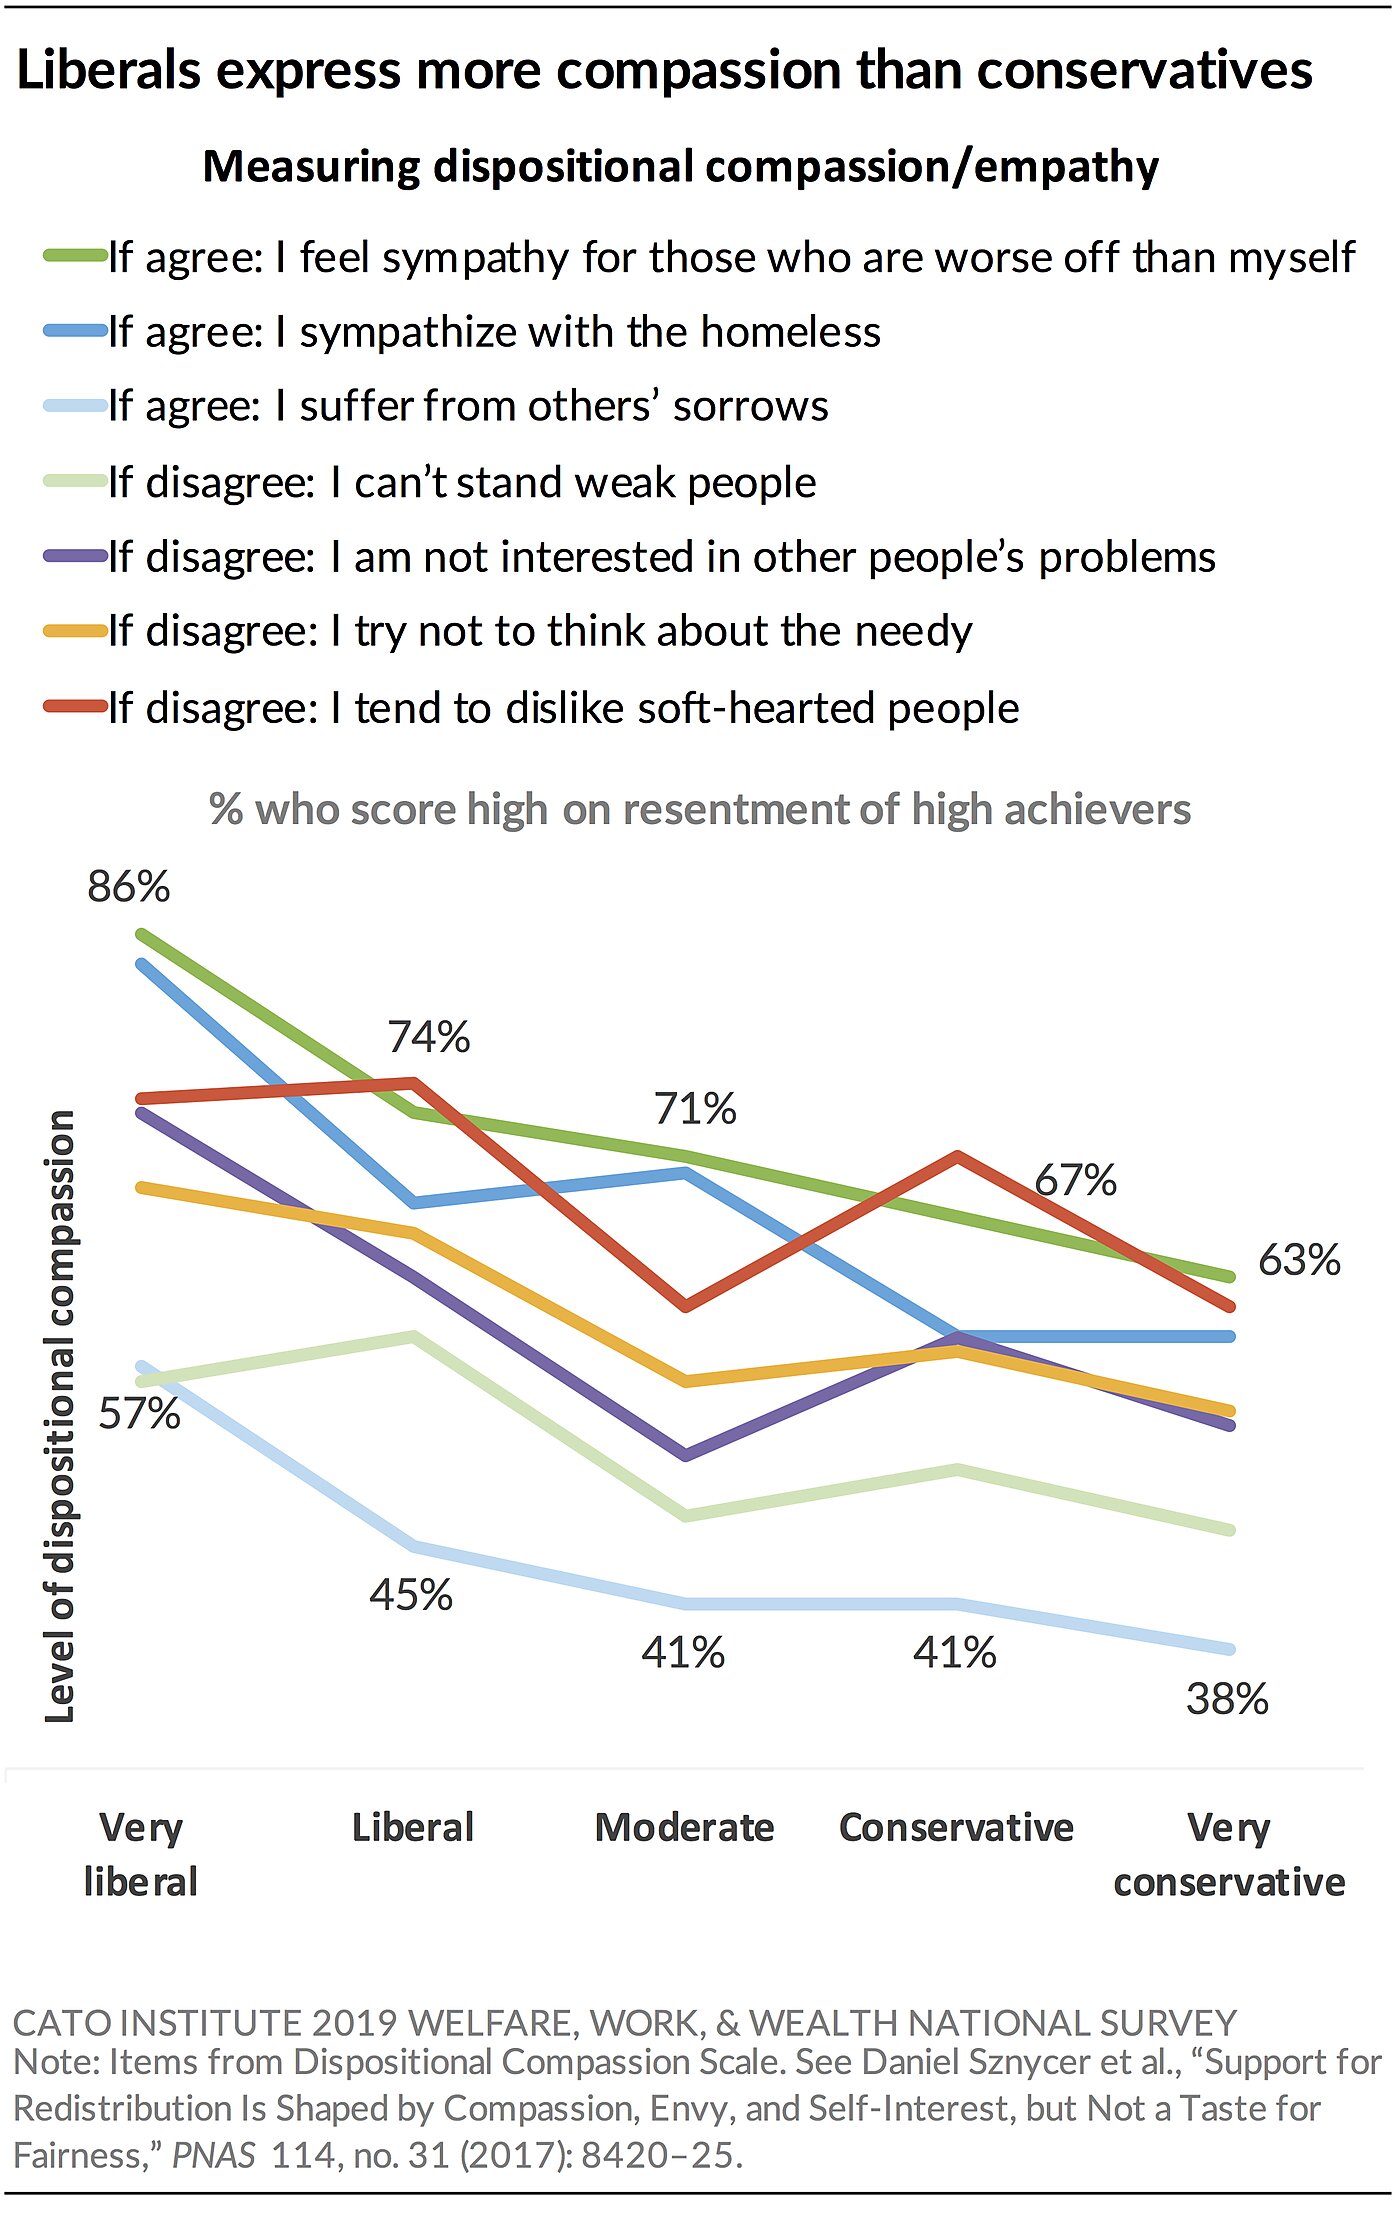
Several interesting demographic differences stand out. Women tend to score higher on the Dispositional Compassion Index (DCI) than men (52% vs. 36% score above average). Americans with more education also tend to score higher than those with less education. For instance, 50% of those with post-graduate degrees have above average empathy scores compared to 37% with a high school degree or less. Atheists and agnostics (62%) are more likely to score above average than those who identify with a religious tradition like Protestants (47%) or Catholics (36%).
Despite differences in dispositional compassion, atheists, agnostics, Protestants, and Catholics were all about equally likely to have volunteered or donated to a charitable cause in the past year. This indicates that compassion doesn’t necessarily drive differences in charitable activity.
How Envious Are Americans?
The survey also asked to what extent respondents agree or disagree with the following statements that were developed by psychologists to measure one’s dispositional envy.20 Agreement with the statements indicates a higher level of envy. Answers to these questions were averaged together into a Dispositional Envy Index (DEI). (See Appendix D.)
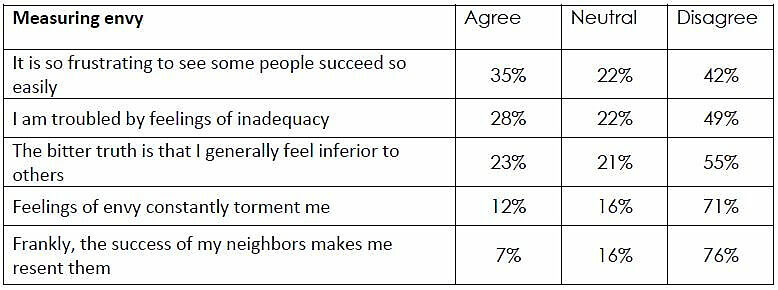
Both liberals and conservatives report experiencing feelings of envy. However, liberals express more envy on average than conservatives. Strong liberals (48%) are nearly twice as likely as strong conservatives (25%) to agree that “it is so frustrating to see some people succeed so easily.” As the chart shows, strong liberals are more likely than conservatives to provide the envious response on each of the five questions.
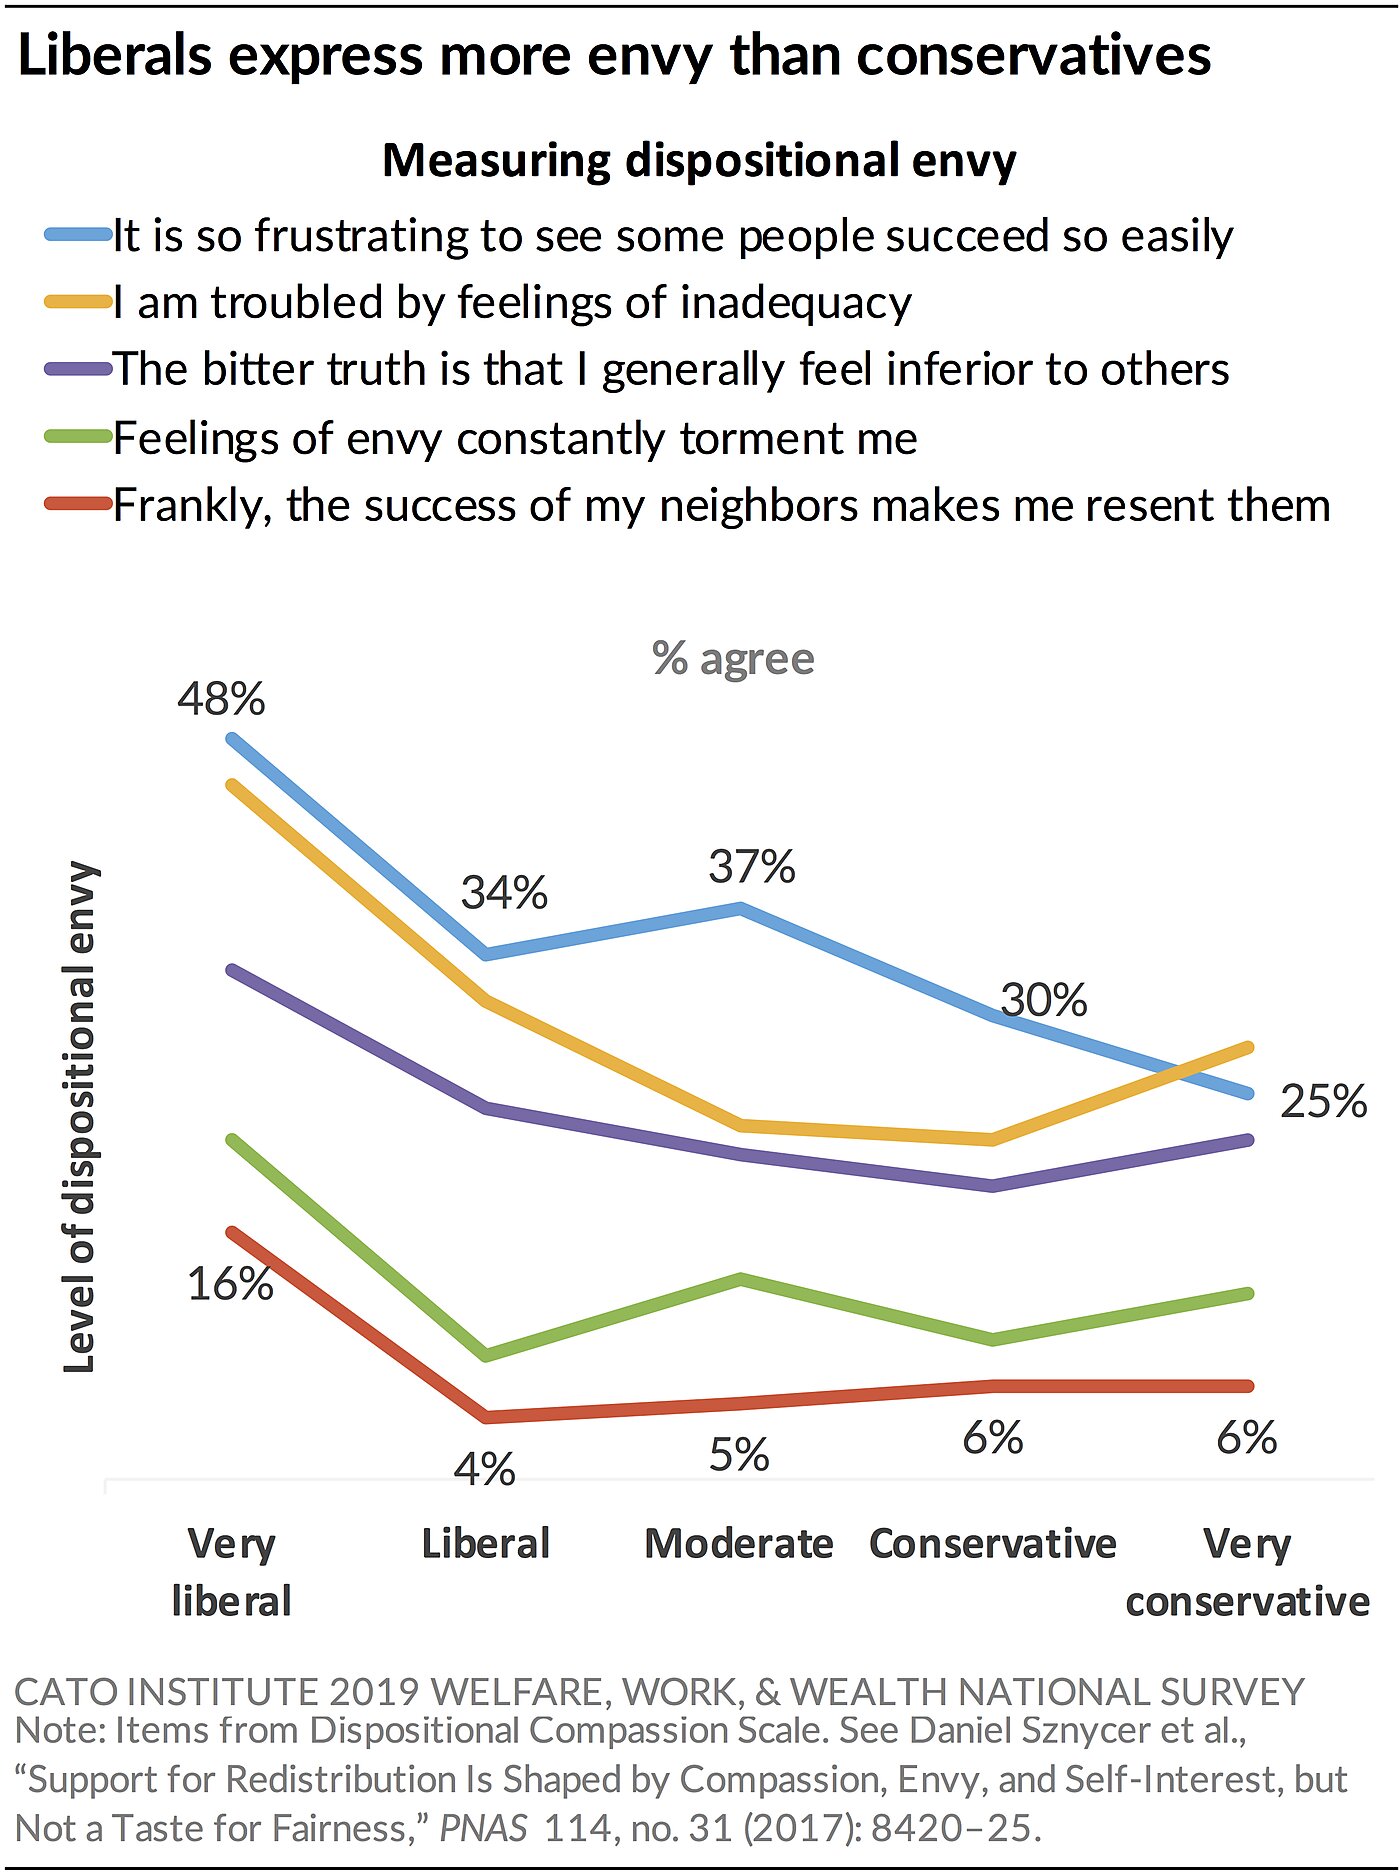
Young people are considerably more likely than older people to score higher on the Dispositional Envy Index (DEI). For instance, 69% of Americans under 30 score above average compared to 28% of those over 55. Atheists and agnostics (57%) are more likely to express above average feelings of envy than people from other religious traditions, such as Protestants (41%) and Catholics (44%).
People who feel a lack of personal agency may be more likely to feel frustrated with other’s successes. Those who score low on the Belief in Personal Agency Index (BPAI) are 35 points more likely than those who score high to score above average on envy (64% vs. 29%). Instead, people who have a strong belief in personal agency express below average feelings of envy (71%). (See Appendix A for more information about the BPAI.)
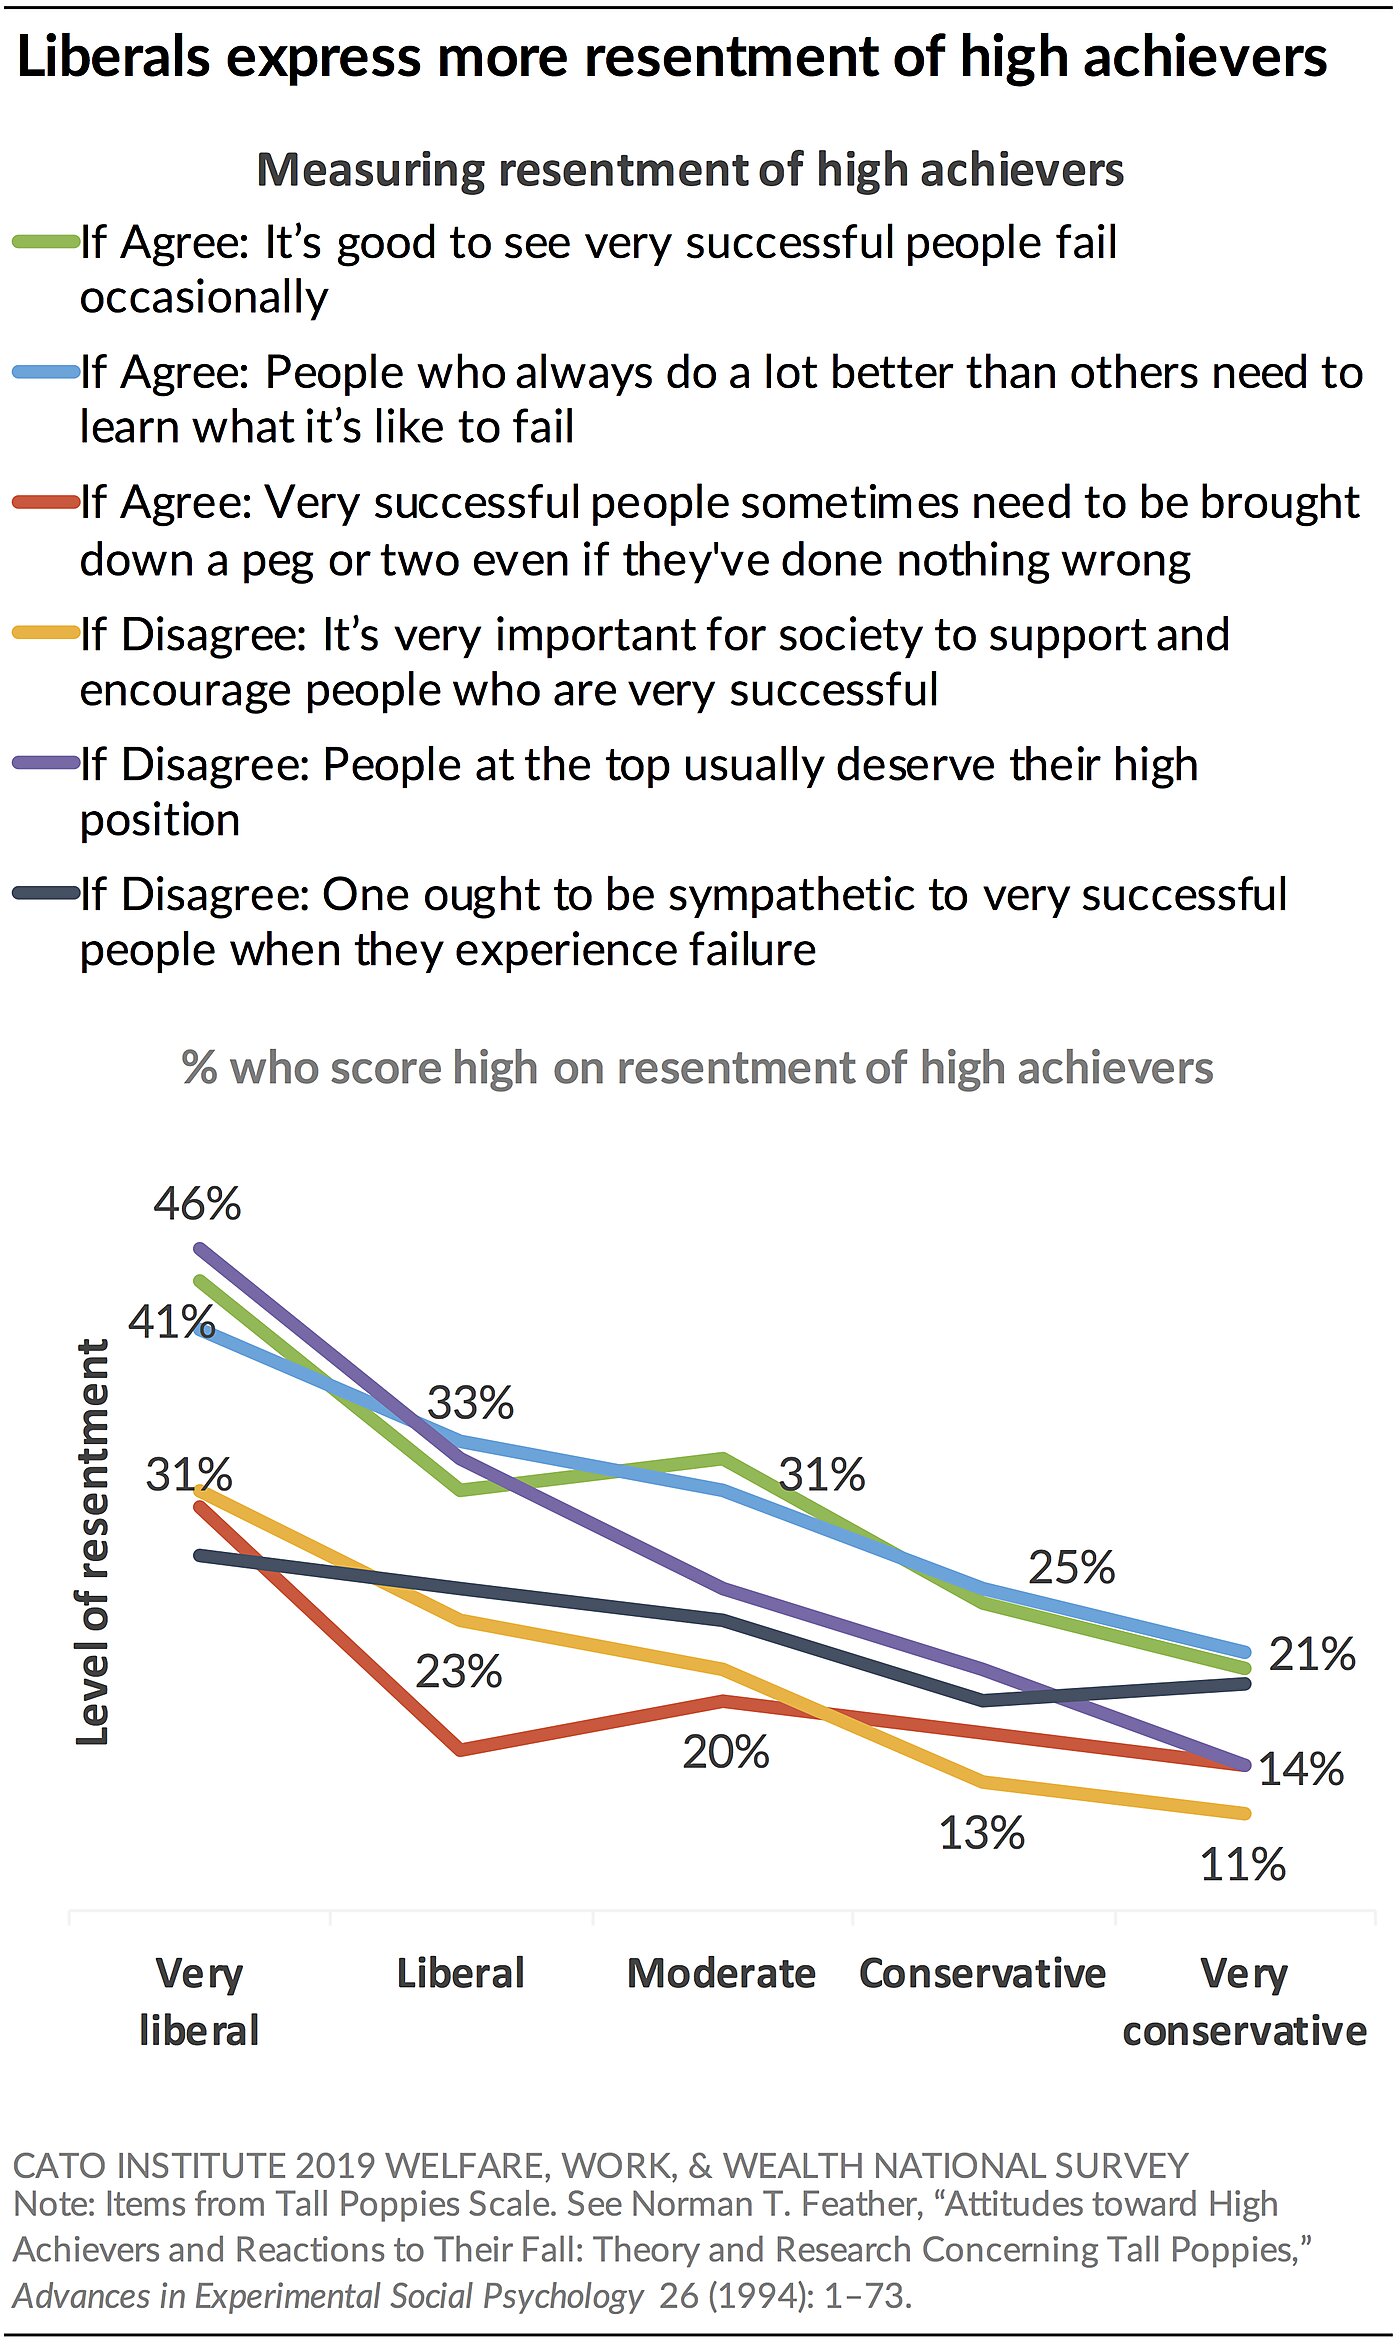
How Resentful Are Americans of High Achievers?
Americans were asked to what extent they agree or disagree with the following statements that were developed by psychologists to measure attitudes toward successful people (e.g., “tall poppies”). Agreement with the first three statements and disagreement with the latter three statements indicates a higher level of resentment toward high achievers. Answers to these seven questions were averaged together into a Resentment of High Achievers Index. (See Appendix E.)
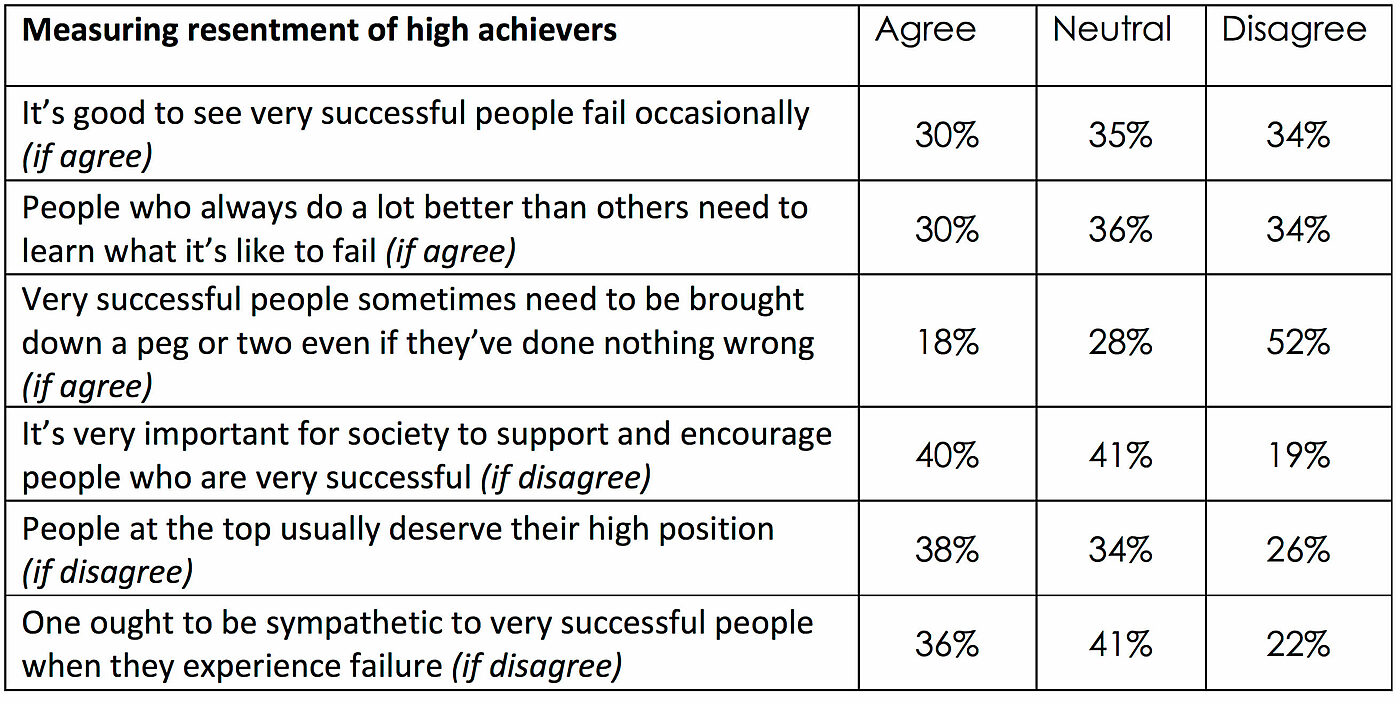
Liberals and conservatives both report some feelings of resentment toward the successful. However, liberals express more resentment on average than conservatives. Strong liberals are more than twice as likely as strong conservatives to agree that “it’s good to see very successful people fail occasionally” (44% vs. 20%), to agree that “people who always do a lot better than others need to learn what it’s like to fail” (41% vs. 21%), and to say that “very successful people need to be brought down a peg or two even if they’ve done nothing wrong” (30% vs. 14%). Strong liberals are also about three times as likely as strong conservatives to disagree that it’s “important for society to support and encourage people who are very successful” (31% vs. 11%) or to disagree that “people at the top usually deserve their high position” (46% vs. 14%).
As the chart shows, although both liberals and conservatives express some resentment toward high achievers, liberals are more likely than conservatives to provide the resentful response on each of the six questions.
Young people are considerably more likely than older people to score higher on the Resentment of High Achievers Index. For instance, 54% of Americans under 30 score above average compared to 31% of those 65 and over. Atheists and agnostics (64%) are more likely to express above average feelings of resentment compared to people from religious traditions, such as Protestants (35%) and Catholics (48%).
Which Matters More: Resentment or Compassion?
Statistical tests indicate that compassion, envy, and resentment of high achievers likely shape attitudes people have toward capitalism, socialism, welfare, and taxes. Envy is highly correlated with resentment of high achievers with the latter being a larger and more significant predictor of attitudes than envy. Thus, the effects of resentment toward high achievers and compassion were compared in regression models. The following statistical tests account for the effects of gender, age, race, income, education, and partisanship. (See Appendix F for full results.)
Socialism and Capitalism Statistical tests (ordinary least squares [OLS] regression) find that both resentment of high achievers and compassion for the needy largely and significantly predict favorable views of socialism (see Appendix F). However, when it comes to antipathy toward capitalism, resentment of high achievers is a significantly larger predictor than is compassion. (In the chart, the blue line is steeper than the red line.)
In other words, it is likely that both compassion and resentment of high achievers are equally powerful motives behind support for socialism. This doesn’t mean that everyone is motivated by both, but some socialist sympathizers are motivated by compassion, others by resentment, and others by both. But hostility toward capitalism likely has more to do with resentment of high achievers than compassion for the needy. These results suggest that one can tell the resentful from the compassionate not so much by their support for socialism but by their attitudes toward capitalism.
Thus, statistically speaking, if a person speaks disparagingly of capitalism, they are more likely motivated by resentment. But if a person speaks approvingly of socialism, they likely could be motivated by either compassion or resentment.
Tax Policy Opinion Statistical tests (OLS regression) find that resentment of the successful is a much larger predictor than compassion of support for raising taxes on households earning more than $200,000 a year, raising top marginal tax rates, and redistributing wealth from the rich to the poor. (See Appendix F.) (The blue line is steeper than the red line in each of the charts.) But compassion for the needy is also a significant predictor.
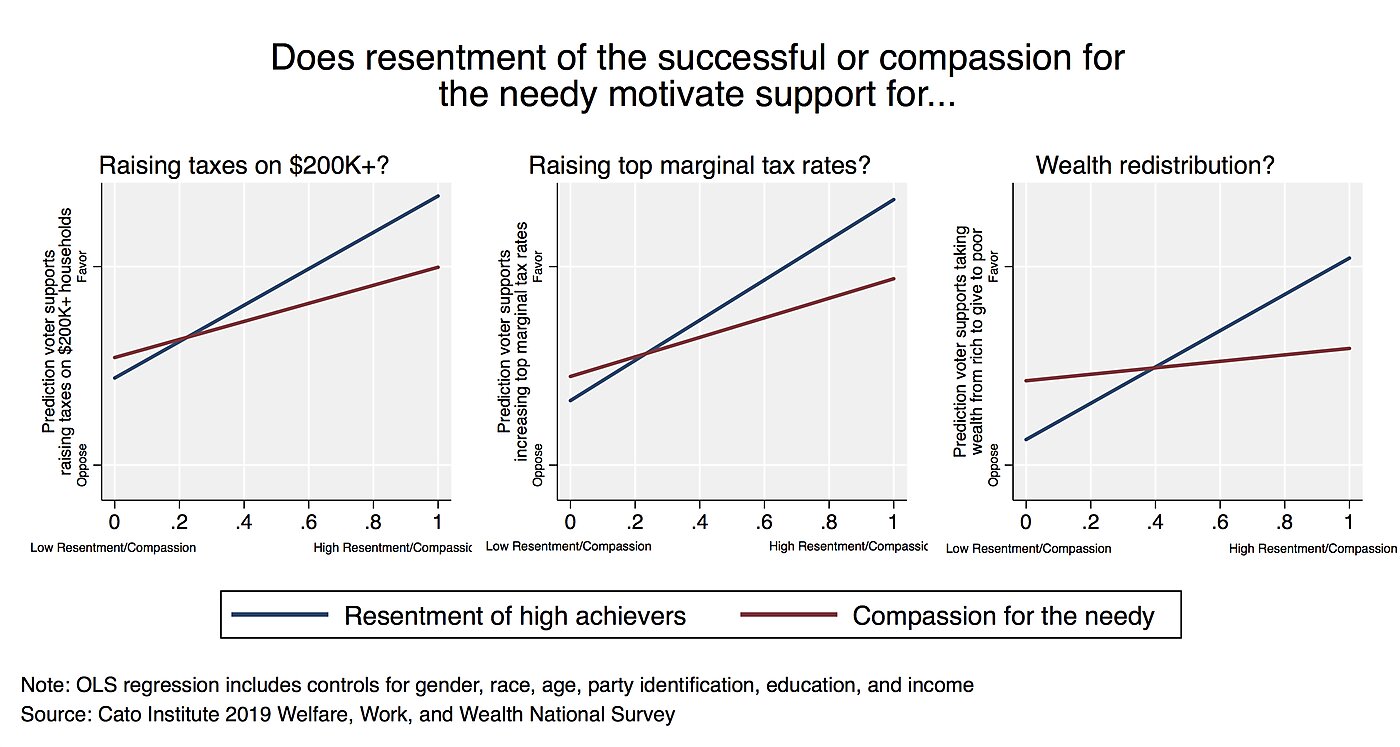
These data imply that those who support these types of tax proposals may be motivated by resentment or compassion. However, they are more likely to be motivated by resentment.
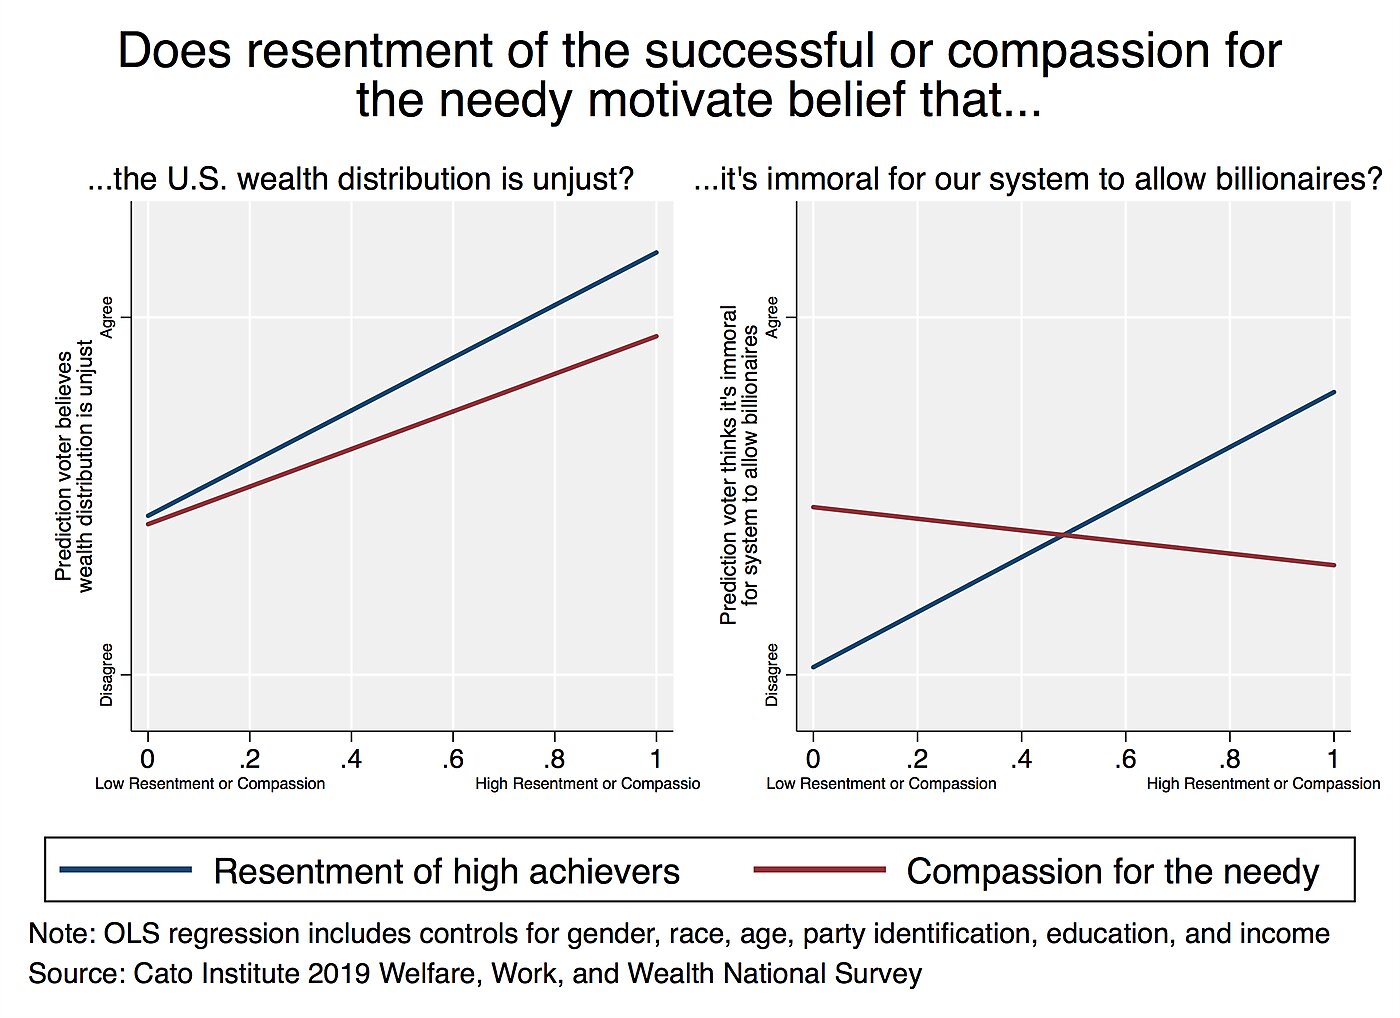
Billionaires and Inequality Another series of statistical tests (OLS regression) investigate motivations behind the beliefs that it’s immoral for our system to allow the creation of billionaires and that the U.S. wealth distribution is unjust.
The results indicate that resentment of high achievers, not compassion, best predicts the belief that billionaire creation is immoral. In fact, more compassionate people are significantly less likely to agree with the sentiment.
Both resentment of high achievers and compassion for the needy are significant predictors of the belief that the U.S. wealth distribution is unjust. However, resentment is a significantly larger predictor.
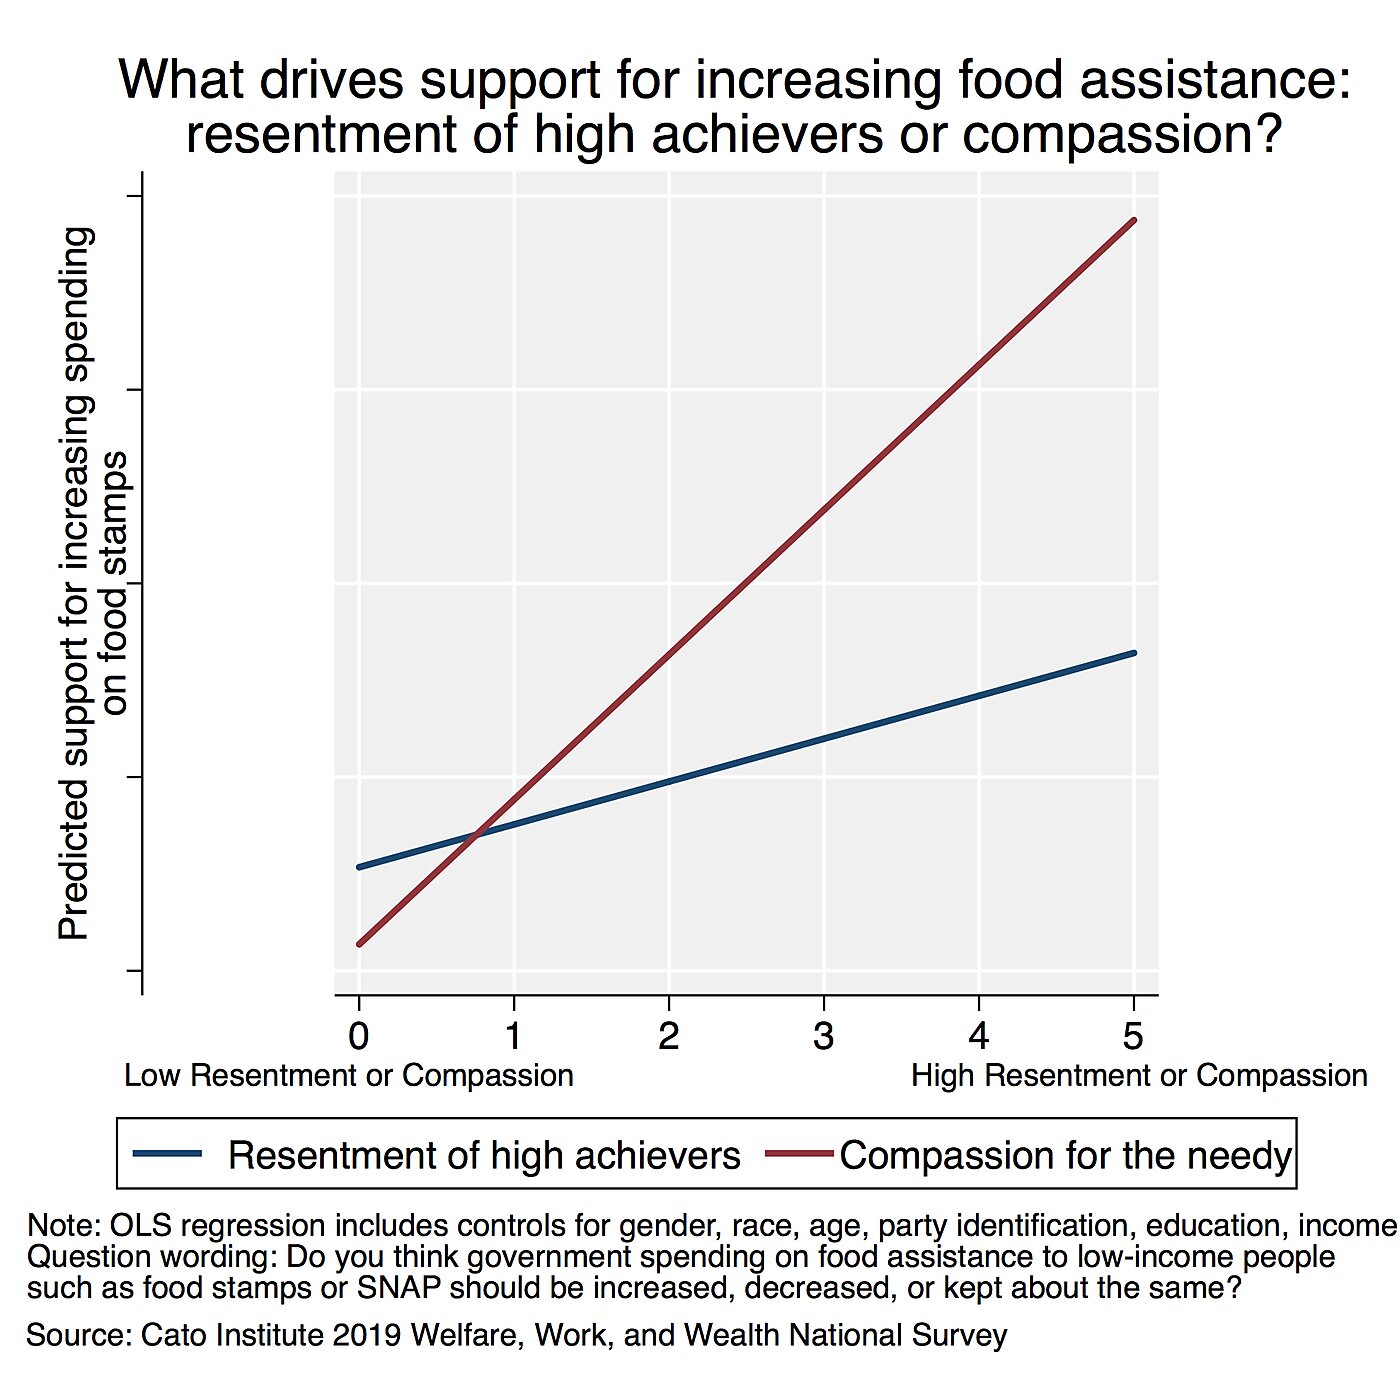
Social Services Statistical tests (OLS regression) find that compassion is a much larger predictor than resentment for supporting more government spending on food assistance. (See Appendix F.) (The red line is steeper than the blue line in the chart.) But resentment of the successful is also a significant predictor.
Implications
While surveys cannot read minds, these data suggest that Americans supportive of expanding social services may be motivated primarily by compassion for the vulnerable and somewhat by resentment toward the successful. However, antipathy toward capitalism and the rich and support for raising taxes directed at the rich are likely motivated primarily by resentment and somewhat by compassion.
Attitudes about Work, Savings, and Achievement
80% of Americans Say Hard Work Is Its Own Reward
Many may remember a weekend afternoon of chores or yard work when their parents insisted: “hard work is its own reward.” Although few know the origins of this saying, the survey set out to find how many Americans endorse the principle that work contains inherent value.
Eighty percent (80%) of Americans agree that “hard work is its own reward.” The commitment to hard work remains central to the American ethos. Most Americans regardless of demographics endorse the principle, including 85% of Republicans, 78% of independents, and 75% of Democrats; majorities of White (81%), Black (80%), Latino (78%), and Asian (70%) Americans; and people making less than $20,000 a year (81%) and more than $100,000 a year (78%).
Nevertheless, Americans differ in their enthusiasm for the principle. Republicans are about 20 points more likely than Democrats to “strongly agree” that hard work is its own reward (50% vs. 33%). Similarly, Americans 65 and over (50%) are 19 points more likely than Americans under 30 (31%) to strongly agree.
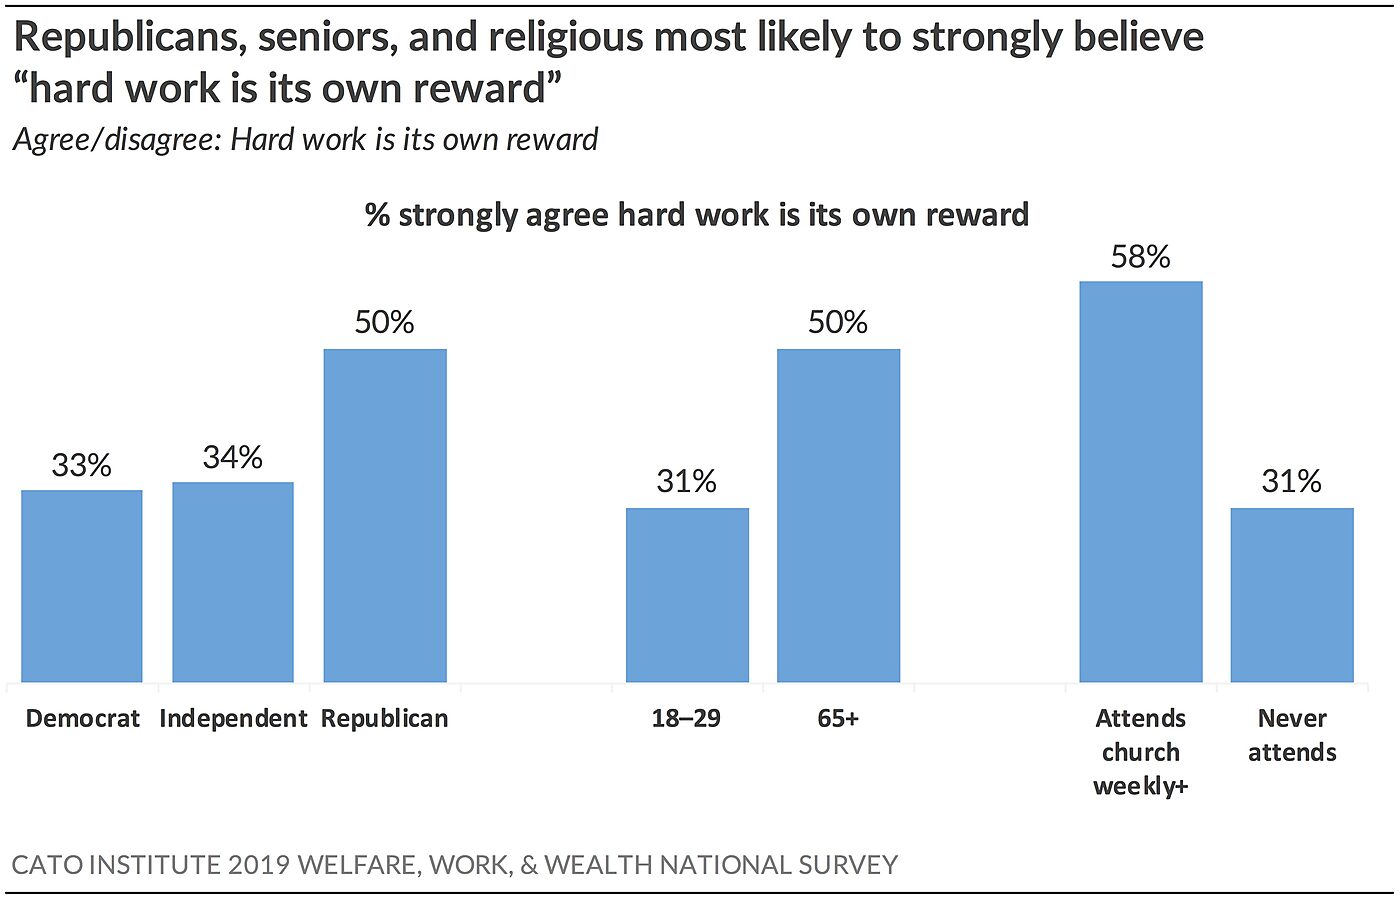
Religious belief may also play a role. Regular churchgoers (58%) are nearly 30 points more likely than those who never attend (31%) to strongly agree hard work is its own reward. While the origins of the saying are unclear, many believe it’s central to the so-called Protestant work ethic. But Protestants aren’t the only ones who strongly endorse the principle. Both Catholics (51%) and Protestants (46%) strongly agree that work has inherent worth. Nonreligious people, however, including atheists (11%) and agnostics (26%), are less likely to strongly agree.
Republicans Prioritize Fulfilling Obligation; Democrats Prioritize Seeking Personal Satisfaction
Americans are divided about whether it is more important to them to fulfill one’s obligations or to seek personal fulfillment. A slim majority (52%) say it’s more important for them to “work hard and do what is expected of you,” while 47% say it’s more important for them to do things that “give you personal satisfaction and pleasure.”
Partisans are starkly divided. Nearly two-thirds (65%) of Republicans say it’s more important in their own lives to work hard and do what is expected of them. In contrast, a solid majority (57%) of Democrats say it’s more important for them to pursue things that give them personal satisfaction and pleasure. Ideological differences are even more pronounced. Two-thirds (66%) of strong liberals say it’s more important to pursue pleasure and satisfaction while about two-thirds (65%) of strong conservatives say working hard and doing what is expected of them is more important.
Younger people, especially those under 45, are more likely to prioritize personal fulfillment while those over 45 say it’s more important to fulfill obligations. Fifty-three percent (53%) of Americans ages 18–44 say they prioritize the pursuit of personal satisfaction and pleasure. People ages 45–54 are evenly divided. Sixty-percent (60%) of those over 55 say that working hard and doing what’s expected of them matters more.
These results are remarkably similar to a Los Angeles Times survey from 30 years ago. In 1989, most young Americans under 45 said they prioritized personal fulfillment over working hard and obligations (50% vs. 44%). However, a majority of Americans over 55 said working hard and doing what’s expected of them mattered more (57%) than pursuing personal satisfaction and pleasure (35%). Those in the young 1989 cohort who prioritized personal satisfaction then are about 50–75 years old today and now say hard work and fulfilling obligation matter more. This suggests that Americans change their minds about what’s more important as they get older.
Attitudes toward obligation and personal fulfillment are related to views of capitalism and socialism. Americans very favorable to capitalism (65%) say it’s more important to work hard and do what’s expected of them. Conversely, Americans very favorable toward socialism (59%) say it’s more important to seek personal satisfaction and pleasure.
Perhaps some are drawn to capitalism or socialism based on their personal expectations: seeking personal fulfillment or to fulfill obligation. If one prioritizes hard work and obligation, perhaps they are drawn to a capitalist system because that system would reward production and hard work. But if one prioritizes pursuing personal satisfaction, perhaps they are drawn to a socialist system because it would provide for their needs irrespective of what they produce, thereby offering the autonomy to pursue endeavors that provide personal satisfaction.
64% of Americans Would Move to Another State to Find a Job
Americans are a mobile people. Nearly two-thirds (64%) say they’d be willing to move to another state to find a job if they were looking for one. About a third (35%) would not be willing to move to another state to find work even if they needed a job.
Higher-income people are more likely than lower-income people to be willing to move to another state to find a job. Four in 10 (43%) of current welfare recipients say they’d be unwilling to move compared to 32% of nonrecipients. Among those earning less than $20,000 a year, 42% would be unwilling to move to another state to find a job compared to 22% of those earning more than $200,000 a year. Nevertheless, majorities across all income groups say they’d be willing to relocate out of state if they were looking for a job.
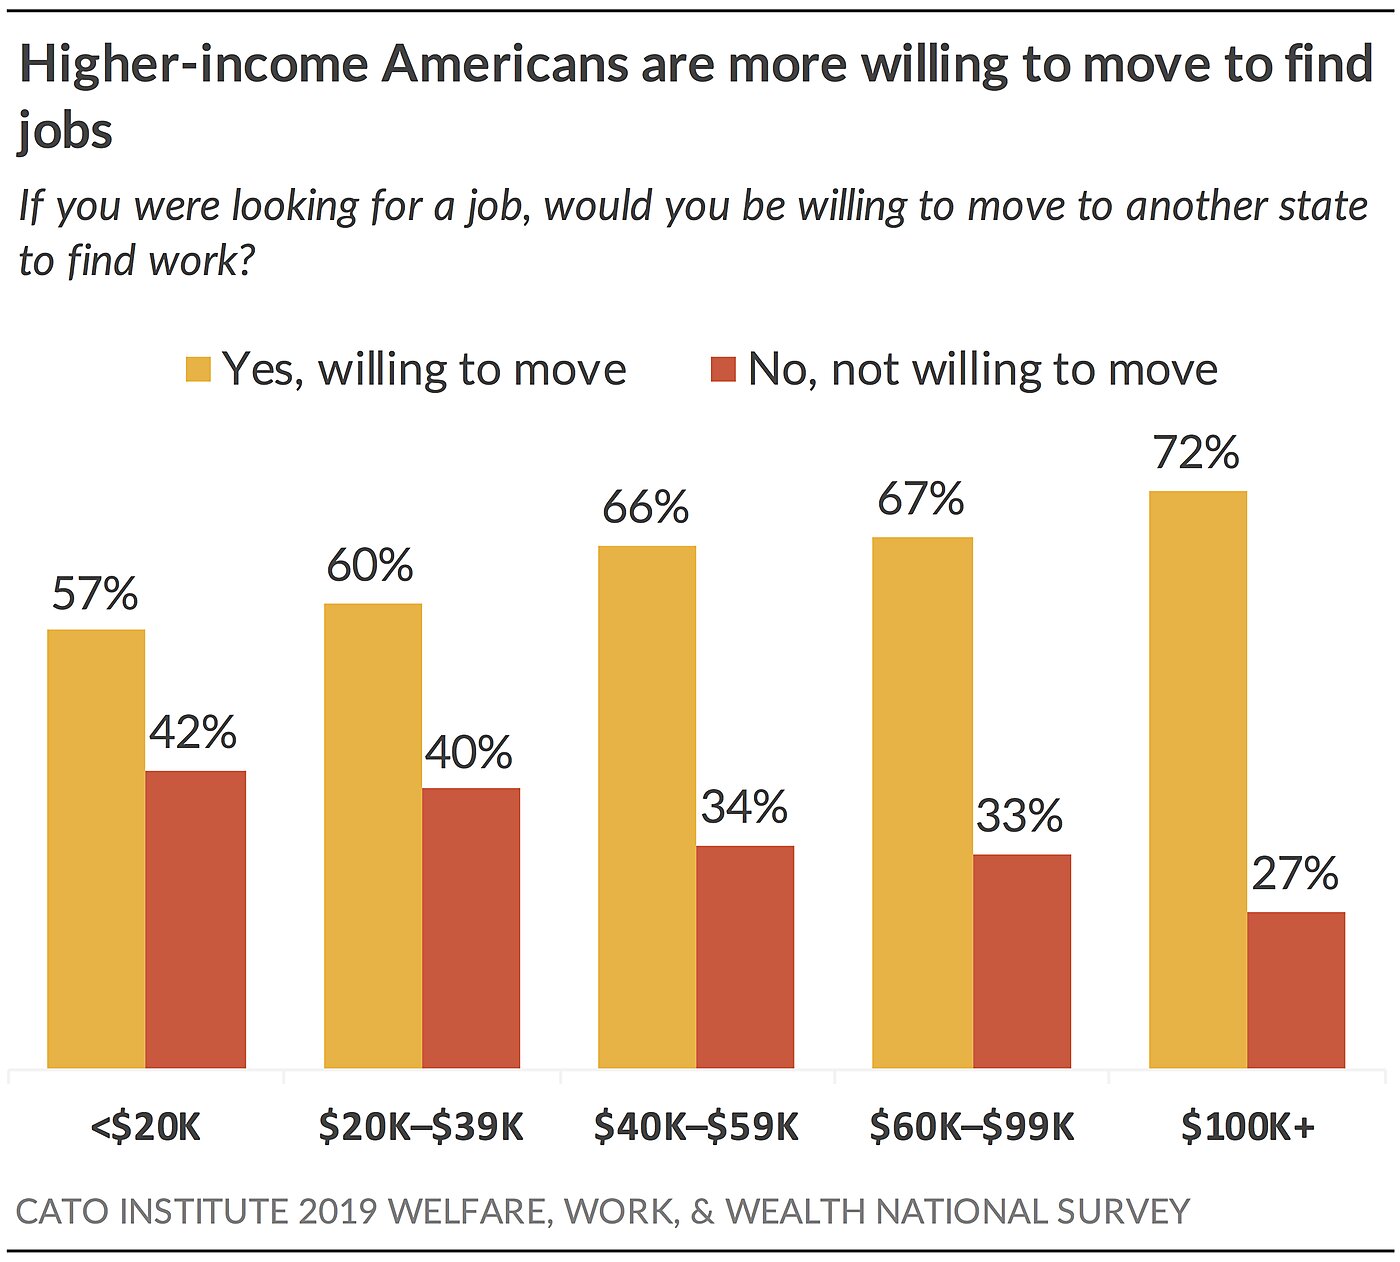
59% of Americans Say Planning for the Future Is More Important Than Living Today to the Fullest
Nearly 6 in 10 (59%) Americans say it’s more important to “plan for the future and give up things now if necessary” while 40% say it’s more important to “take one day at a time and live life to the fullest.”
Attitudes vary with income. A majority (55%) of people earning less than $20,000 a year say it’s more important to take it one day at a time and live life to the fullest rather than give up things now to plan for the future. Americans earning between $20,000 and $39,000 annually are evenly divided. About two-thirds of Americans earning over $40,000 a year say it’s more important to plan for the future and give up things now if necessary. Interestingly, opinions don’t change much between those earning $40,000 a year and those earning over $200,000 a year.
This dilemma divides liberals. Nearly two-thirds (61%) of moderate liberals say it’s more important to plan for the future and give up things now if necessary, but conversely a slim majority (51%) of strong liberals say it’s more important to take things one day at a time and live life to the fullest. Two-thirds (65%) of moderate and strong conservatives alike agree that planning for the future is more important.
Americans with more education are more likely to say it’s more important to plan for the future and give up things now if necessary. Nearly 7 in 10 (68%) Americans with post-graduate degrees say it’s more important to plan for the future compared to 51% of those with high school degrees or less.
There are also differences by race and ethnicity. Six in 10 White (63%) and Asian Americans (60%), 51% of Latino Americans, and 42% of Black Americans say it’s more important to plan for the future and give up things now if necessary rather than take it one day at a time and live life to the fullest.
Opinions are related to views of capitalism and socialism. Americans very favorable toward capitalism (69%) say it’s more important to plan for the future and give up things now if necessary. Conversely, Americans very favorable toward socialism (56%) say it’s more important for them to take things one day at a time and live life to the fullest.
72% of Americans Say Only Kids Who Win Should Get Trophies
Turning to American attitudes about rewarding achievement, 72% say that only kids who win should receive trophies, while 27% think all kids who play sports should receive trophies for their participation.
Majorities of Democrats (63%), independents (73%), and Republicans (79%) agree that only kids who win should be awarded trophies.
Who Finds the Most Meaning and Purpose in Their Lives?
Most Americans believe that they have purpose and meaning in their lives, and their beliefs about hard work, responsibility, and agency may have something to do with it.
Eight in 10 (83%) Americans agree “I feel like I have purpose in my life; my life has meaning” while 16% disagree. But some Americans find more meaning and purpose in their lives than others. A little less than half (46%) “strongly agree” that their lives have meaning and purpose and 37% “somewhat agree.”
Who feels a greater sense of purpose and meaning in their lives?
The survey compared answers among those who scored high vs. low on a variety of psychological measures included on the survey. People who find the most meaning and purpose in their lives were most likely to have the following characteristics and beliefs: People who…
- strongly believe hard work is its own reward (74%)
- strongly believe they have personal agency (68%)
- strongly believe in personal responsibility (60%)
- are very compassionate (58%)
- are not very envious (70%) or resentful (63%)
The aforementioned individuals are much more likely to find meaning and purpose in their lives compared to people who believe external forces direct their lives (30%), don’t emphasize personal responsibility (39%), aren’t very compassionate (38%), are envious (27%), and are resentful of successful people (33%).
These data paint a picture of the psychology of a person most likely to find meaning and purpose in their lives: those who highly value work and responsibility, emphasize what they can control rather than what they cannot, are compassionate, and resist the temptation to feel envy and resentment of others.
Demographically, people who volunteer (54%), who attend church more than once a week (68%), religious people such as Protestants (55%) or Catholics (51%), people 65 and over (59%), and African Americans (57%) are more likely to find purpose and meaning in their lives than those who do not volunteer (37%), never attend religious services (36%), are atheist or agnostic (29%), are under 30 (36%), and are White (45%) or Latino (43%) Americans.
Politically, conservatives (58%) are about 20 points more likely than liberals (39%) to strongly agree their lives have meaning. A slim majority (51%) of libertarians strongly believe their lives have meaning.
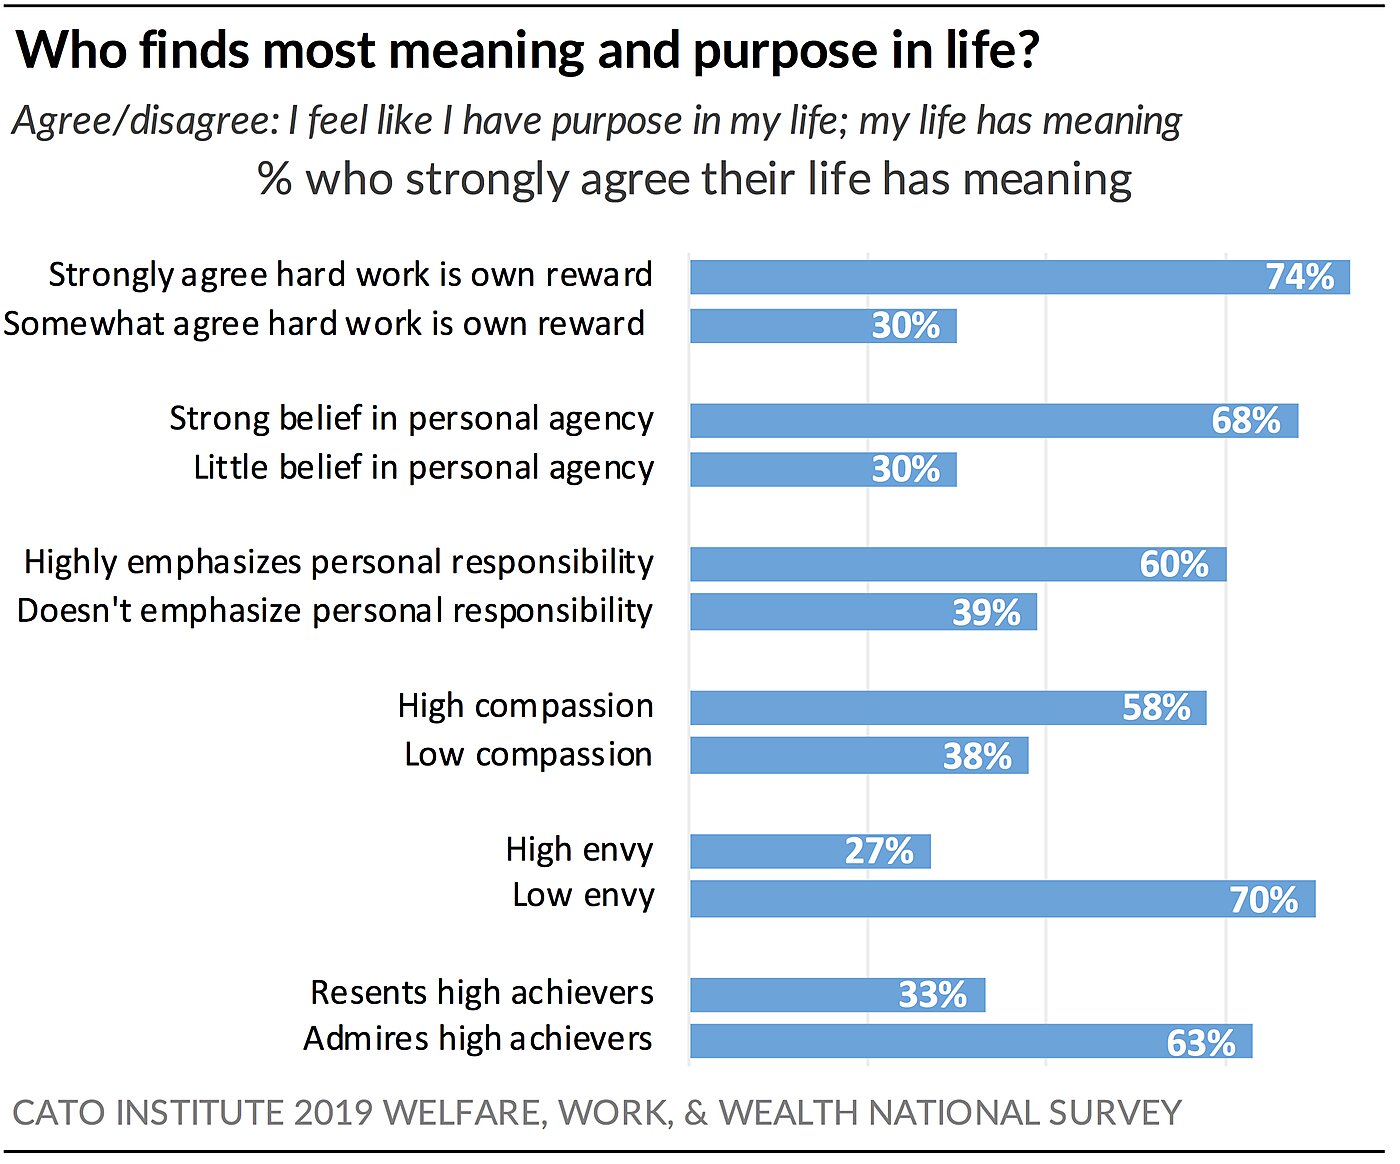
What Americans Think about Welfare
This next section examines what Americans think about government welfare programs. It also carefully analyzes what current recipients of means-tested programs think about them compared to those who have previously received or not received benefits.
What Americans Think about Welfare Programs
60% of Americans Don’t Think Welfare Programs Are Designed to Lift People Out of Poverty
Most Americans believe that government welfare programs are not designed to help people climb out of poverty. Instead 60% believe these programs “simply provide for peoples’ basic needs while they are poor” rather than help them “climb out of poverty” (39%). Majorities of both welfare recipients (53%) and nonrecipients (62%) agree these programs simply provide for basic needs rather than help people get out of poverty.
68% of Republicans Believe Welfare Creates Dependency; 71% of Democrats Think Welfare Helps People Get Back on Their Feet
Although Americans don’t believe welfare programs lift people out of poverty, most don’t believe these programs hold people back either. A little less than half (45%) believe welfare programs “make poor people dependent and encourage them to stay poor.” Instead a majority (54%) think they offer poor people “a chance to stand on their own two feet and get started again.”
An overwhelming majority (68%) of welfare recipients believe welfare programs give people a chance to restart rather than foster dependency. Nonrecipients are less certain, with 49% who believe programs make people dependent on them and 50% who think they help people get a fresh start. Americans who previously received welfare benefits fall in between: 56% believe the benefits help people restart and 44% worry they create dependency.
Partisans view the effects of welfare differently. Democrats and independents believe welfare benefits give poor people the opportunity to get back on their feet (71% and 63%). But about as many Republicans believe such programs encourage dependency and perpetuate poverty (68%).
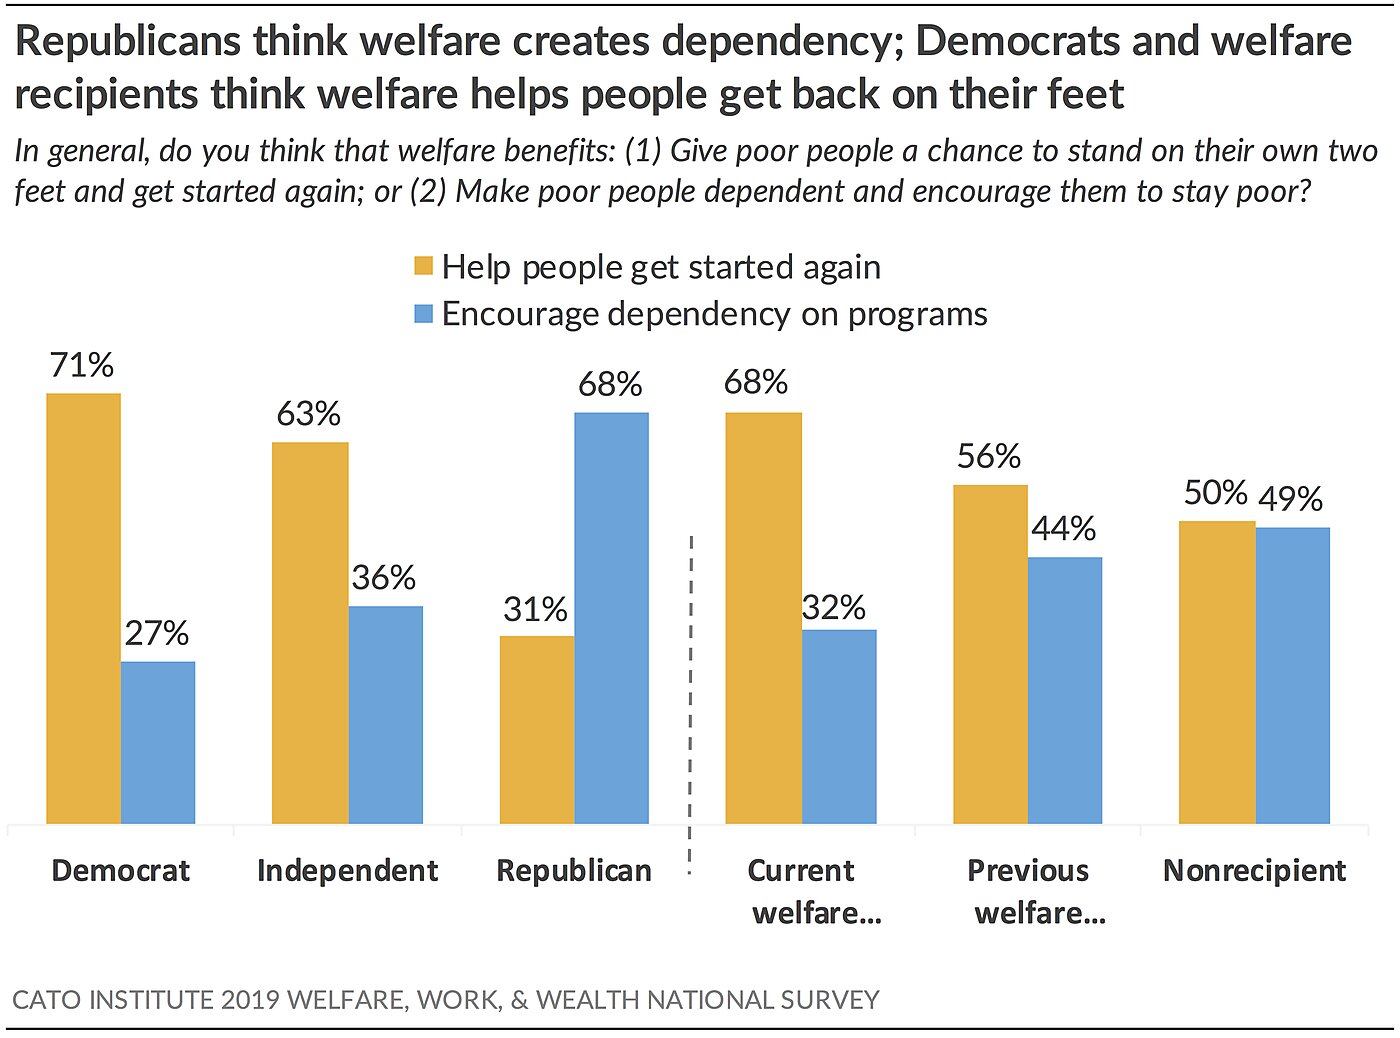
About two-thirds of African Americans (67%), Latino Americans (64%), and people under 55 (60%) don’t believe welfare benefits create dependency. White Americans are evenly divided (49%). Those 65 and over believe such programs perpetuate poverty (59%).
Did the War on Poverty Work?
77% of Americans Say Government Efforts to Fight Poverty Have Been “Ineffective”
More than three-fourths (77%) of Americans say government efforts to fight poverty over the past 10 to 15 years have been “ineffective.” A quarter (23%) disagree and say anti-poverty efforts have been effective. This perception is not controversial, with majorities of welfare recipients (63%) and nonrecipients (80%), Democrats (73%), independents (72%), and Republicans (83%) in agreement that the government’s war on poverty hasn’t worked.
72% of Americans Say Government Doesn’t Know Enough to Fix Poverty
Perhaps one reason the public believes government has failed to effectively tackle poverty is that Americans don’t think government knows how. Nearly three-fourths (72%) agree that even “if government were willing to spend whatever is necessary to eliminate poverty,” the government doesn’t “know enough about how to accomplish that.” A quarter (26%) believe government could end poverty if only it would spend enough money.
Democrats (67%), independents (73%), Republicans (77%), welfare recipients (58%), previous welfare recipients (76%), and nonrecipients (75%) agree that the government doesn’t know how to fix poverty.
Interestingly, although most agree government doesn’t know how to fix poverty, a majority of Democrats (66%) and welfare recipients (65%) support increasing anti-poverty spending, such as on food assistance. Conversely, Republicans (83%) and people not receiving welfare do not favor an increase (63%).
This suggests that people don’t necessarily support expanding social welfare programs because they believe the programs will fix poverty. Instead, attitudes about expanding the welfare state may have more to do with reducing the vulnerability of those receiving the programs. Thus, opinions about welfare spending may depend on what level of security people think is required for those in poverty, rather than if the program helps people escape poverty.
How Should Government Address Poverty?
Americans aren’t convinced that more welfare spending is the solution to poverty. That doesn’t mean they support deep cuts to existing programs. Rather, they favor focusing efforts on ways to eliminate the causes of poverty and growth-oriented policies that can create job opportunities and pathways to upward mobility.
70% of Americans Say Government Should Try to Eliminate Causes of Poverty Rather Than Increase Welfare Benefits
Americans would rather direct resources toward addressing the root causes of poverty than expand the scope of welfare programs. Seventy percent (70%) think it’s better to spend money trying to “eliminate the causes of poverty,” and 29% would rather allocate more resources directly to the poor to help them “get back on their feet.”
Majorities of welfare recipients (59%), previous recipients (71%), and nonrecipients (72%) would prefer government focus its efforts on reducing the causes of poverty rather than expanding benefits. However, welfare recipients are more likely than nonrecipients to prefer government transfer money directly to them (41% vs. 27%).
79% of Americans Say Economic Growth Will Better Help People Climb Out of Poverty Than More Welfare Spending
Most Americans (79%) believe that more economic growth rather than more welfare spending (19%) will better help people escape poverty. The focus on economic growth over welfare spending is not controversial. Majorities of Democrats (69%), independents (76%), Republicans (90%), current welfare recipients (76%), and nonrecipients (79%) agree more economic growth will better help people in poverty.
Despite this, majorities of Democrats (66%) would also like to raise welfare spending, while 61% of independents and 83% of Republicans would not. This implies that Democrats do not believe increasing welfare spending comes at a cost to economic growth. Republicans, on the other hand, appear to believe that increasing government spending (and thus taxes) to fund expanded social services detracts from economic growth.
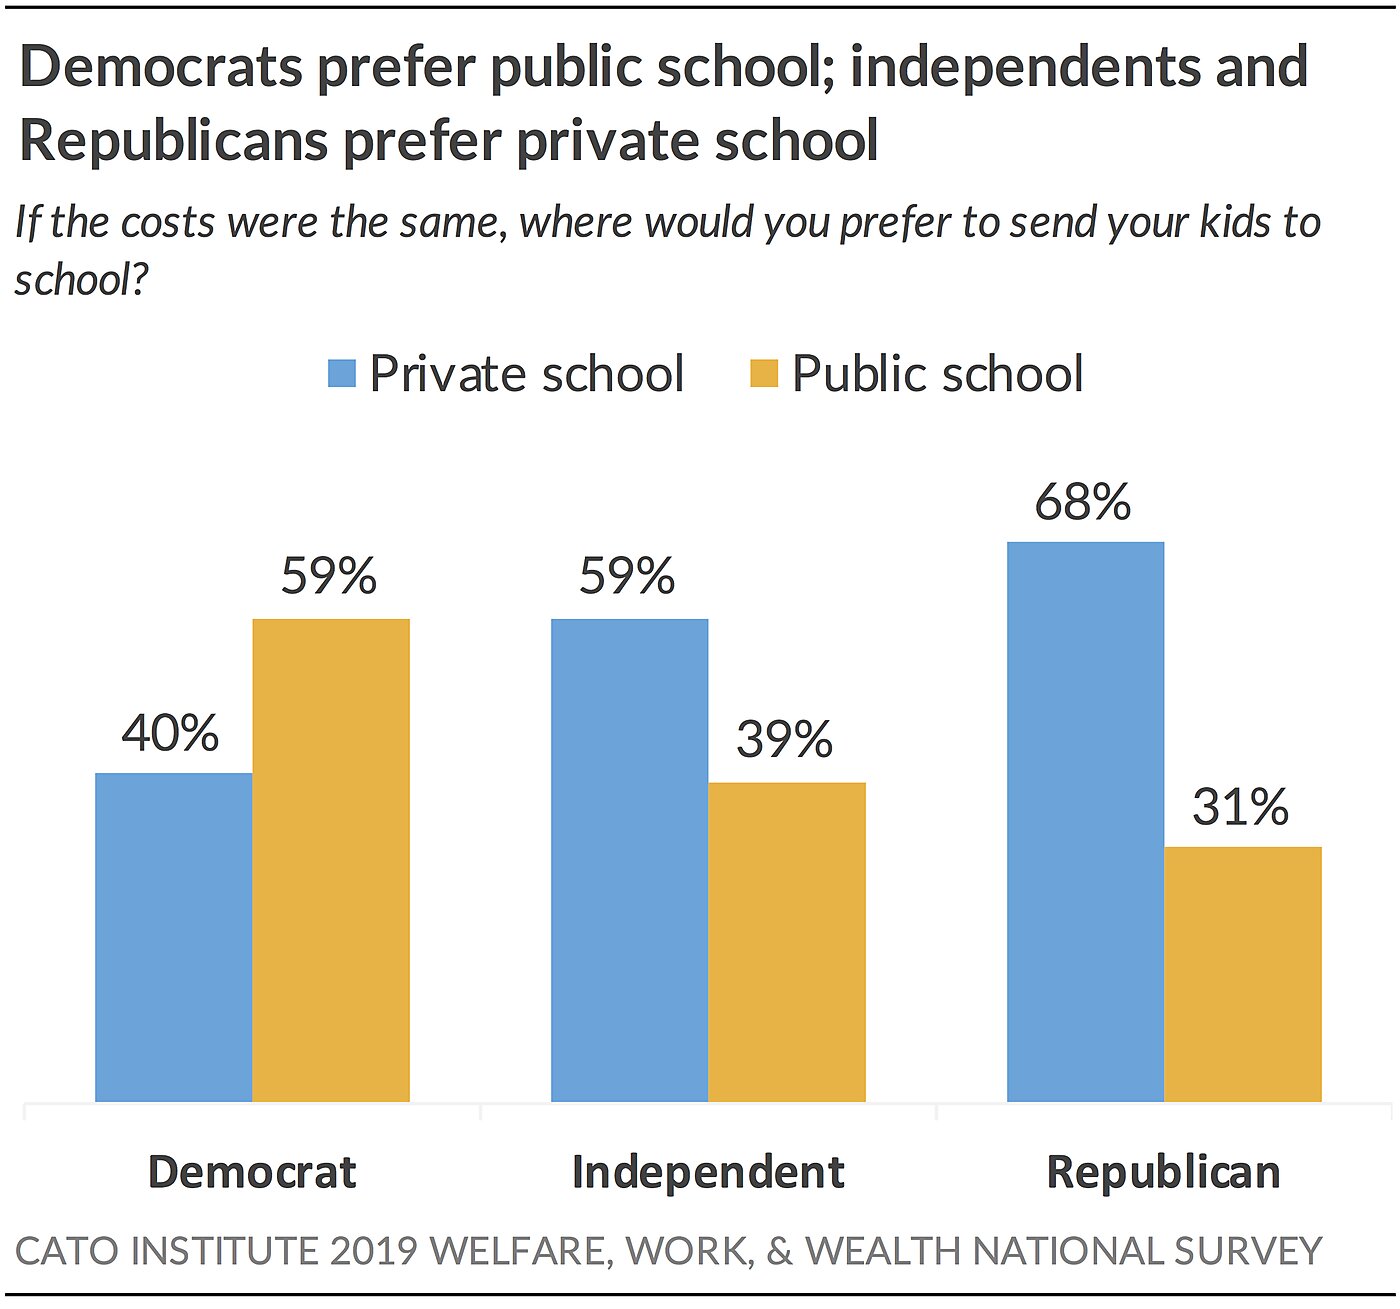
25% of Americans Favor Cutting Government Food Assistance to the Poor
Few Americans support cutting government financial assistance to the poor. For instance, only 25% favor cutting government spending on food assistance to low-income people, while 41% favor increasing it and 33% would keep spending about the same.
Not surprisingly, partisans disagree. Two-thirds (66%) of Democrats would rather increase spending on food stamps, compared to 39% of independents and 17% of Republicans. Republicans are divided between cutting spending on food stamps (45%) and keeping it about the same (38%).
Nevertheless, strong majorities of Democrats (67%), independents (63%), and Republicans (76%) all agree they’d prefer resources be directed toward reducing the causes of poverty before increasing welfare benefits.
Implications
Democrats and Republicans think very differently about the role of welfare programs and the solution to poverty. These data suggest that Democrats don’t necessarily believe government anti-poverty programs solve or are capable of solving poverty. Instead, they appear to endorse the idea that such programs are to help provide for people’s needs while they are poor. Thus, critics of these programs may not find it effective to tell Democrats that welfare programs “don’t work” because they don’t reduce poverty. Democrats may believe they “do work” because by providing for people’s needs, they reduce their vulnerability. On the other hand, Republicans may expect the programs to reduce poverty and that if they don’t, then there’s little point to expanding them even if they increase security. Indeed, the data indicate that Republicans may feel that making the programs more expansive may discourage people from climbing out of poverty.
Who Has Received Government Welfare Assistance?
The survey asked respondents if they ever received or were currently receiving any form of government welfare assistance such as food stamps, cash welfare (TANF), housing assistance, or other form of assistance. In other words, had they received means-tested welfare benefits.26
Welfare recipients are 57% female, 43% male, 57% White, 22% African American, 11% Latino, and 2% Asian. Those who have never received welfare benefits are 48% female, 52% male, 65% White, 10% African American, 18% Latino, and 3% Asian.

Welfare recipients are more likely than nonrecipients to live in cities (40% vs. 31%) and towns (17% vs. 12%) but less likely to live in suburbs (24% vs. 40%) and about equally likely to live in rural areas (19% vs. 17%).
There are small partisan differences. Welfare recipients are somewhat more likely than nonrecipients to be independent (24% vs. 19%) or Democratic (45% vs. 40%) and somewhat less likely to be Republican (31% vs. 42%).
Notably, nearly a third (31%) of welfare recipients identify as Republicans. However, Republicans are known for being more skeptical of government social services. Indeed, this survey found a plurality (45%) of Republicans support cutting government spending on food assistance like food stamps; 38% want to keep it the same, and 17% want to increase it. But do Republicans who currently receive such benefits feel differently? Yes, about half (49%) of Republicans who currently receive welfare benefits support increasing those benefits. At the same time, however, they are much less likely than Democratic welfare recipients (76%) and independent welfare recipients (63%) to feel similarly. Thus, even when immediate material self-interest incentivizes Republicans to support increasing social services, their ideology may somewhat constrain them. Nevertheless, Republican welfare recipients remain more supportive of expanding social services than their fellow partisans.
What Americans Think about Welfare Recipients
65% of Welfare Recipients Say Most Recipients Would Rather “Earn Their Own Living”
A majority (54%) of Americans believe that current welfare recipients would “rather earn their own living,” and 45% think they’d “rather stay on welfare.”
But what do current welfare recipients say? Nearly two-thirds (65%) of current welfare recipients say that most poor people receiving welfare benefits today “would rather earn their living,” and 34% think recipients would “prefer to stay on welfare.” In contrast, nonrecipients are evenly divided with 50% thinking welfare recipients would rather earn their living and 48% thinking they’d prefer to stay on welfare.
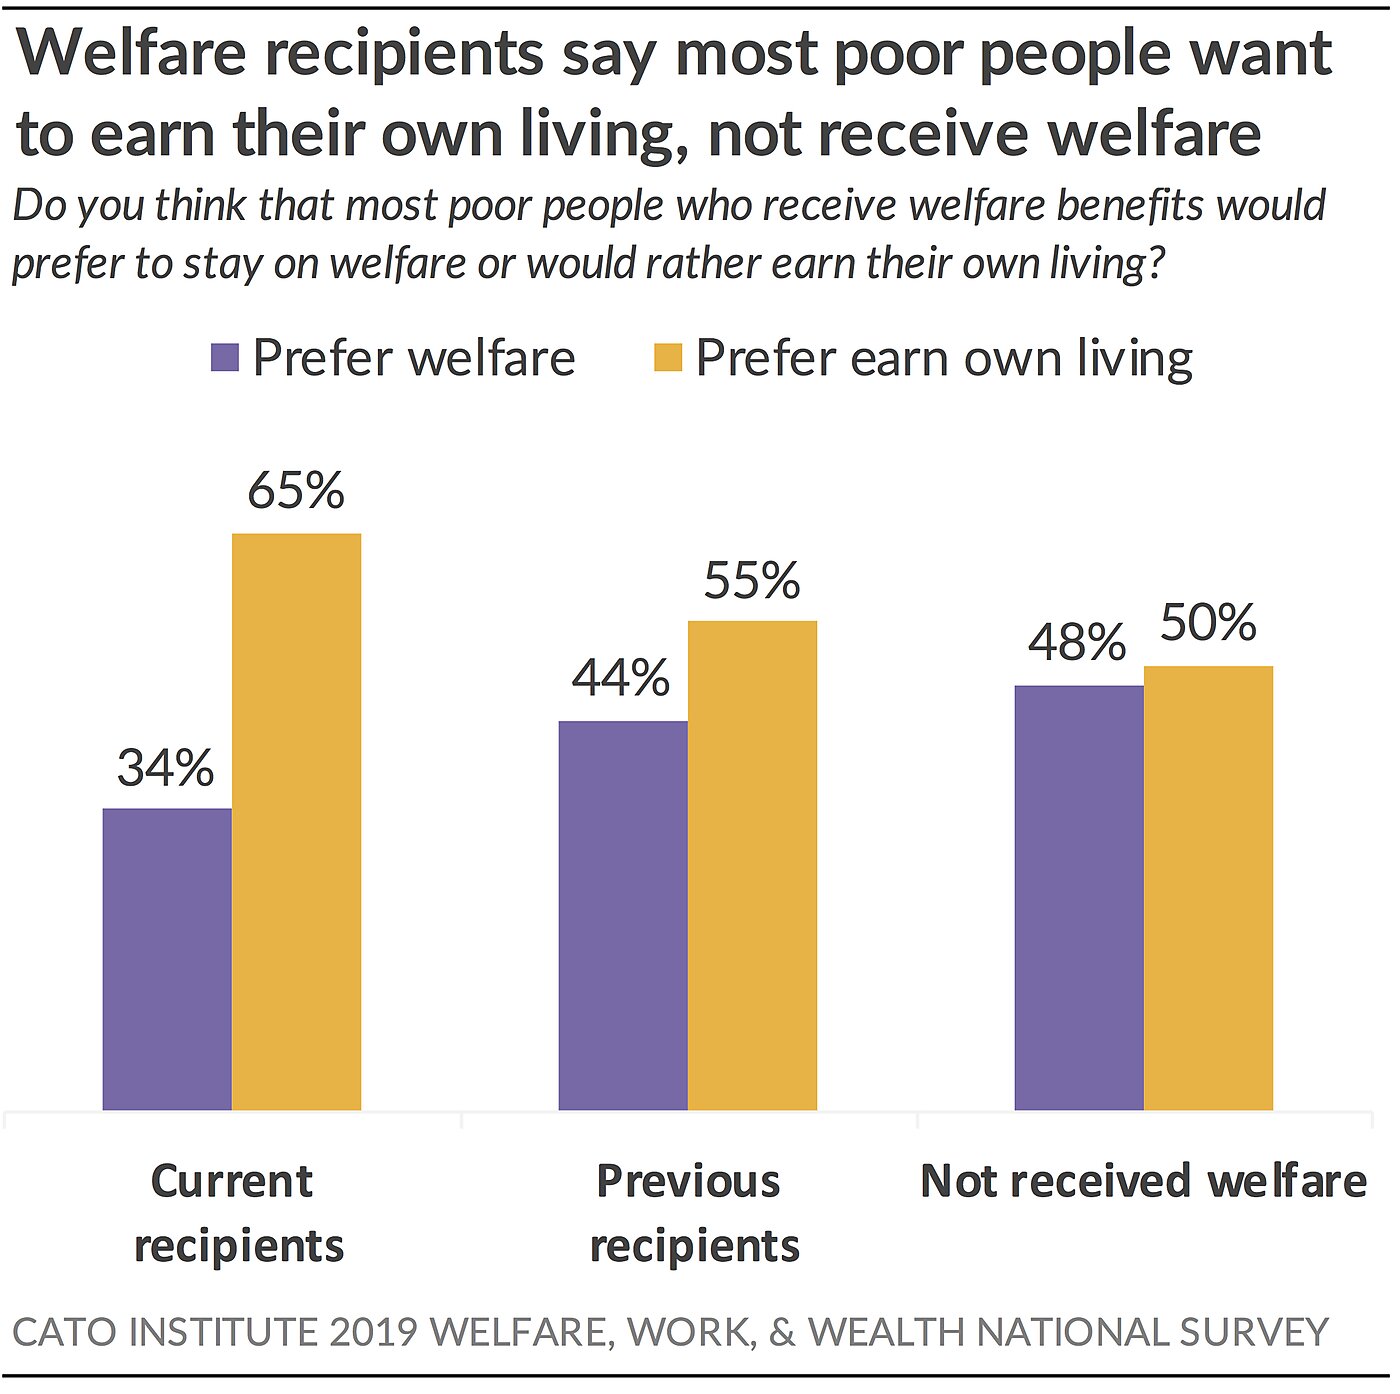
How Inclusive Is the Economy?
This next section examines Americans’ perceptions about accessing key essentials of the American Dream. It also considers how well people believe the housing, education, and criminal justice systems are meeting Americans’ needs. It pays careful attention to the challenges current welfare recipients face and identifies key hurdles to low-income people rising out of poverty. It also examines support for reforms that some scholars believe could help reduce poverty and empower people to rise as far as their talents and desires can take them.
Financial Fragility in America
63% of Americans Were Worried They Couldn’t Pay Bills in Past Year
There are sizeable decreases in financial fragility as Americans’ annual earnings increase to $40,000 and $100,000 a year, respectively. Among Americans earning less than $40,000 a year, 20% say they were not worried about their bills. This percentage doubles to 40% among those earning $40,000 to $99,999 a year. Among Americans earning more than $100,000 annually, 60% say they hadn’t worried about bills in the prior year.
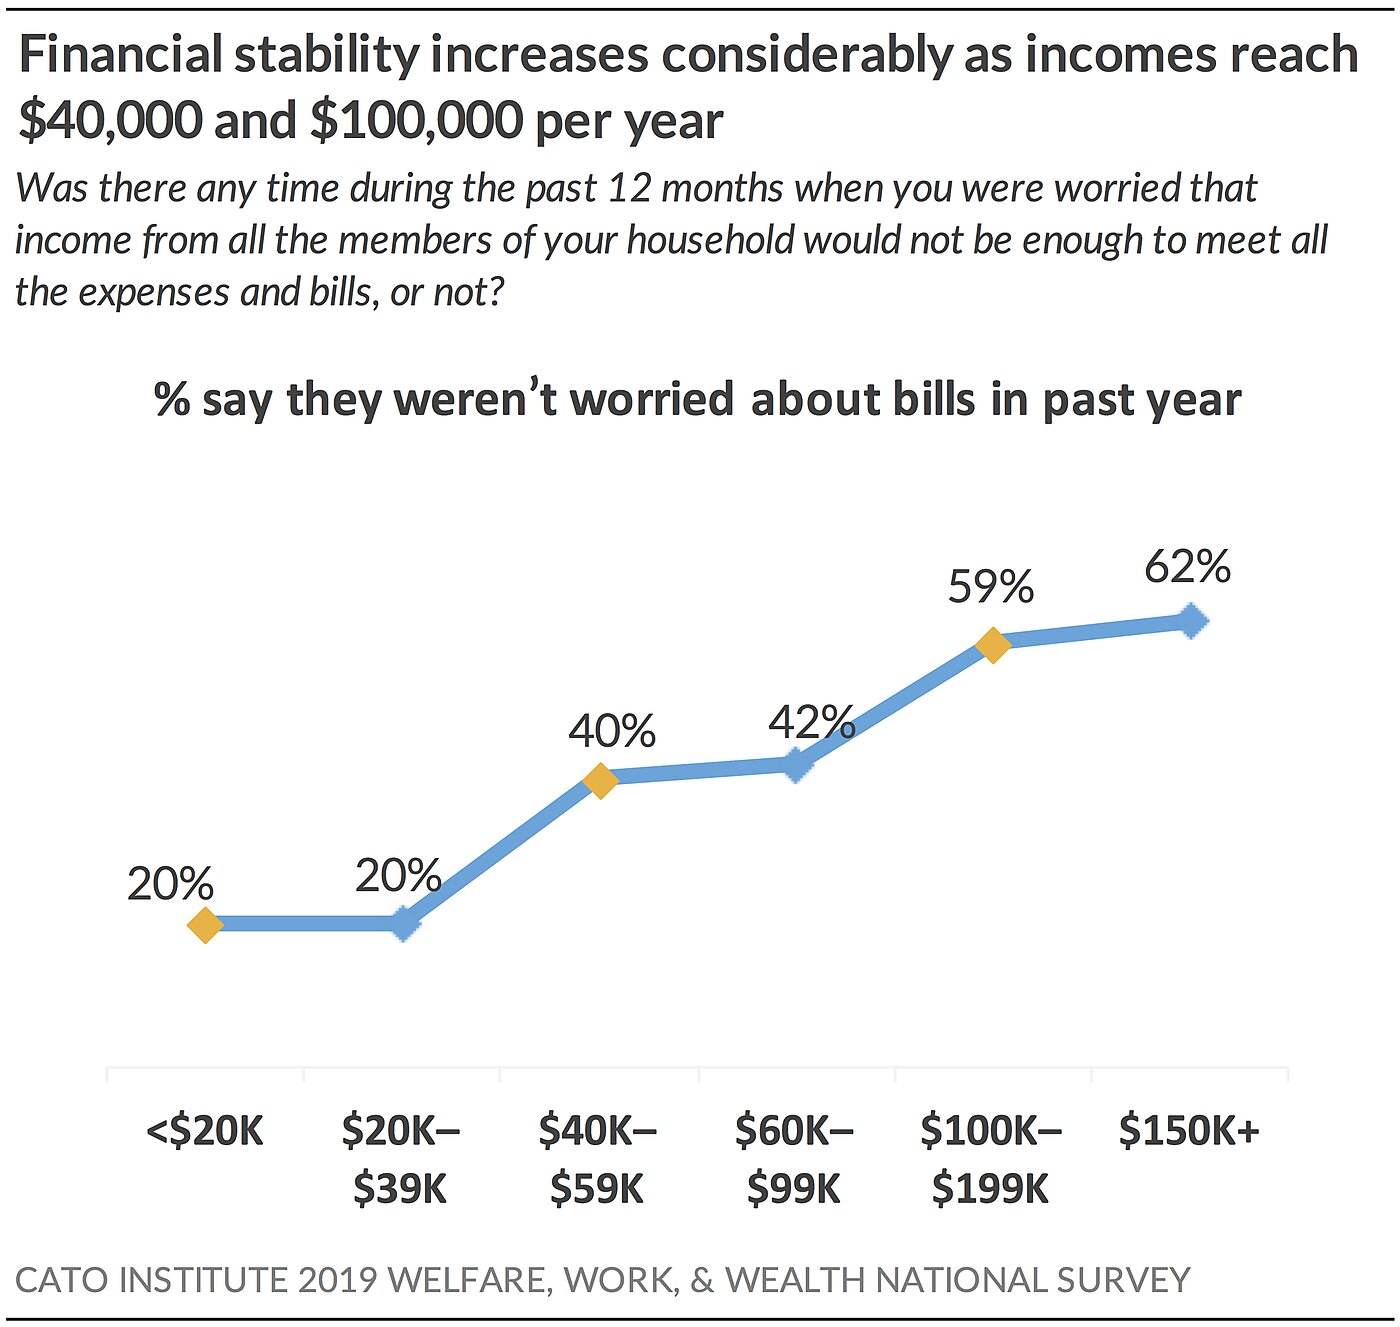
Affordability of Key Household Budget Items
Over the past few years, about a third to nearly half of Americans say it has become more difficult to afford education for their kids (48%), food (42%), their monthly utility bills (41%), their rent or mortgage (38%), gas and transportation costs (37%), their credit card bills (37%), and childcare (35%).
Current welfare recipients are about 15–20 points more likely than nonrecipients to say that over the past few years it’s become harder to afford food (56% vs. 36%), utility bills (51% vs. 37%), gas or transportation costs (51% vs. 32%), their credit card bills (50% vs. 33%), and their rent or mortgage (48% vs. 34%). Welfare recipients are 9 points more likely than nonrecipients to say it’s become harder to afford childcare costs (41% vs. 32%).
There is virtually no meaningful gap between welfare recipients and nonrecipients when it comes to affording higher education costs (48% vs. 46%). This isn’t because welfare recipients think it’s affordable but rather because about half of nonrecipients agree it’s become more difficult to afford education costs.
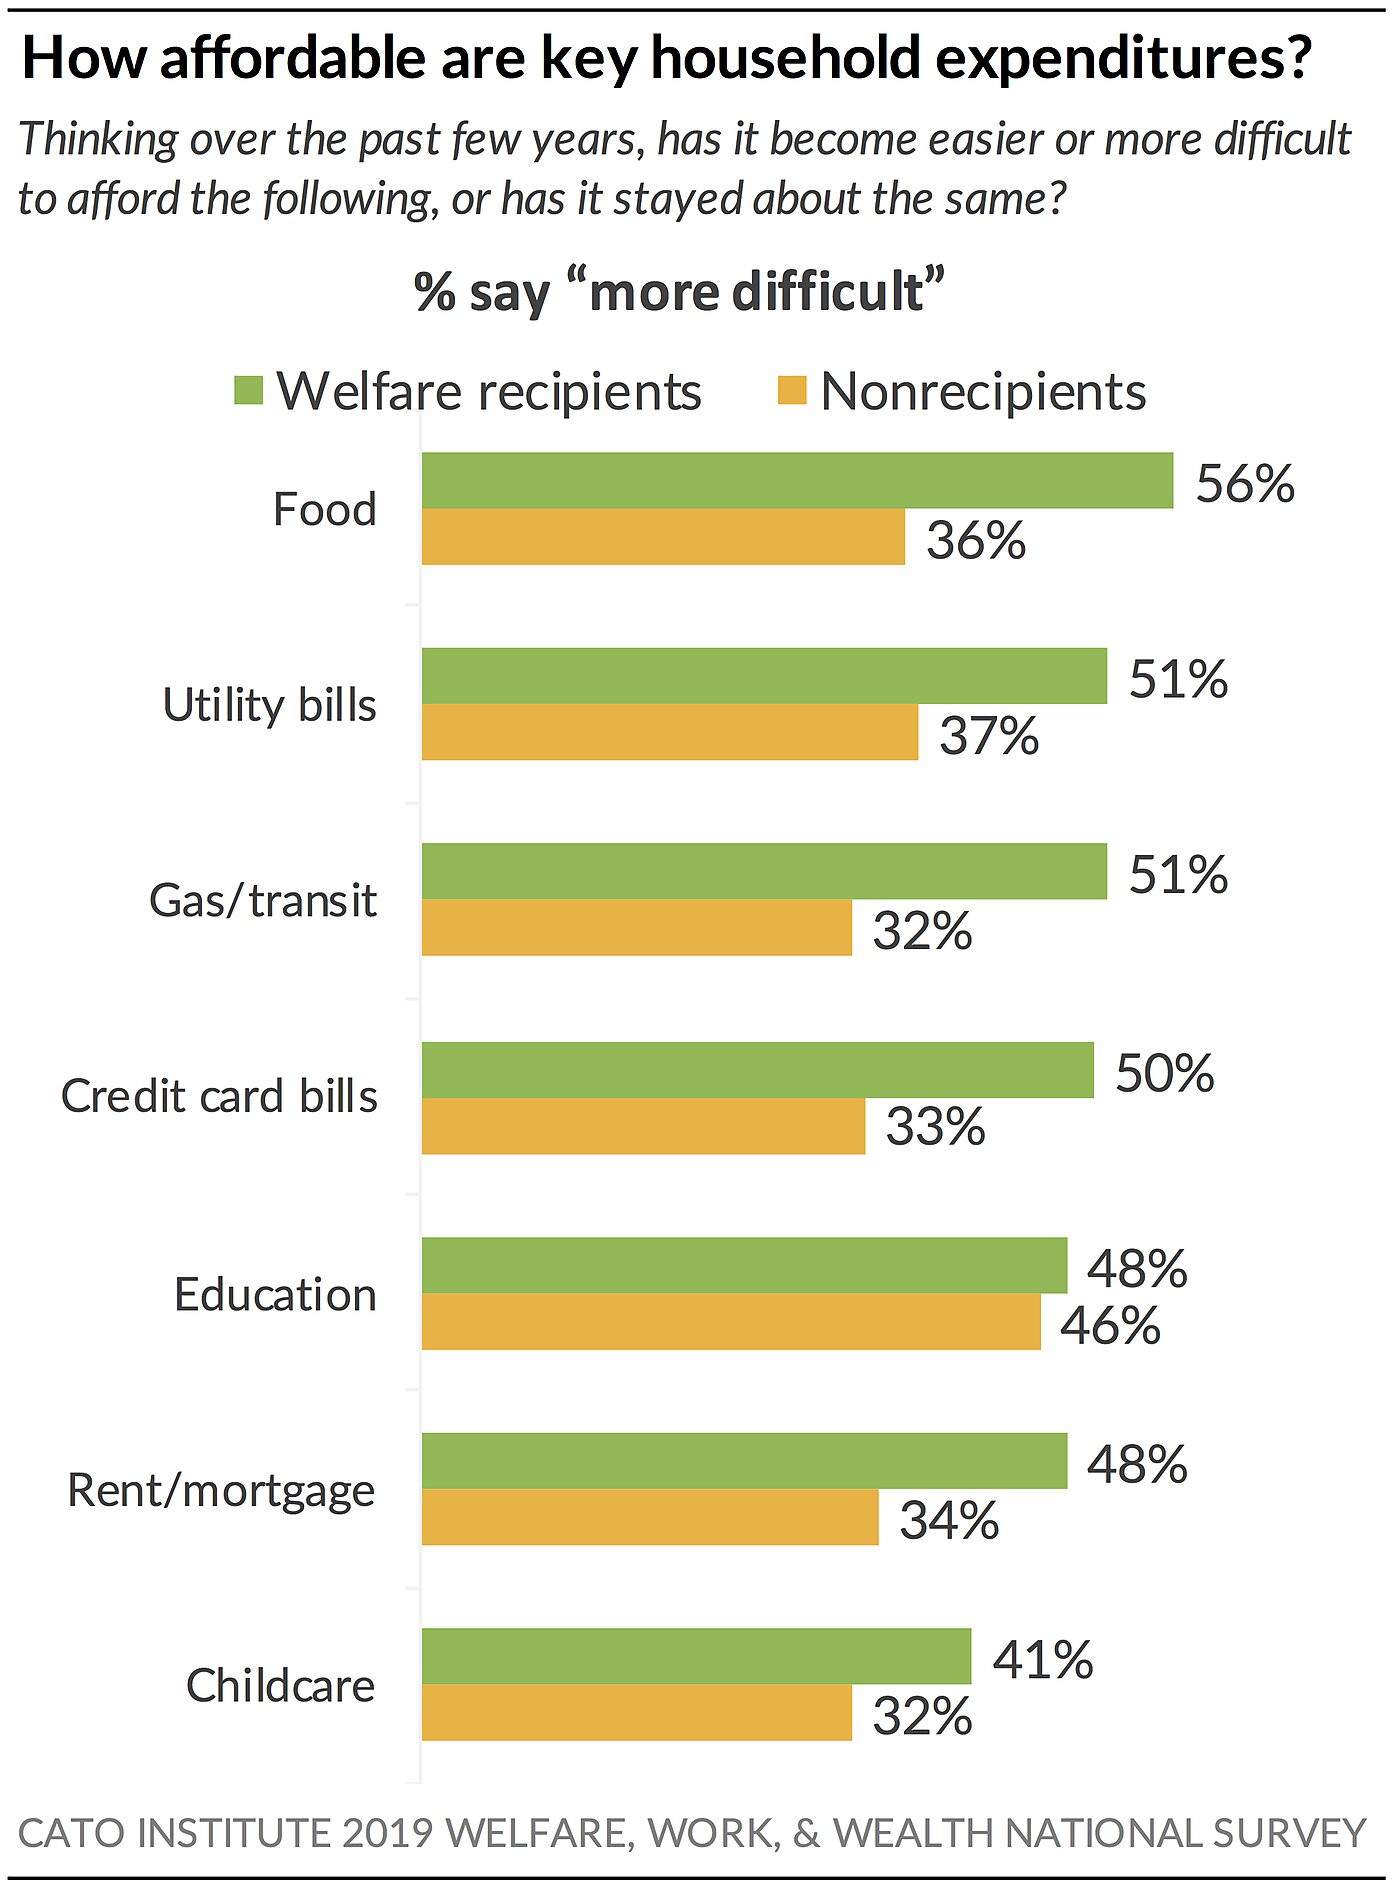
Accessing Essentials in Your Neighborhood
53% of Welfare Recipients Rate Housing Costs as “Bad” in Their Neighborhoods
The survey asked respondents to rate the conditions where they live regarding finding good jobs, decent affordable housing, decent education for children, and moving up economically. Overall, majorities rate the conditions of each in their local neighborhoods as “good,” indicating that most Americans are able to access key components of the American Dream.
The percentages who rate the following as either “very good” or “somewhat good” in their neighborhoods are as follows:
- 73% say accessing a decent education for their children is good
- 63% say prospects for finding good jobs in their area is good
- 60% say moving up financially in their area is good
- 55% say finding decent, affordable housing in their area is good
However, substantial minorities—a quarter to nearly a half—rate conditions in their local area as “bad.” The percentages who rate the following as either “very bad” or “somewhat bad” in their neighborhoods are as follows:
- 44% say finding decent affordable housing in their area is bad
- 39% say moving up financially in their area is bad
- 36% say prospects for finding good jobs in their area is bad
- 25% say finding a decent education for their children is bad
Americans receiving means-tested government assistance are far more likely than nonrecipients to rate the conditions in their neighborhoods as “bad” for accessing decent affordable housing (53% vs. 38%), moving up financially (53% vs. 33%), finding good jobs (47% vs. 30%), and accessing a decent education for children (37% vs. 21%).
These data suggest that key hurdles for America’s poor are high housing costs and accessing good jobs.
Housing
A majority (56%) of Americans say expensive housing costs prevented them from moving to a better neighborhood. This share rises to 78% among current welfare recipients.
56% of Americans Say Expensive Housing Prevented Them from Moving to Better Neighborhood
It’s not until families begin earning more than the median household income that Americans say housing costs are not prohibitive. Among those earning less than $60,000 a year, about two-thirds say expensive housing costs prevented them from moving to a better location. However, among those earning over $60,000, a majority (56%) say expensive housing costs did not prevent them from moving to a better neighborhood.
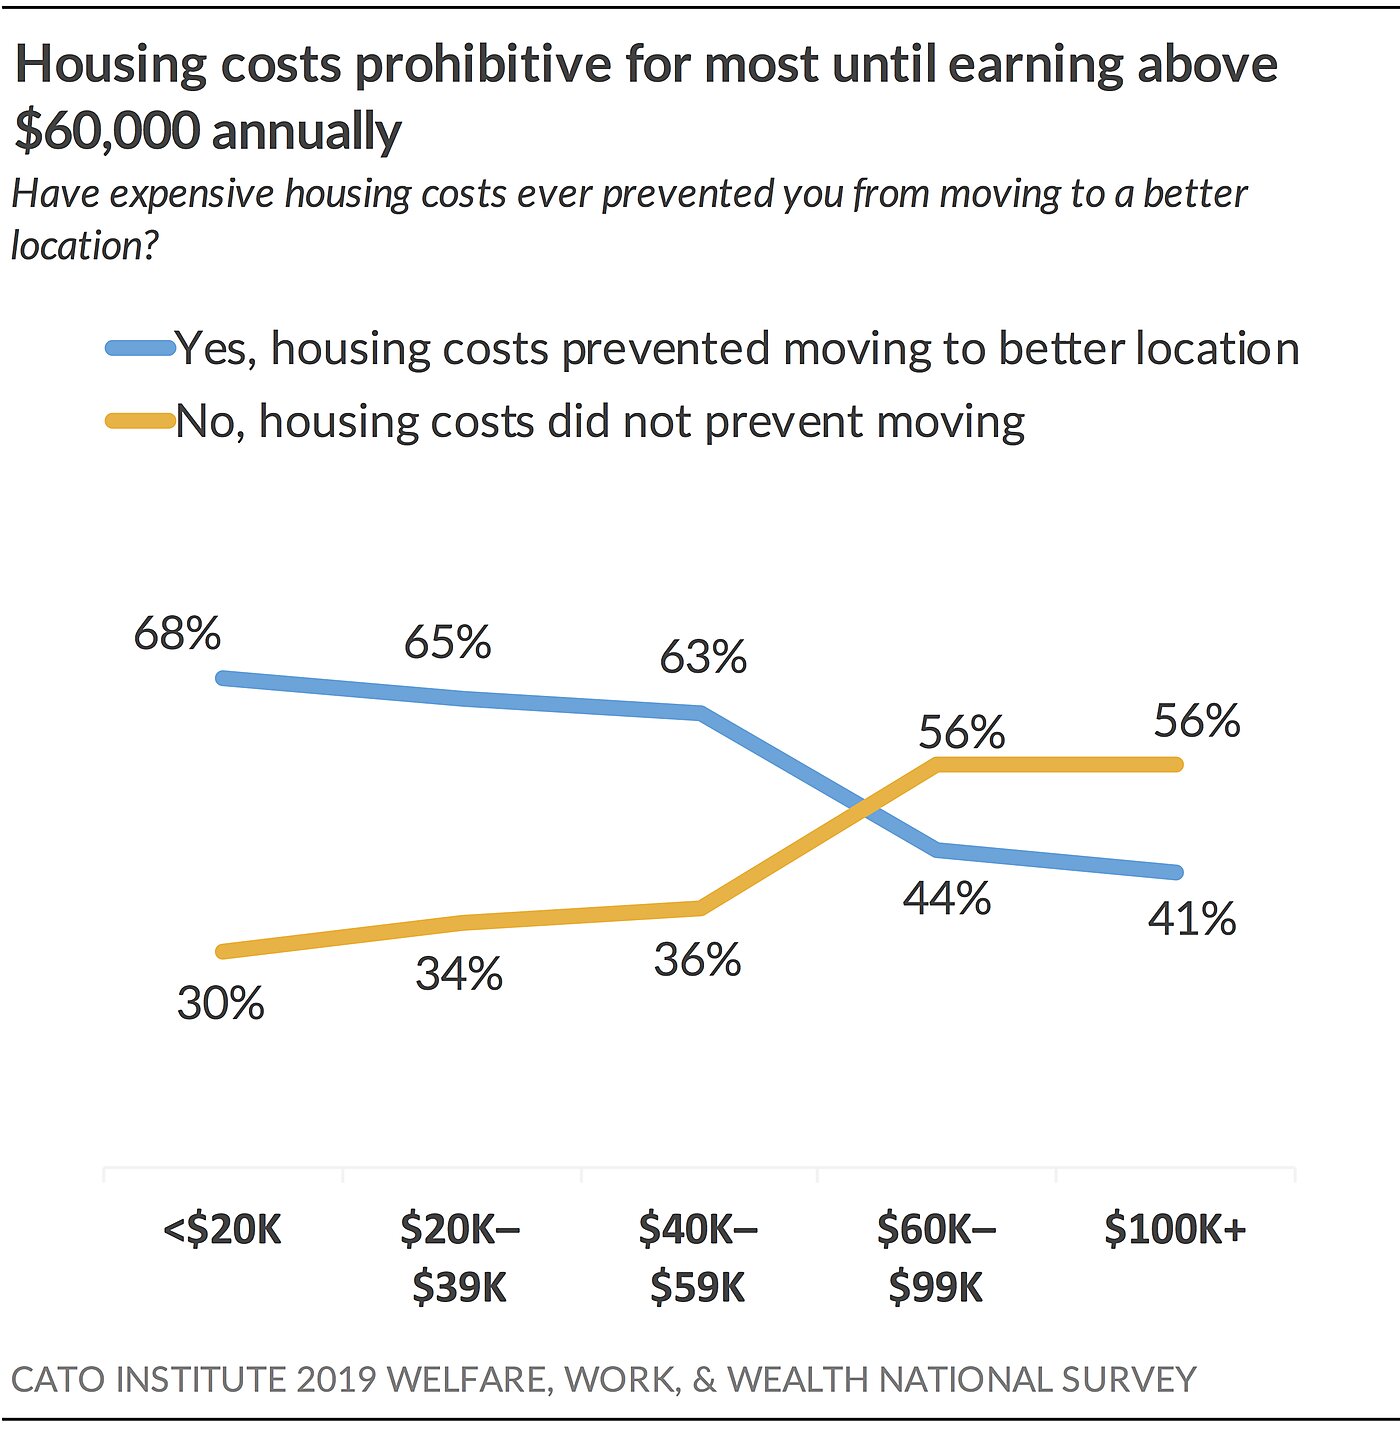
The high cost of housing is a post-partisan problem. Majorities of both Democrats (61%) and Republicans (54%) say expensive housing costs prevented them from moving to a better neighborhood.
44% of Americans Rate Housing Costs in Current Neighborhood as “Bad”
High housing costs affect Americans even where they currently live. Nearly half (44%) rate the cost of housing in their communities as “bad.”
59% of Americans Favor Building More Housing in Their Neighborhood
A majority (59%) of Americans favor building more houses, condos, and apartment buildings in their community while 39% oppose. These data suggest that liberalizing density zoning is desired among the public.
Expanding the supply of housing is broadly popular across partisans and demographics—particularly in cities. City residents (69%) are nearly 20 points more supportive than suburban residents (52%) of building more housing. Majorities of Democrats (67%), independents (57%), and Republicans (52%) favor building more housing in their neighborhoods. Libertarians are similar to Democrats with 67% who favor more construction. Majorities of White (56%), Black (62%), and Latino (66%) Americans also favor building more housing.
Americans become even more supportive of building more housing in their communities if it made housing more affordable. Nearly three-fourths (71%) would favor building more houses, condos, and apartments in their community if it meant that “it would be easier to afford housing in your neighborhood.”
Education
55% of Americans Would Prefer to Send Their Kids to Private School; 59% of Democrats Prefer Public School
About 90% of children in elementary and secondary schools attend public schools. But a majority (55%) of Americans would rather send their kids to a private school. Majorities of Latino (57%), White (54%), and Black (51%) Americans prefer that their kids receive an education through a private school.
Young Americans stand out with their preference for public education. A slim majority (52%) of those under 30 prefer public to private school. However, Americans over 30, including those 30–44 (51%), 45–54 (56%), and over 55 (61%), would prefer private school.
There are striking partisan differences. More than two-thirds of Republicans (68%) and a majority (59%) of independents would rather send their kids to private school. However, a solid majority (59%) of Democrats prefer public school for their kids. This share rises to 65% among strong liberals.
25% of Americans Rate Their Local Public School as “Bad”
One reason why many Americans may prefer private schools is that they believe their local schools are of low or mediocre quality. A quarter (25%) of Americans currently rate the educational quality of schools in their neighborhoods as “somewhat” or “very bad.” Another 47% rate their local schools as “somewhat good,” and 27% say their schools are “very good.” The share who rate their local schools as “bad” rises to 37% among those currently receiving welfare benefits.
58% of Americans Favor Vouchers for K–12 Private School
A solid majority (58%) of Americans favor a proposal that would allow parents to use a “voucher to enroll their children in a private school” with “government helping to pay the tuition” while 40% oppose.
African Americans, lower-income Americans, high school graduates, and Republicans are most likely to favor letting parents use vouchers to send their kids to private school.
More than two-thirds (69%) of African Americans support school vouchers, compared to 56% of White and Latino Americans.
Nearly three-fourths (73%) of people with annual incomes below $20,000 and 64% of high school graduates support school vouchers. But support drops among those with incomes above $20,000 and college graduates to 55% and 52%, respectively. Nevertheless, slim majorities continue to favor the proposal.
Republicans (68%) and independents (61%) are more supportive of school vouchers than are Democrats (47%).
School vouchers divide Democrats. A strong majority (61%) of liberal Democrats oppose school vouchers while a solid majority (60%) of moderate Democrats favor them.
61% of Americans Support Tax Credits for Those Who Donate Toward Private School Scholarships
It is more expensive for a parent to send their children to a private school than a locally assigned public school. However, 61% of Americans favor a proposal to offer a tax credit to people or businesses “who donate to scholarships to help parents send their children to private school if they choose.” Another 37% oppose this proposal.
The proposal enjoys wide demographic and post-partisan support. Majorities of Black (62%), Latino (65%), and White (60%) Americans, as well as Democrats (52%), independents (66%), and Republicans (69%) all favor tax credits for donations to private school scholarships. However, the issue divides moderate and liberal Democrats. Two-thirds (67%) of moderate Democrats support the tax credit proposal while 56% of liberal Democrats oppose.
65% of Americans Support Offering Higher Salaries to Math and Science Teachers
Nearly two-thirds (65%) of Americans support offering higher salaries to math and science school teachers and 34% oppose. This proposal also enjoys post-partisan support: 71% of Democrats, 63% of independents, and 59% of Republicans favor raising salaries for math and science teachers.
Jobs
45% of Welfare Recipients Say Lack of Occupational License Barred Them or Someone They Know from Employment
About a third (34%) of Americans say the lack of a credential or license has prevented them or someone they know from getting a job they were capable of doing. Among Americans currently receiving means-tested welfare benefits, this share rises to nearly half (45%).
23% of Welfare Recipients Say Criminal Record Has Hindered Employment
Among Americans overall, 7% say a criminal record has been a barrier to them finding a job, but this share rises to 23% among current welfare recipients. Among all Americans, 21% say they know someone affected and 65% say they do not. Among welfare recipients, 31% know someone impacted and 43% do not.
Criminal Justice System
52% of Americans Rate Criminal Justice System as “Poor” for Preparing Inmates for Jobs
A slim majority (52%) of Americans rate the criminal justice system as “poor” for preparing prison inmates for finding a job and being a productive member of society after they get out prison. Another third (32%) rate the system as “fair.” Only 11% rate the system as “good” and 3% as “excellent.”
37% of Americans Say Criminal Justice System Treats Them Fairly
A little more than a third (37%) of Americans say the criminal justice system treats people like them fairly. About the same share (40%) say they do not believe the system treats people like them fairly, and about a quarter (22%) aren’t sure.
Class and race both contribute to perceptions of unfairness in the criminal justice system: People currently receiving welfare (54%) are more likely than nonrecipients (38%) to believe that the justice system does not treat people like them fairly. African Americans (66%) are far more likely than White Americans (33%) or Hispanic Americans (44%) to believe that the justice system treats people like them unfairly.
Putting race and income together, we find that White welfare recipients (52%) are far more likely to believe that the system is unfair to people like them than White nonrecipients (30%). Black Americans who have not previously received welfare (69%) are also far more likely than White Americans who have not previously received welfare (30%) to believe that the system is rigged against people like them.
55% of Americans Favor Decriminalizing Drug Offenses
Decriminalizing drugs would reduce the number of people who have difficulty finding employment because of a nonviolent drug offense. Thus the survey investigated what Americans think about recategorizing drug offenses as civil offenses.
A majority (55%) of Americans favor recategorizing drug offenses from felonies to civil offenses so that the offenses would be treated as minor traffic violations rather than crimes. Forty-four percent (44%) oppose this proposal.
Majorities of Democrats (69%) and independents (54%) support decriminalizing drug offenses, but a majority of Republicans (59%) oppose.
Acknowledgments
The author would like to thank David Kemp for his invaluable research assistance on this report. The author would also like to thank John Samples, Michael Tanner, Chris Edwards, and the many individuals who provided valuable input into the survey design and research process.
For questions, please contact:
Emily Ekins
eekins@cato.org
Appendices
Appendix A: Belief in Personal Agency Index
To measure Americans’ beliefs about their personal agency (or their locus of control), the author created the Belief in Personal Agency Index based on the Internal Locus of Control scale used by psychologists.28 The scale is constructed by averaging responses to seven questions that psychologists use to measure a person’s belief that personal decisions or external forces determine the direction of people’s lives:
Belief in Personal Agency Index (BPAI)
-
When I get what I want, it’s usually because I worked hard for it
-
My life is determined by my own actions
-
I am usually able to protect my personal interests
-
When I make plans, I am almost certain to make them work
-
Whether or not I get to be a leader depends mostly on my ability
-
How many friends I have depends on how nice a person I am
-
Whether or not I get into a car accident depends mostly on how good a driver I am
The Cronbach’s alpha for the seven items is .73, which indicates these survey questions are suitable to combine into a composite measure. Each of the questions had response options ranging 1–5. The questions asked respondents their level of agreement with a series of statements with 1 indicating strongly disagree and5indicating strongly agree. Respondents’ answers to these seven questions were averaged together such that lower scores indicate the person has less belief in personal agency (and emphasizes the role of external forces),and higher scores indicate the person has more belief in personal agency (and emphasizes the role of personal choices).
The BPAI was then divided into quarters such that roughly the first 25% of respondents scoring the lowest were assigned to Group 1 (Low BPAI), the respondents scoring 26–50% along the scale were assigned to Group 2 (Low-Med BPAI), the respondents scoring 51–75% were assigned to Group 3 (Med-High BPAI), and the respondents scoring 76–100% were assigned to Group 4 (High BPAI). Respondents in Group 4 are identified in this report as scoring “high” on BPAI, and respondents in Group 1 are identified as scoring “low” on BPAI.
Appendix B: Just Deserts Index
To measure Americans’ preference for a “reap what you sow” conception of economic justice, or just deserts, the author created the Just Deserts Index.The scale is constructed by averaging responses to four questions used to measure a person’s preference for just deserts. The questions are based on the Fairness as Proportionality moral foundation in Moral Foundations Theory.
Just Deserts Index (JDI)
-
Rewards and benefits in society should be distributed according to what people need, not what they produce (if disagree)
-
People should be allowed to keep what they produce, even if there are others with greater needs
-
It’s more important to help meet the needs of people than let people keep what they make (if disagree)
-
Our society would have fewer problems if people focused more on earning and producing and less about how equal everybody is
The Cronbach’s alpha for the four items is .75, which indicates these survey questions are suitable to combine into a composite measure of preference for just deserts. Each of the questions had response options ranging 1–5. The questions asked respondents their level of agreement with a series of statements with 1 indicating strongly disagree and 5 indicating strongly agree. Agreement with statements 2 and 4 and disagreement with statements 1 and 3 indicate more resentment. Respondents’ answers to these four questions were averaged together such that lower scores indicate a lower preference for just deserts and higher scores indicate a higher preference for just deserts.
The JDI was then divided into quarters such that roughly the first 25% of respondents scoring the lowest were assigned to Group 1 (Low JDI), the respondents scoring 26–50% along the scale were assigned to Group 2 (Low-Med JDI), the respondents scoring 51–75% were assigned to Group 3 (Med-High JDI), and the respondents scoring 76–100% were assigned to Group 4 (High JDI). Respondents in Group 4 are identified in this report as scoring “high” on JDI,and respondents in Group 1 are identified as scoring “low” on JDI.
Appendix C: Dispositional Compassion Index
To measure Americans’ propensity to feel compassion, or empathy, the author created the Dispositional Compassion Index based on the Dispositional Compassion scale used by psychologists.30 The scale is constructed by averaging responses to seven questions psychologists use to measure a person’s dispositional compassion, or propensity to empathize with others:
Dispositional Compassion Index (DCI)
-
Agree: I feel sympathy for those who are worse off than myself
-
Agree: I sympathize with the homeless
-
Agree: I suffer from others’ sorrows
-
Disagree: I can’t stand weak people
-
Disagree: I am not interested in other people’s problems
-
Disagree: I try not to think about the needy
-
Disagree: I tend to dislike soft-hearted people
The Cronbach’s alpha for the seven items is .73, which indicates these survey questions are suitable to combine into a composite measure of dispositional compassion. Each of the questions had response options ranging 1–5. The questions asked respondents their level of agreement with a series of statements with 1 indicating strongly disagree and5indicating strongly agree.Respondents’ answers to these seven questions were averaged together such that lower scores indicate a lower level of dispositional compassion, or empathy,and higher scores indicate a higher level of dispositional compassion, or empathy.
The DCI was then divided into quarters such that roughly the first 25% of respondents scoring the lowest were assigned to Group 1 (Low DCI), the respondents scoring 26–50% along the scale were assigned to Group 2 (Low-Med DCI), the respondents scoring 51–75% were assigned to Group 3 (Med-High DCI), and the respondents scoring 76–100% were assigned to Group 4 (High DCI). Respondents in Group 4 are identified in this report as scoring “high” on DCI, and respondents in Group 1 are identified as scoring “low” on DCI.
Appendix D: Dispositional Envy Index
To measure Americans’ propensity to feel envy, the author created the Dispositional Envy Index based on the Dispositional Envy scale used by psychologists.31 The scale is constructed by averaging responses to five questions psychologists use to measure a person’s dispositional envy:
Dispositional Envy Index (DEI)
-
I am troubled by feelings of inadequacy
-
Feelings of envy constantly torment me
-
The bitter truth is that I generally feel inferior to others
-
It is so frustrating to see some people succeed so easily
-
Frankly, the success of my neighbors makes me resent them
The Cronbach’s alpha for the five items is .86, which indicates these survey questions are suitable to combine into a composite measure of dispositional envy. Each of the questions had response options ranging 1–5. The questions asked respondents their level of agreement with a series of statements with 1 indicating strongly disagree and5indicating strongly agree. Respondents’ answers to these five questions were averaged together such that lower scores indicate a lower level of dispositional envy and higher scores indicate a higher level of dispositional envy.
The DEI was then divided into quarters such that roughly the first 25% of respondents scoring the lowest were assigned to Group 1 (Low DEI), the respondents scoring 26–50% along the scale were assigned to Group 2 (Low-Med DEI), the respondents scoring 51–75% were assigned to Group 3 (Med-High DEI), and the respondents scoring 76–100% were assigned to Group 4 (High DEI). Respondents in Group 4 are identified in this report as scoring “high” on DEI, and respondents in Group 1 are identified as scoring “low” on DEI.
Appendix E: Resentment of High Achievers Index
To measure Americans’ propensity to feel resentment toward high achievers, the author created the Resentment of High Achievers Index based on the Tall Poppy Scale used by psychologists.32 The scale is constructed by averaging responses to six questions psychologists use to measure a person’s propensity to feel resentment and envy in upward social comparisons:
Resentment of High Achievers Index (RHAI)
-
It’s good to see very successful people fail occasionally
-
People who always do a lot better than others need to learn what it’s like to fail
-
Very successful people sometimes need to be brought down a peg or two even if they’ve done nothing wrong
-
It’s very important for society to support and encourage people who are very successful (if disagree)
-
People at the top usually deserve their high position (if disagree)
-
One ought to be sympathetic to very successful people when they experience failure (if disagree)
The Cronbach’s alpha for the six items is .68, which indicates these survey questions are suitable to combine into a composite measure. Each of the questions had response options ranging 1–5. The questions asked respondents their level of agreement with a series of statements with 1 indicating strongly disagree and5indicating strongly agree. Agreement with statements 1–3 and disagreement with statements 4–6 indicate more resentment. Respondents’ answers to these six questions were averaged together such that lower scores indicate a lower level of resentment and higher scores indicate a higher level of resentment.
The RHAI was then divided into quarters such that roughly the first 25% of respondents scoring the lowest were assigned to Group 1 (Low RHAI), the respondents scoring 26–50% along the scale were assigned to Group 2 (Low-Med RHAI), the respondents scoring 51–75% were assigned to Group 3 (Med-High RHAI), and the respondents scoring 76–100% were assigned to Group 4 (High RHAI). Respondents in Group 4 are identified in this report as scoring “high” on RHAI, and respondents in Group 1 are identified as scoring “low” on RHAI.
Appendix F: Comparing Impact of Compassion for the Needy and Resentment of High Achievers
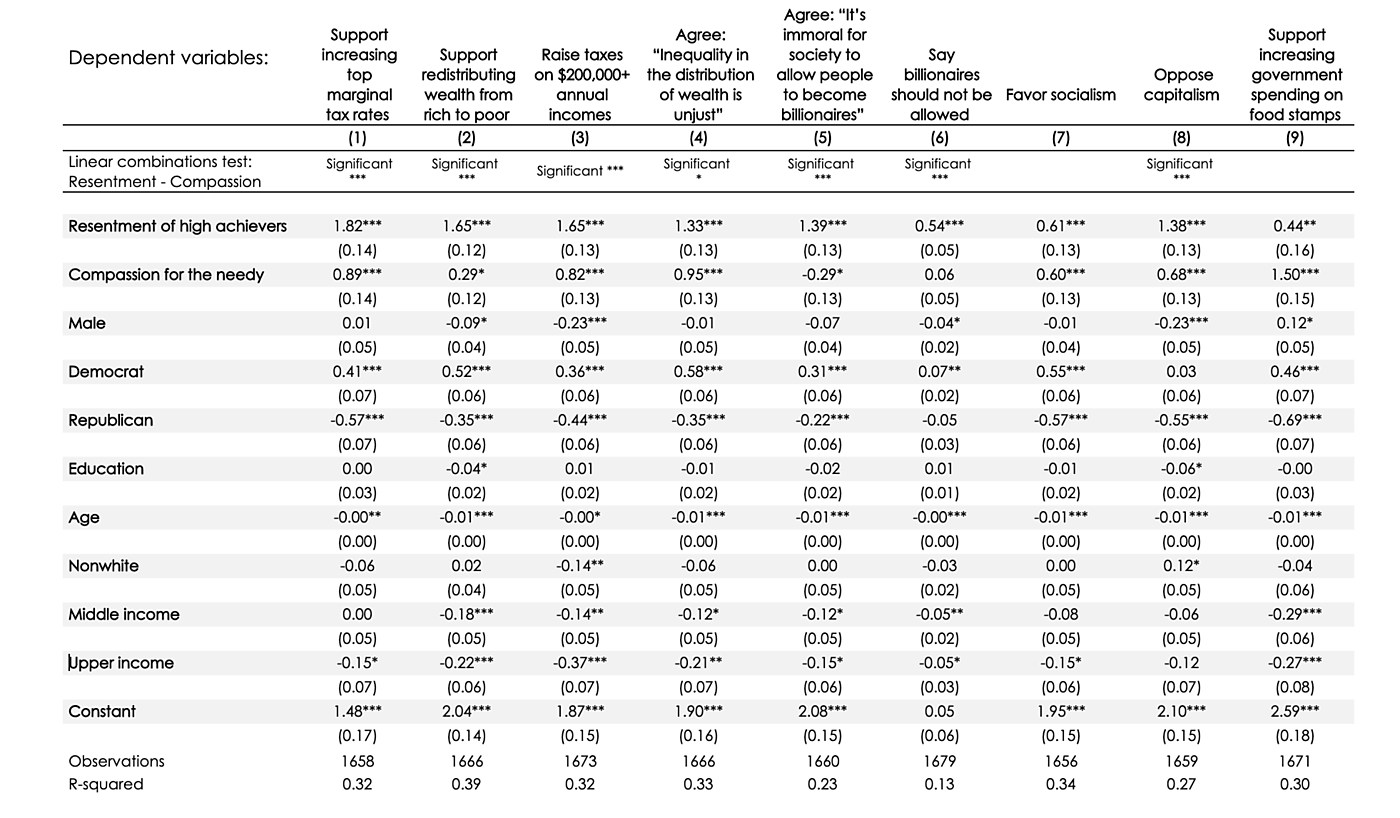
Models estimated using ordinary least squares (OLS) regression.Standard errors in parenthesis,* p<0.05 ** p<0.01 *** p<0.001.
The table reports results from nine separate OLS regressions that compare the effects of resentment and compassion on (1) support for raising top marginal tax rates, (2) support for redistributing wealth from therich to the poor, (3) support for increasing income taxes on incomes above $200,000, (4) agreement that the wealth distribution is unjust in the U.S., (5) agreement that it’s immoral for society to allow people to become billionaires, (6) agreement that billionaires shouldn’t be allowed, (7) favor ability toward socialism, (8) antipathy toward capitalism,and(9) support for increasing government spending on food assistance. The table shows that both resentment and compassion are both significant predictors in eight of the nine models. Only resentment, not compassion, predicts agreement that billionaires should not be allowed. Also compassion has a negative relationship with the belief that it’s immoral for society to allow billionaires. This indicates that more compassionate people are less likely to agree. Linear combinations of estimates tests were run after each model to compare the effect of resentment towardhigh achievers and compassion for the needy. Resentment toward high achievers is a significantly more influential predictor than compassion for the needy in each of the models except for favor ability toward socialism and support for increasing government spending on food assistance. Compassion for the needy is a significantly larger predictor than resentment in the model predicting support for increasing spending on food stamps. Compassion and resentment are equally important predictors for the model predicting favor ability toward socialism. These results suggest that resentment of high achievers may be a more powerful motivator than compassion in explaining support for raising taxes on the wealthy, antipathy toward capitalism, and skepticism of billionaires.
Survey Methodology
The Cato Institute 2019 Welfare, Work, and Wealth Survey was conducted by the Cato Institute in collaboration with YouGov. YouGov collected responses March 5–8, 2019, from 1,700 Americans 18 years of age and older. These were then matched into a nationally representative sample to produce the final dataset. Results have been weighted to be representative of the national adult sample. The margin of error for the survey is +/- 2.2 percentage points at the 95% level of confidence. This does not include other sources of non-sampling error, such as selection bias in panel participation or response to a particular survey.
YouGov conducted the surveys online with its proprietary web-enabled survey software using a method called Active Sampling. Restrictions are put in place to ensure that only the people selected and contacted by YouGov are allowed to participate.
The respondents in each survey were matched to a sampling frame on gender, age, race, education, party identification, ideology, and political interest. The frame was constructed by stratified sampling from the full 2010 American Community Survey sample with selection within strata by weighted sampling with replacements (using the person weights on the public use file). Data on voter registration status and turnout were matched to this frame using the November 2010 Current Population Survey. Data on interest in politics and party identification were then matched to this frame from the 2007 Pew Religious Life Survey as well as other media polls.
Each set of matched cases were weighted to its sampling frame using propensity scores. The matched cases and the frame were combined, and a logistic regression was estimated for inclusion in the frame. The propensity score function included age, gender, race/ethnicity, years of education, ideology, non-identification with a major party, political interest, and census region. The propensity scores were grouped into deciles of the estimated propensity score in the frame and post-stratified according to these deciles. For the final dataset, sample weights were post-stratified to match the full stratification of a five-category age, four-category race, two-category gender, and four-category education.
About the Author


This work is licensed under a Creative Commons Attribution-NonCommercial-ShareAlike 4.0 International License.