Executive Summary
Both the American left and right often use “national security” to justify sweeping proposals for new U.S. protectionism and industrial policy. “Free markets” and a lack of government support for the manufacturing sector are alleged to have crippled the U.S. defense industrial base’s ability to supply “essential” goods during war or other emergencies, thus imperiling national security and demanding a fundamental rethink of U.S. trade and manufacturing policy. The COVID-19 crisis and U.S.-China tensions have amplified these claims.
This resurgent “security nationalism,” however, extends far beyond the limited theoretical scenarios in which national security might justify government action, and it suffers from several flaws.
First, reports of the demise of the U.S. manufacturing sector are exaggerated. Although U.S. manufacturing sector employment and share of national economic output (gross domestic product) have declined, these data are mostly irrelevant to national security and reflect macroeconomic trends affecting many other countries. By contrast, the most relevant data—on the U.S. manufacturing sector’s output, exports, financial performance, and investment—show that the nation’s total productive capacity and most of the industries typically associated with “national security” are still expanding.
Second, “security nationalism” assumes a need for broad and novel U.S. government interventions while ignoring the targeted federal policies intended to support the defense industrial base. In fact, many U.S. laws already authorize the federal government to support or protect discrete U.S. industries on national security grounds.
Third, several of these laws and policies provide a cautionary tale regarding the inefficacy of certain core “security nationalist” priorities. Case studies of past government support for steel, shipbuilding, semiconductors, and machine tools show that security-related protectionism and industrial policy in the United States often undermines national security.
Fourth, although the United States is not nearly as open (and thus allegedly “vulnerable”) to external shocks as claimed, global integration and trade openness often bolster U.S. national security by encouraging peace among trading nations or mitigating the impact of domestic shocks.
Together, these points rebut the most common claims in support of “security nationalism” and show why skepticism of such initiatives is necessary when national security is involved. They also reveal market-oriented trade, immigration, tax, and regulatory policies that would generally benefit the U.S. economy while also supporting the defense industrial base and national security.
Theoretical Justifications for National Security Protectionism and Industrial Policy
“National security” has long been invoked to justify government policies intended to support manufacturing in case of war or another emergency. The justification has been offered not only by trade skeptics and supporters of industrial policy (i.e., targeted and directed government efforts to plan for specific future industrial outputs and outcomes1) from Alexander Hamilton to Donald Trump but also by advocates of free markets.2
The general argument of each side is similar: open markets may be good in most cases, but ensuring the productive capacity of essential manufacturing sectors can warrant the imposition of tariffs, subsidies, or other types of industrial planning. Trade skeptics and industrial policy advocates go further, however, by arguing that American “deindustrialization” (and, by extension, “dependency” on foreign production) justifies interventionist U.S. trade and economic policy. Indeed, the absence of such policies is often alleged to have caused the manufacturing sector’s demise. Related to the first point, the skeptics and industrial policy advocates are also trusting of the efficacy of protectionism and industrial policy to achieve national security objectives. These same individuals further assume that open trade is incompatible with national security and economic “resiliency.”
An April 2020 op-ed from Sen. Marco Rubio (R‑FL) is indicative of the interventionist case:
Any prudent policymaker should recognize that both efficiency and resiliency are values we should prioritize and seek to balance. But that’s not what we have done in recent decades. [U.S. economic policy] choices, from offshoring to building an economy based on finance and service, have produced one of the most efficient economic engines of all time. But a pendulum can swing too far in one direction. And when an economy lacks resiliency, it can be devastating in a crisis.…
Today, the result of these failed policy choices is that our manufacturing base is severely diminished, and millions of productive jobs that relied on it are gone. The American domestic supply chain devoted to producing vital medical supplies like generic pharmaceuticals and respirators has withered.3
Rubio goes on to claim that these problems require “a new vision to create a more resilient economy” and proposes a “sweeping pro-American industrial policy” that involves “re-shoring of supply chains integral to our national interest—everything from basic medicines and equipment to vital rare-earth minerals and technologies of the future.” And he is certainly not alone: prominent politicians and pundits on the right and left routinely lament the harms that “deindustrialization” has imposed on U.S. national and economic security and propose “sweeping” programs (protectionism, domestic procurement mandates, subsidies, etc.) to fix this alleged problem.
Free marketers largely reject the interventionist critique but do acknowledge the potential need for security-related protectionism and industrial policy. Adam Smith explained in The Wealth of Nations that one of the “two cases in which it will generally be advantageous to lay some burden upon foreign for the encouragement of domestic industry” is “when some particular sort of industry is necessary for the defence of the country.“4 Smith noted that Great Britain’s military, for example, needed to maintain “the number of its sailors and shipping” and therefore supported measures to promote the domestic shipping industry at the expense of domestic consumers or other countries. Two centuries later, Milton and Rose Friedman noted that while “the argument that a thriving domestic steel industry, for example, is needed for defense … is more often a rationalization for particular tariffs than a valid reason for them, it cannot be denied that on occasion it might justify the maintenance of otherwise uneconomical productive facilities.“5 To this day, stalwart defenders of open trade and free markets permit a “national security” exception to those policies.6
However, these same scholars are quick to limit the national security exception. After granting the “defence” basis for Britain’s Navigation Acts, for example, Smith explained that it arose during a time of “violent animosity” between Britain and Holland—not merely in expectation of such hostilities—and was specifically needed to reduce “the naval power of Holland, the only naval power which could endanger the security of England.” He added that it would “very seldom” be “reasonable” to pursue such protectionism (“to tax the industry of the great body of the people” so as not “to depend upon our neighbors for the supply”).7
The Friedmans were more direct (and skeptical): “To go beyond this statement of possibility and establish in a specific case that a tariff or other trade restriction is justified in order to promote national security, it would be necessary to compare the cost of achieving the specific security objective in alternative ways and establish at least a prima facie case that a tariff is the least costly way. Such cost comparisons are seldom made in practice.“8 Contemporary economists and free marketers have reiterated such concerns: “Given the negative impact of tariffs on wealth, when they are proposed, even under the national defense justification, they should be carefully examined to see if there is a true national defense issue or if domestic firms are merely justifying tariffs for protection from competition.“9
This skepticism—mostly absent from Washington—is indeed warranted: analyses of the U.S. manufacturing sector and the relationship between trade and national security, as well as the United States’ long and checkered history of security-related protectionism, undermine the theoretical justifications for imposing protectionism and industrial policy in the name of national defense. Instead, open trade, freer markets, and global interdependence will in almost all cases produce better outcomes in terms of national security and, most importantly, preventing wars and other forms of armed conflict.
The Reality of American Manufacturing and National Security
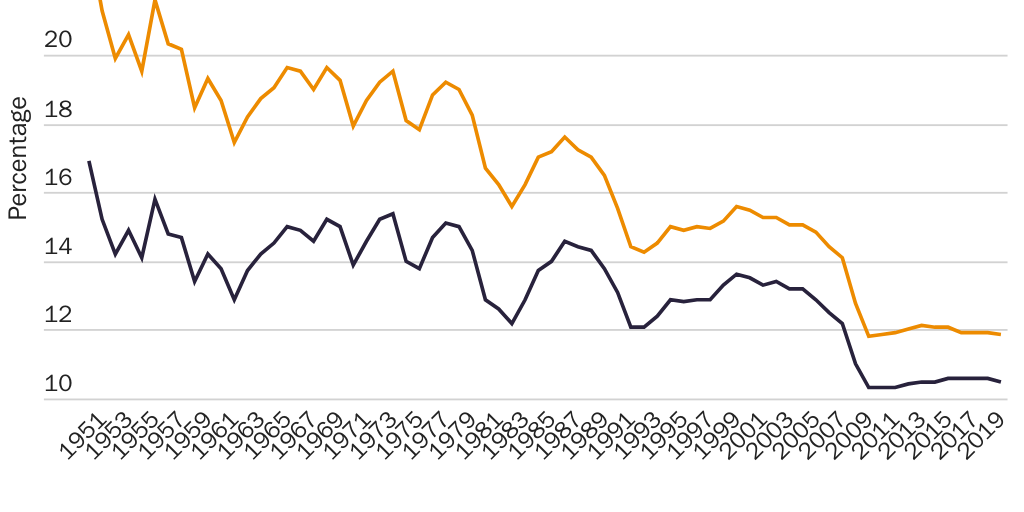
Today’s security nationalists often emphasize two trends—declining U.S. manufacturing employment and the sector’s declining share of U.S. economic output (as measured by gross domestic product [GDP])—when lamenting American industrial decline and proposing new policies to support domestic manufacturing and national security. Figure 1 shows that both trends have occurred.
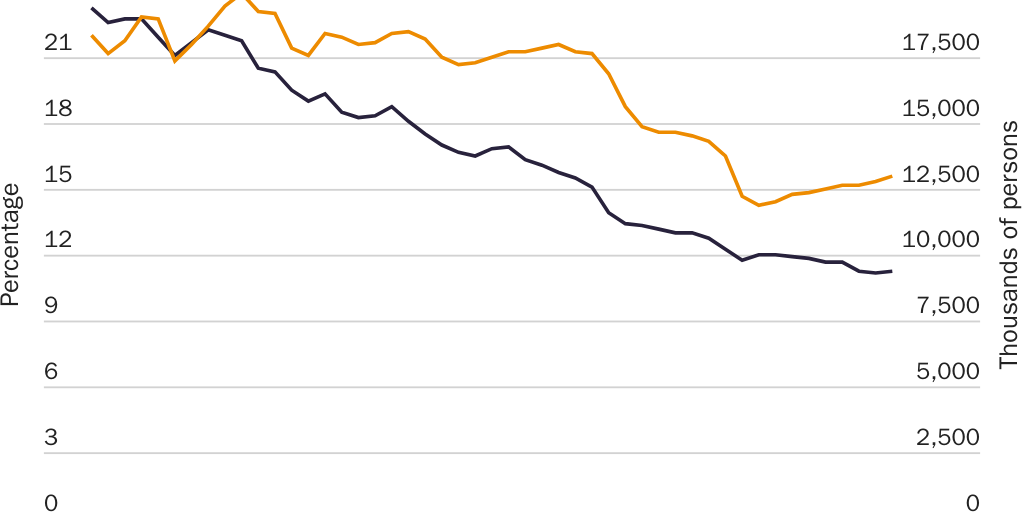
However, these trends provide little insight into the state of the U.S. defense industrial base or government policies affecting it, because they primarily reflect secular, global macroeconomic forces mostly unaffected by domestic policy and say little about the productive capacity of the United States overall or of the industries that are most essential to U.S. national security.
Secular Trends Driving Changes to U.S. (and Global) Manufacturing
Both declining manufacturing jobs and the sector’s declining share of GDP primarily reflect long-term global trends disconnected from specific economic policies, whether “free market” or “interventionist.”
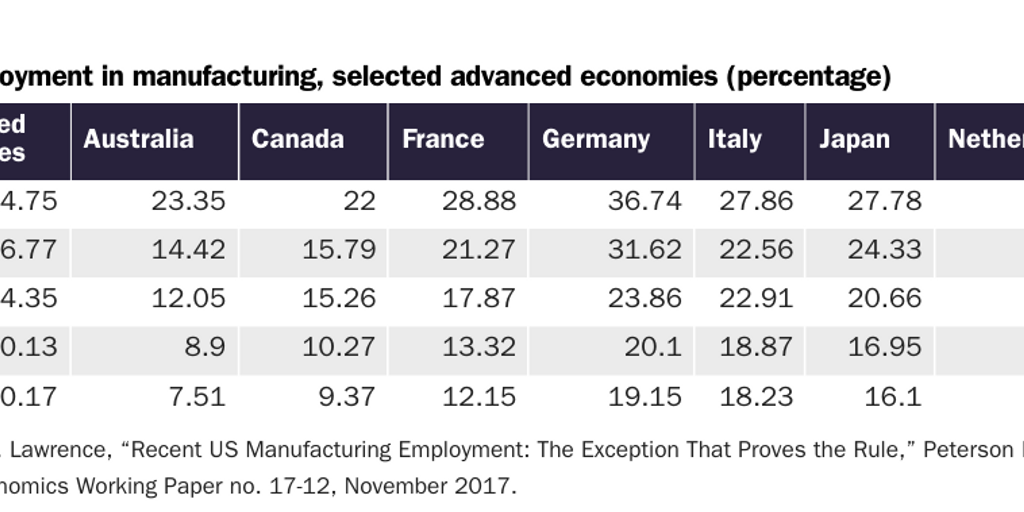
Jobs. The long-term decline in U.S. manufacturing jobs coincided with rising sector output and was mirrored in developed countries around the world—including those with economies more centered on manufacturing, with long-standing trade surpluses in goods, or with more aggressive industrial policies.10 (See Table 1 and Figure 2.) In fact, Robert Lawrence’s 2020 examination of 60 countries between 1995 and 2011 found that nations with manufacturing trade surpluses experienced slightly larger declines in manufacturing employment than those with manufacturing trade deficits and that manufacturing job losses were as large in countries with “improving” manufacturing trade balances over this period as those with “worsening” ones.11
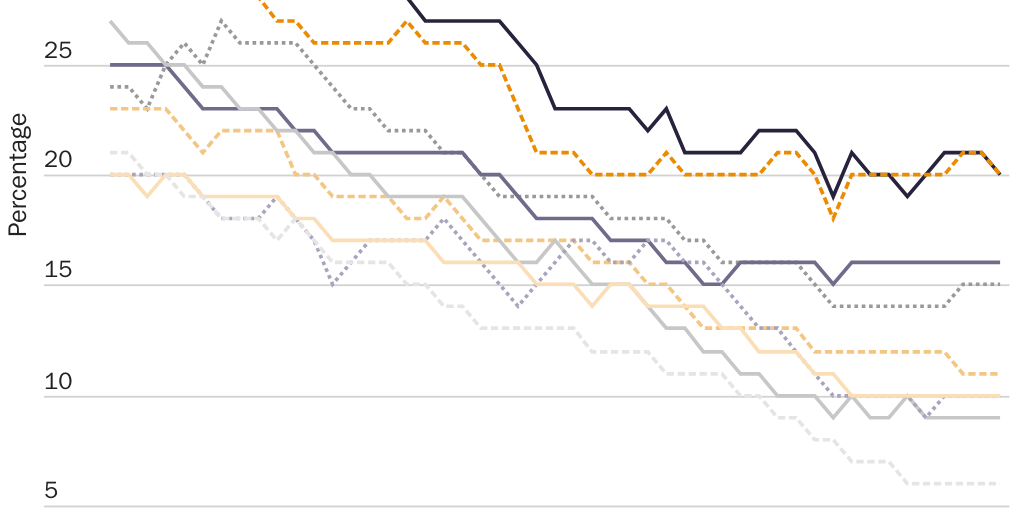
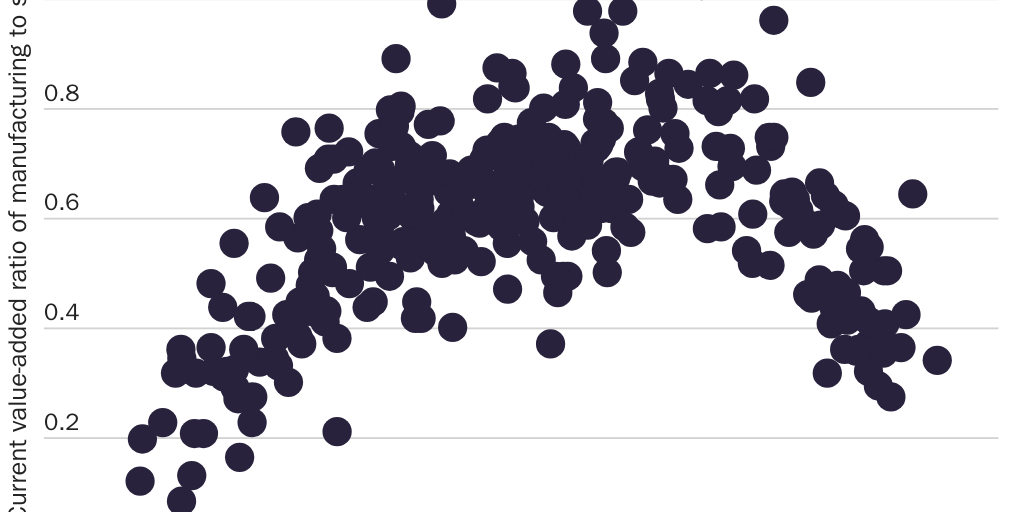
As shown in Figure 3, countries generally follow the same inverted‑U pattern of economic development, first adding and then losing manufacturing jobs as they develop.
Figures 1–3 establish that, though manufacturing in some countries represents a larger total share of a country’s domestic workforce than in the United States, the loss of manufacturing jobs—and thus the basis for any “deindustrialization” claim—is happening around the world. (Despite recent U.S. industrial job gains, the U.S. Bureau of Labor Statistics expects the longer-term downward trend to continue in the next decade, projecting a loss of almost 445,000 U.S. manufacturing jobs from 2019 to 2029.12) Thus, for example, U.S. policy might have been able to increase overall manufacturing employment at some point, but the trends—including the significant decline in jobs from the late 1990s to the late 2000s—would have remained essentially unchanged.13 Therefore, the changes in manufacturing jobs alone provide little insight into the state of American manufacturing or related U.S. policies.
Aggregate employment trends also say little about the ability of U.S. workers to produce essential goods during a national emergency. For example, U.S. manufacturing employment increased by almost 1 million jobs between 2010 and 2018, “outperforming” Germany, Japan, and China in the process. However, over the same period, real manufacturing value-added per worker and per hour worked in the United States increased by only 0.3 percent per year and 0.1 percent per year, respectively, as compared to 5.6 percent and 5.7 percent per year between 2000 and 2008—a time of significant manufacturing job loss in the United States.14 In other words, American workers were improving their ability to produce manufactured goods (and thus to supply the economy in times of war or other emergency) at a much more rapid pace during the height of “deindustrialization” than during the subsequent period of “reindustrialization.” In reality, neither job gains nor job losses demonstrate a vibrant (or lagging) American industrial sector. There also is little to indicate that U.S. manufacturing jobs deserve special government support.15
GDP Share. Manufacturing’s declining share of total U.S. GDP also reflects secular trends largely disconnected from U.S. government policy. First, the change in the industrial sector’s GDP share reflects the relative strength of the U.S. services sector instead of the weakness of American manufacturing. Indeed, between 1997 and 2019, real gross output and real value-added of private services–producing industries increased by 87 percent and 77.4 percent, respectively, while the same metrics for U.S. manufacturing increased by a slower-but-still-respectable 18.7 percent and 52.8 percent—continuing long-term trends in these U.S. sectors dating back to the 1940s.16
Second, the relative growth of services versus manufacturing reflects fundamental shifts in consumption patterns in the United States and other countries away from goods and toward services.17 In the United States, “consumers, government, and investors have been devoting declining shares of nominal spending to goods relative to services” since the 1960s, and “the overall impact, inclusive of investment expenditure on equipment and software, was a decline in nominal US spending on goods relative to services by 1.47 log points (percent) per year over the entire period.“18 Thus, U.S. consumers were allocating half of all their spending on consumption to goods—50.3 percent—in 1960 but only 33 percent by 2010. Over the same period, U.S. government consumption and investment expenditure on goods dropped from 61 percent to 42 percent.19 As shown in Figure 4, Americans’ consumption of durable goods as a share of total consumption has similarly declined since the 1950s.
These relative consumption trends coincide with the U.S. manufacturing sector’s declining share of U.S. GDP (see Figure 1), and these factors have coincided over time: documenting trends in U.S. consumption and manufacturing value-added between 1900 and 2000, for example, economists Francisco Buera and Joseph Kaboski found a “strong connection” between the two.20 The onset of COVID-19 in the United States again showed the link between consumer spending and manufacturing sector performance: U.S. manufacturers during the summer of 2020 outperformed domestic service providers because several factors—including “catch-up” purchases that were delayed in the spring; continued restrictions on many services; consumer unease about public exposure; and stimulus payments—had pushed homebound Americans to increase their relative consumption of goods over this period.21
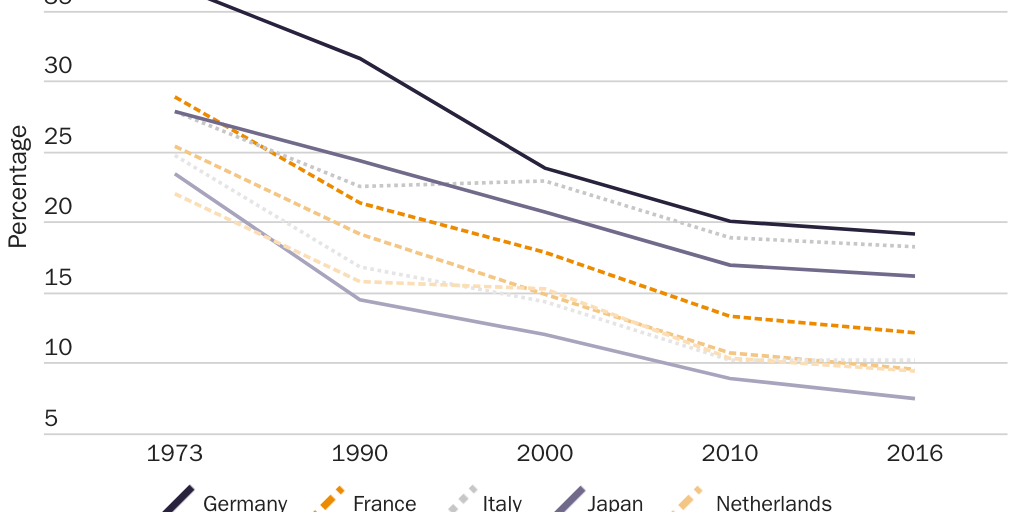
Nor are the consumption and output trends limited to the United States or even other developed countries.22 Lawrence Edwards and Robert Lawrence found that the share of national spending on goods between 1970 and 2010 declined at a similar rate in Australia, Canada, Denmark, France, Italy, South Korea, the Netherlands, the United Kingdom, and the United States (though the United States had the lowest total share [34 percent] by 2010).23 As shown in Figure 5, advanced economies’ manufacturing-GDP shares followed suit.
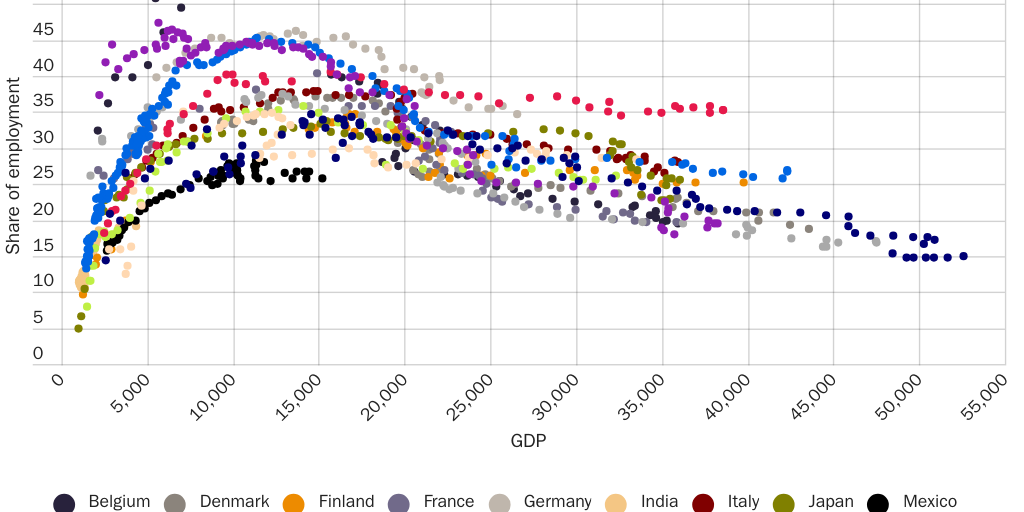
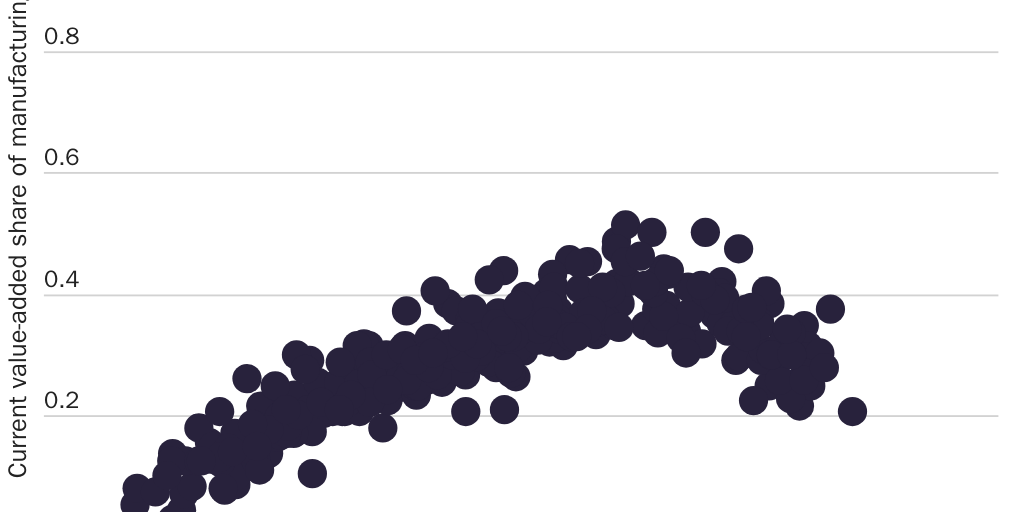
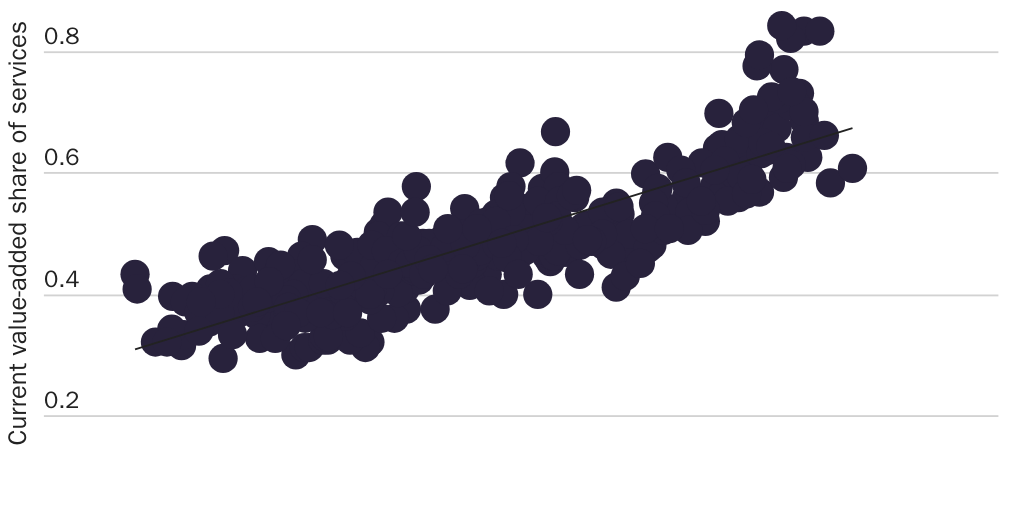
The declining role of manufacturing in a nation’s economy is a standard story of economic development, not cause for alarm or criticism of national economic policy. As shown in Buera and Kaboski’s 2012 examination of 31 countries representing 68 percent of world population and 80 percent of 2000 GDP (reproduced in Figures 6a, 6b, 6c, and 7), both the manufacturing sector’s share of total value-added (Figure 6a) and its relationship to services value-added (see Figure 7) follow the same inverted‑U pattern (increasing then decreasing) as every nation develops.24 Each country’s experience with services (see Figure 6b) and agriculture (see Figure 6c) is also similar to those of other countries.

In sum, both the manufacturing employment and GDP-share trends occurring in the United States reflect macroeconomic forces affecting most industrialized countries around the world in the same way and thus cannot be a proxy for the state of the U.S. manufacturing sector or an indicator of the success or failure of previous U.S. policy.
U.S. Productive Capacity Remains High Both Overall and in Security-Related Industries
Furthermore, employment and GDP share trends say little about the nation’s “industrial capabilities” (i.e., its ability to produce the goods that the country needs in times of war or other national emergencies), which along with access to similar capabilities abroad is what the U.S. Department of Defense (DOD) considers critical for national security.25 By this metric, the United States shows little weakness. Despite popular claims that the United States has suffered a broad decline in productive capacity, the U.S. manufacturing sector actually remains among the most productive in the world and has expanded since the 1990s—continuing earlier period trends in output, investment, and profitability that the Cato Institute’s Daniel Ikenson documented in 2007.26 Also, the manufacturing industries most closely associated with “national security” (e.g., metals, transportation, defense, computers and electronics, pharmaceuticals, and medical goods) have prospered.
The United States Remains a Global Manufacturing Leader. Comparisons of U.S. manufacturing with other countries’ sectors (see Table 2) show that the United States continues to be at or near the top of most categories, including output, exports, and investment.
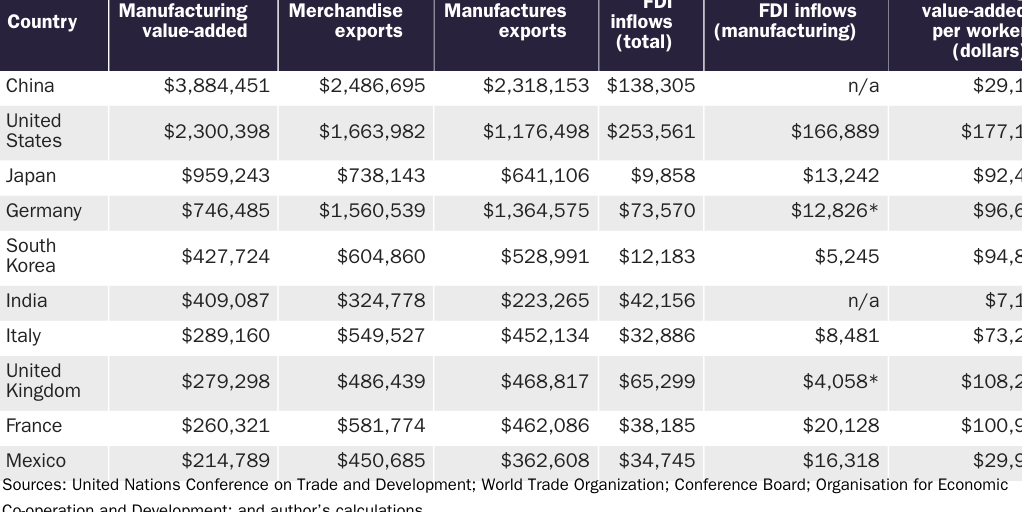
As shown in Table 2, the United States in 2018 ranked second in the world in total real manufacturing value-added and merchandise exports. The United States ranked third globally for exports of “manufactures”; however, this category excludes important U.S. manufactured goods such as fuels and certain foods, and European Union (EU) bloc and country numbers are inflated because they include intra-EU trade (e.g., German exports to France).27 The U.S. manufacturing sector’s performance is also strong on a per capita or per manufacturing worker basis, outperforming China and several other top manufacturing countries. Among Organisation for Economic Co-operation and Development nations, moreover, the United States is the top recipient of manufacturing foreign direct investment (FDI)—more than doubling the second-place nation. In 2018, FDI inflows into the U.S. manufacturing sector alone (almost $167 billion) were larger than total FDI inflows into China for the same year ($138 billion). Inward FDI stocks in the U.S. manufacturing sector reached $1.77 trillion that same year.28
In short, the United States remains a major global manufacturer and a top destination for manufacturing investment.
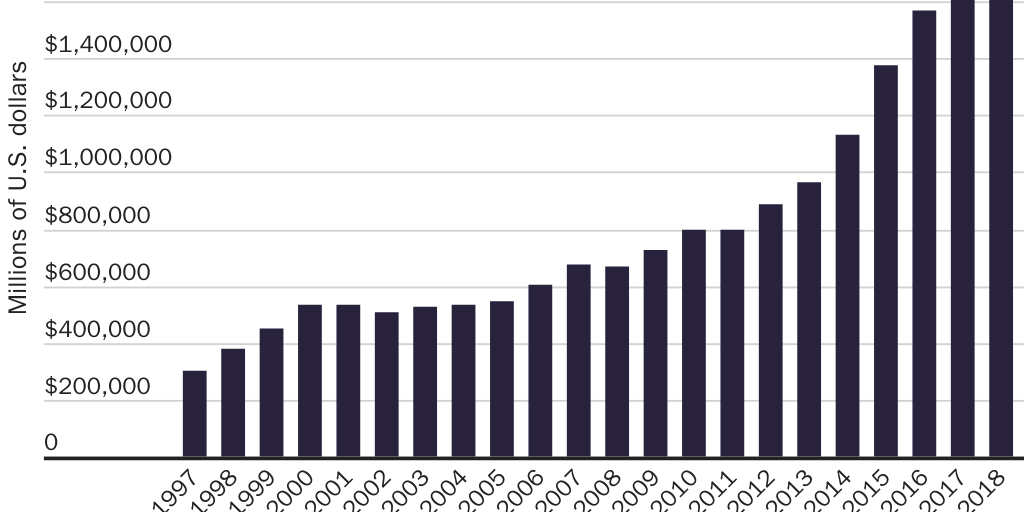
The United States’ Industrial Capabilities Keep Expanding. Second, historical data on the U.S. manufacturing sector show it to be growing. As shown in Figure 8, real (inflation-adjusted) U.S. manufacturing value-added and gross output were up significantly between 1997 and 2018.
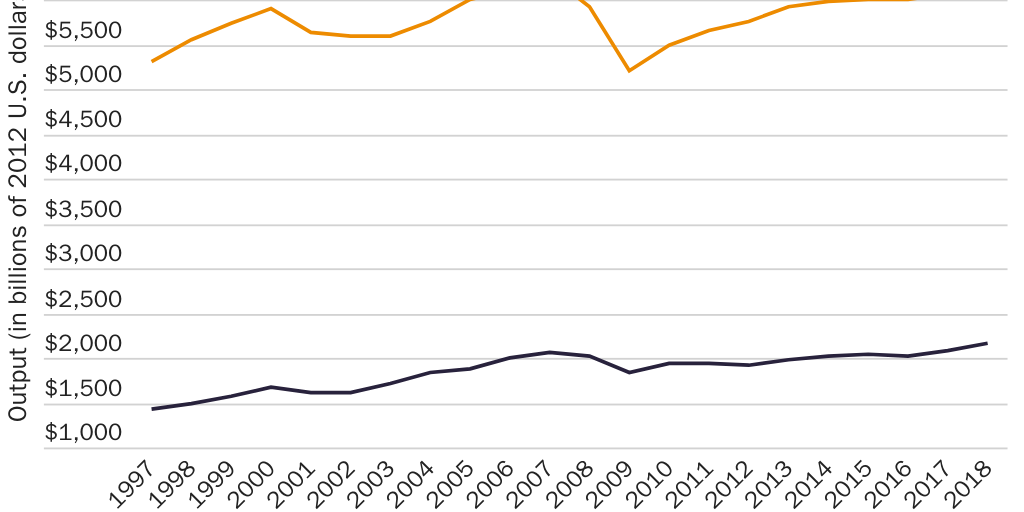
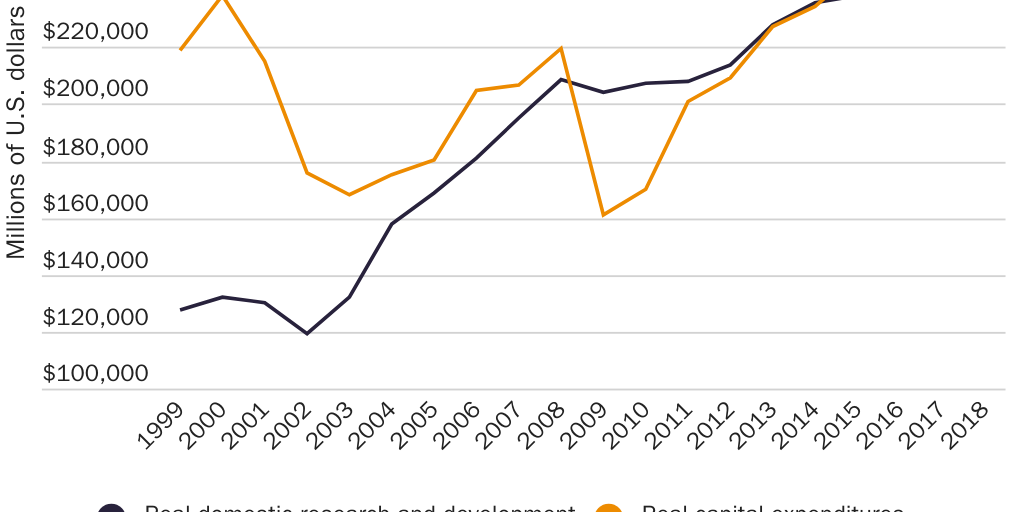
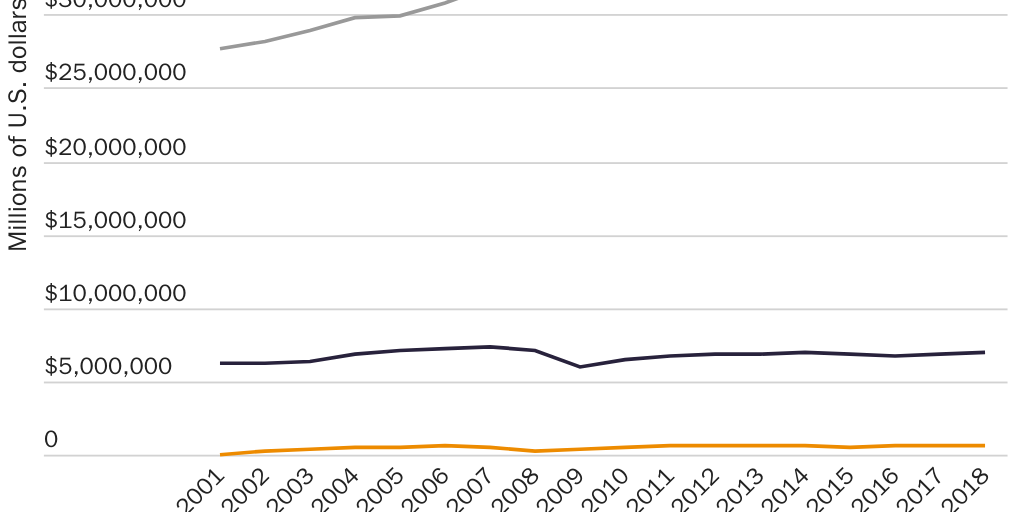
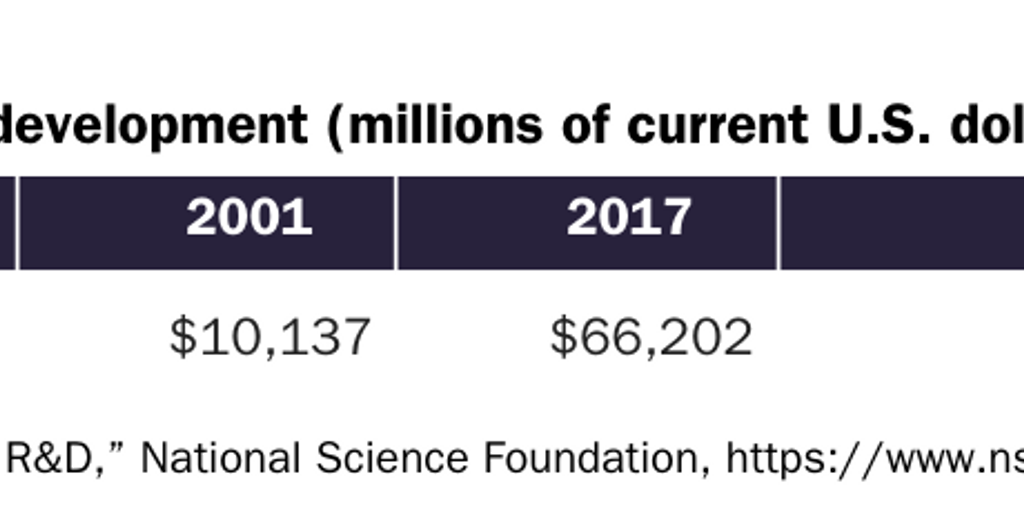
Furthermore, investment in the manufacturing sector—capital expenditures, research and development (R&D), and FDI—has been consistent and strong. (See Figures 9 and 10.) Finally, as shown in Figure 11, the sector has also experienced improved financial performance since 2001 (the first year of data available), with inflation-adjusted gains in revenues, post-tax income, and assets.
Based on these and other data, the last two DOD reports on the U.S. defense industrial base concluded that it is “profitable and expanding” overall. In fact, the latest report for fiscal year 2019 (issued June 23, 2020) states that the largest six prime defense suppliers (Lockheed Martin, Boeing, Northrop Grumman, Raytheon, General Dynamics, and BAE Systems) “are financially healthy and continue to expand in market share” and that their “investments hit a six year high in 2018 at $33.9 billion with firms investing largely in acquisition of subsidiaries, R&D, and capital expenditures.“29
A longer-term view of these data is essential to evaluating the sector’s performance. Some of the more negative analyses of U.S. manufacturing provide an incomplete view because they fail to account for either the Great Recession, which collapsed global output and employment, or the manufacturing “mini-recession” in 2015–16, caused by an unexpected collapse in global oil prices—issues clarified by updating the data through 2018 (when U.S. trade conflicts halted the sector’s improvement).30 Indeed, the problems with taking a narrow snapshot are revealed by examining employment trends in the United States and other top manufacturing countries between 2010 and 2018. These data show that the United States (1.1 percent annual growth; 956,000 jobs gained) has had stronger employment growth than Germany (1.0 percent; 440,000 jobs), Japan (–0.4 percent; –229,000 jobs), and China (–0.5 percent; –9.5 million jobs).31 Just as it would be inappropriate to claim that this single datapoint captures the true state of these diverse, multitrillion dollar manufacturing sectors (or the national policies affecting them), so does using other short-term snapshots to argue the same.32
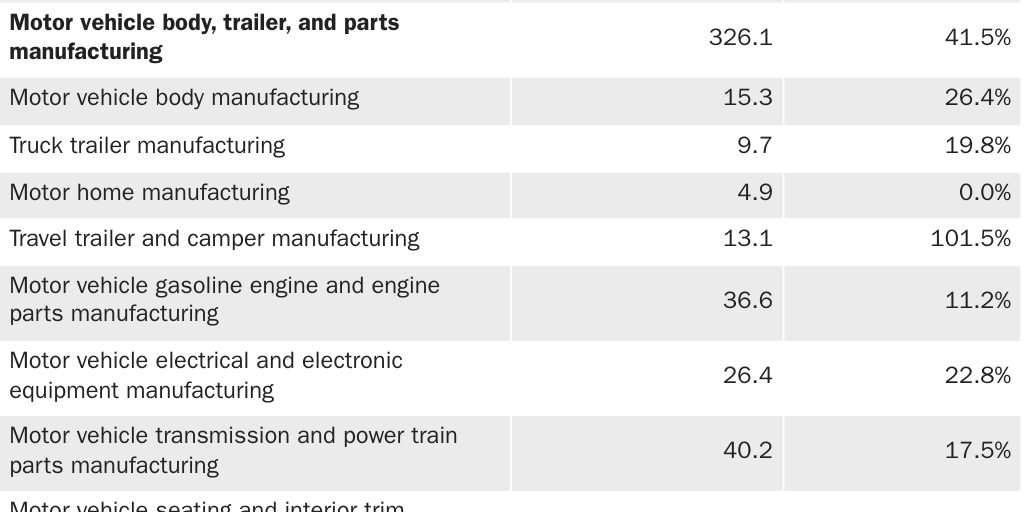
The topline data do, however, hide significant changes in the manufacturing sector over the past two decades in response to various economic forces. Some industries have indeed contracted since the 1990s, but often these changes reflect fundamental shifts in U.S. and global markets as opposed to a weak manufacturing sector. They are also often offset by gains in other, related industries. For example, as shown in Table 3, automobile manufacturing output dropped by almost 60 percent between 1997 and 2018, but light truck and SUV production grew by 175 percent over the same period.
This shift speaks to evolving U.S. consumer tastes (away from cars to SUVs) instead of American “deindustrialization” (though offshoring of some car production, especially to Mexico, has occurred). Furthermore, the high U.S. tariff on light trucks cannot explain increased U.S. SUV production, as only two-door SUVs are covered by the tariff. (The tariff also does not apply to imports from certain U.S. trade agreement partners.)33
These and other U.S. manufacturing data (see the Annex) also reveal a flexible and dynamic sector that is generally responsive to market forces—a flexibility that can prove critical in times of unexpected national emergency. For example, high demand for hand sanitizer, cleaning products, and face masks in the wake of COVID-19 caused small and large manufacturers across the country to retool their operations and thereby meet Americans’ essential material needs.34 This rapid transition is a testament to not only the hard work and ingenuity of U.S. retailers and manufacturers but also the United States’ economic dynamism and industrial capabilities more broadly.
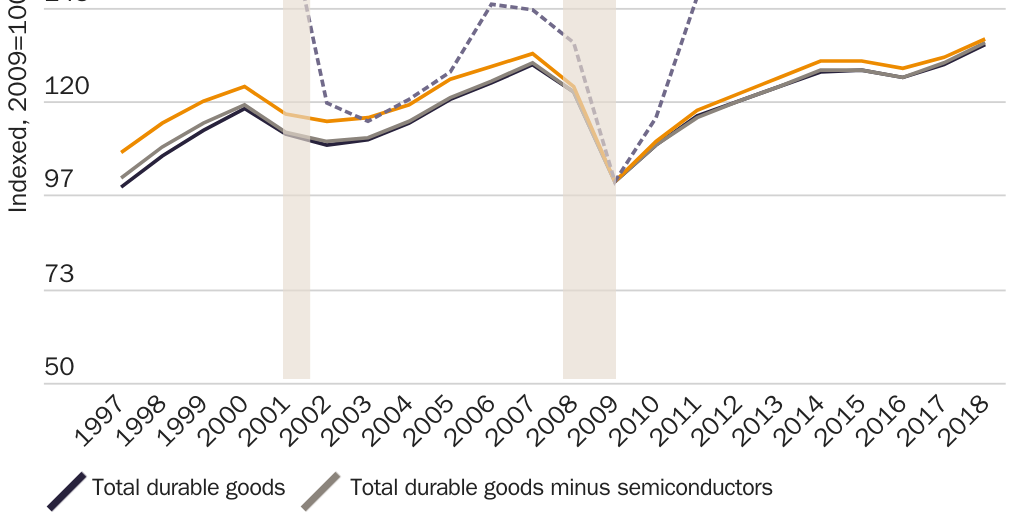
Industry-Specific Data Reveal Strength Where It Counts. Detailed breakdowns of U.S. manufacturing data also show a stark divide between durable goods (i.e., the goods such as metals, planes, and machinery that we most commonly associate with “national security”) and nondurable goods (e.g., food and textiles). In particular, U.S. durable goods production (real gross output and real value-added) has increased significantly—by 35.9 percent and 109 percent, respectively—since 1997 (see Figure 12), while nondurable goods output has sagged (see Table 4). The durable-goods gains are not, as some have claimed, merely the result of adjustments for increases in computing power.35 Excluding the entire computers and electronics industry (including semiconductors), U.S. durable goods’ real gross output and real value-added still increased by more than 26 percent and 60 percent, respectively, since 1997 and, excluding only semiconductors, 109.1 percent and 35 percent.
Eliminating these thriving sectors, of course, overcompensates for any technical adjustment issues, as U.S. computer, electronics, and semiconductor firms undoubtedly produce important and globally competitive products and employ hundreds of thousands of American workers. Doing so also raises questions about what other sectors may need to be discounted or excluded when evaluating the “true” state of the nation’s overall productive capacity. For example, should we also exclude the data for the paper and printing, tobacco, and magnetic and optical media (e.g., cassette tapes and CDs) industries—which have declined due to fundamental market changes and are thus unrelated to any “deindustrialization” concerns? Eliminating these industries would reveal even more impressive manufacturing sector gains since the late 1990s.
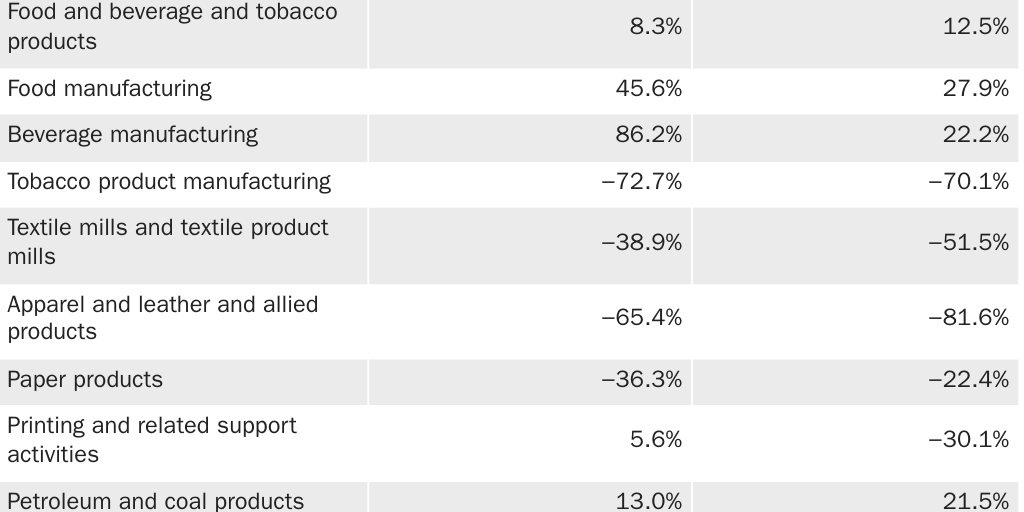
As shown in Table 4, moreover, declines in nondurable goods production have been driven by basic, low-margin consumables such as textiles and apparel; by tobacco; or by “dematerialized” goods such as paper—not other nondurables such as chemicals (including pharmaceuticals) and energy that might have a national security nexus.36 Remove the aforementioned decliners, and nondurable goods’ real value-added and gross output increase by 22.9 percent and 10.3 percent, respectively, between 1997 and 2018.
By contrast, the industries that are most closely tied to national security—including those now prioritized due to COVID-19—have not experienced significant historical declines and in most cases have expanded. (See Table 5.) This category includes the goods directly involved in national defense (e.g., tanks, missiles, and munitions), as well as those indirectly related, including metals, computer and electronic products (including or excluding semiconductors), motor vehicles, aerospace products, ships medical equipment, energy, chemicals, and pharmaceuticals. Although certain sub-industries’ output has risen and fallen over different periods (to be expected given business cycles, changing U.S. military operations, and other factors), the overall picture is one of stability and health, not decline.
These data also refute a common myth that industries unrelated to national security have driven gains in U.S. manufacturing output—the well-worn “we make potato chips, not microchips” argument. They also underscore why tying U.S. national security to trends in manufacturing employment or GDP share is so misguided.
Industry-level analyses corroborate these data in the two industries—semiconductors and medical goods—that Washington policymakers are now targeting for security-related support.
Semiconductors. Shortly before the end of the 116th Congress, both chambers approved by wide margins the National Defense Authorization Act for Fiscal Year 2021 (NDAA), which includes billions of dollars in federal support for the construction of domestic semiconductor manufacturing facilities and an R&D consortium. According to the Bureau of Economic Analysis (BEA), however, U.S. “semiconductor and other electronic compo-
nent manufacturing” production reached $113.4 billion in real gross output and $88 billion in real value-added in 2018.37 Real gross output for “semiconductor and related device manufacturing” alone reached $64.9 billion (more detailed value-added data are not available). The Semiconductor Industry of America (SIA) further notes that there are commercial semiconductor manufacturing facilities in 18 states, employing more than 240,000 Americans, and that the United States has 12.5 percent of global semiconductor manufacturing capacity.38 Furthermore, the largest share (44.3 percent) of U.S. companies’ production occurs in the United States (while only 5.6 percent is in China, whose alleged dominance was the stated justification for the subsidies).
The United States is also a top-five global exporter of semiconductors and related equipment, shipping almost $47 billion of those goods in 2019.39 These and other data led the SIA to conclude in its 2020 State of the U.S. Semiconductor Industry report that “the semiconductor manufacturing base in the United States remains on solid footing.“40
The SIA also reports that the U.S. industry has “nearly half” of all global semiconductor sales—a market share that has been steady (ranging from the mid-40s to low 50s) since the late 1990s—and is the top seller in every major regional market, including China. Sales by U.S. semiconductor firms also grew from $76.7 billion in 1999 to $192.8 billion in 2019—a compound annual growth rate of almost 5 percent.
Beyond output and sales, the U.S. semiconductor industry has been a global leader in capital spending (capex) and R&D. The SIA notes that total R&D and capex by U.S. semiconductor firms, including “fabless” companies that specialize in R&D but outsource actual chip manufacturing, was $71.7 billion in 2019, growing steadily between 1999 and 2019 at a 6.2 percent annual rate. R&D expenditures hit $39.8 billion last year, constituting 16.4 percent of the industry’s total sales last year—an “R&D intensity” second only to pharmaceuticals in the United States and the highest of any semiconductor industry in the world. Capex has been similarly world-class: SIA reports that 2018 capital expenditures reached “an all-time high of $32.7 billion” and constituted 12.5 percent of sales in 2019, with only South Korea having a larger global share of semiconductor capex that year.
Other data corroborate these findings. (See Table 6.) According to the U.S. National Science Board’s 2020 report on R&D trends, U.S. computer and electronic (including semiconductor) companies spent more on R&D in 2016 (the last year available) than any other country surveyed—often many times more—with only South Korea’s sector having a greater share of total or manufacturing R&D than the United States.41
The BEA further calculates that foreign multinational corporations in 2017 spent $7.3 billion and $2.2 billion on R&D and capex, respectively, for their U.S. affiliates in the “semiconductors and other electronic components” sector, up from $4.4 billion and $1.9 billion in 2007.42 U.S. semiconductor companies’ stock prices also have climbed steadily over the past decade.43
As a result of this investment, the SIA notes that in 2019 the United States remained at or near the “leading edge” of current semiconductor technology. Although U.S.-based Intel announced delays to its 7 nm chip production (reportedly competitive with the 5 nm chips from Taiwan’s TSMC), Intel also remained financially healthy as of July 2020: “Even with $15 billion projected for capital expenditures this year, on a non-GAAP basis, Intel is looking at free cash flow of $17.5 billion.“44
In short, the U.S. semiconductor industry is profitable and expanding—in many ways still globally dominant—and is investing billions of its own dollars to stay that way. None of this indicates a significant long-term “national security” threat—particularly not one that could be solved via subsidies for commercial fab construction (which takes years to complete).
Medical Goods (Non-Pharmaceutical). The U.S. medical goods industry is also large and productive.45 For example, a 2020 study from the St. Louis Federal Reserve of “essential medical equipment” (hand sanitizer, masks, personal protective equipment, ventilators, etc.) found that American producers supplied the vast majority (more than 70 percent) of these products in 2018.46 The World Trade Organization (WTO) further notes that the United States not only is a top global producer and importer of medical goods but also is a top exporter (second overall, right behind Germany).47
Data from the BEA on domestic production of medical equipment and supplies also show a healthy industry with expanding real output and value-added between 1997 and 2018. This includes the broader “medical equipment and supplies manufacturing” industry, which had $102 billion in gross output and $62 billion in value-added in 2018, and the two most important subcategories, “surgical and medical instrument manufacturing” ($45.9 billion) and “surgical appliance and supplies manufacturing” ($37.4 billion). Indeed, real output in the latter category—which contains ventilators, masks, and many other “essential” medical goods—increased by almost 90 percent over the period examined.48 Other categories, such as “analytical laboratory instrument manufacturing” (121.8 percent), “irradiation apparatus manufacturing” (468.0 percent), and “electromedical and electrotherapeutic apparatus manufacturing” (418.1 percent) also experienced substantial gains in real output.
The only domestic medical goods industry that has contracted is basic personal protective equipment (i.e., textiles, apparel, or paper products), but even there, the concern is overblown. For example, BEA data show that the domestic textile industry in 2018 generated approximately $54 billion and $17.6 billion in real gross output and value-added, respectively—significant increases (4.7 percent and 5.4 percent) since the end of the Great Recession. Also, the apparel and sanitary paper industries produced more than $10 billion in output in 2018. Many of these companies shifted operations to produce high-demand personal protective equipment (PPE) during the pandemic—another example of the U.S. manufacturing sector’s flexibility.49 Finally, foreign producers and domestic stockpiles can fill in remaining gaps in PPE supply, as they have done throughout the pandemic. These facts belie the need for costly new government policies to subsidize or protect new and inefficient PPE capacity in the United States.
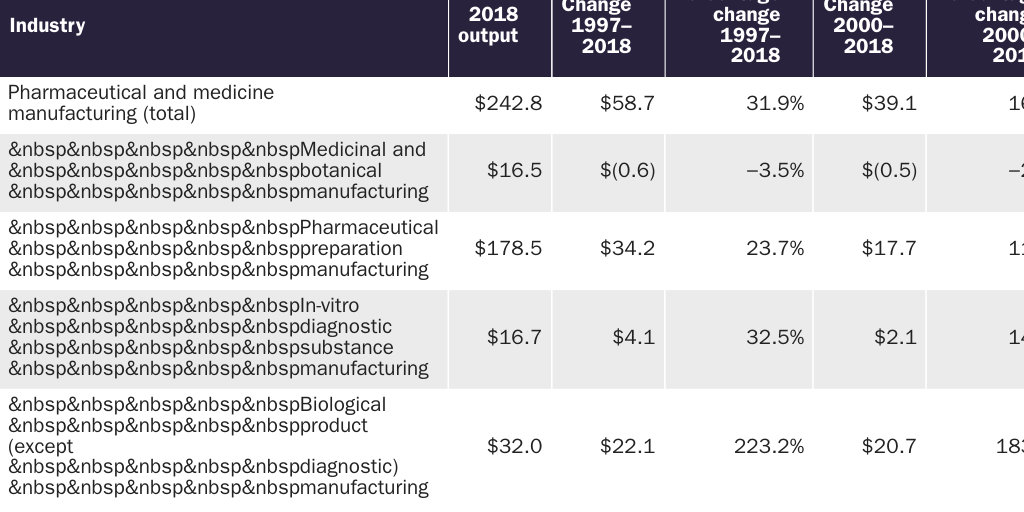
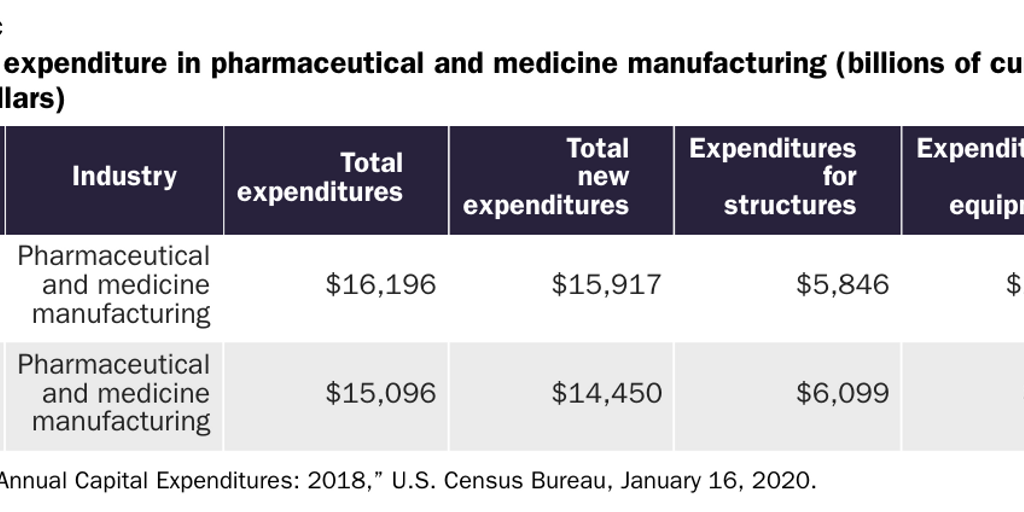
Pharmaceuticals. As shown in Tables 7a, 7b, and 7c, U.S. government data on output, R&D, and capital expenditures show that American pharmaceutical manufacturers have performed well in recent years.
A 2020 report from the McKinsey Global Institute notes that the United States is home to more than 500 pharmaceutical manufacturing facilities—among the highest concentrations in the world.50 The WTO adds that the United States is both a major importer and exporter of pharmaceutical products, having shipped almost $41 billion in medicines (35 percent of total U.S. medical goods exports) in 2019.51
With respect to pharmaceutical inputs (i.e., active pharmaceutical ingredients, or APIs), available public data on domestic and global API production do not indicate a need for urgent government funding (such as that proposed for Eastman Kodak Company). According to the Food and Drug Administration (FDA), of the roughly 2,000 global API manufacturing facilities, 13 percent are in China; 28 percent are in the United States; 26 percent are in the EU; and 18 percent are in India. For the APIs of World Health Organization “essential medicines” on the U.S. market, 21 percent of manufacturing facilities are located in the United States; 15 percent are in China; and the rest are in the EU, India, and Canada.52 The FDA further notes that the United States was home to 510 API facilities in 2019, 221 of which supply the aforementioned “essential medicines.“53
The “Defense Industrial Base” Already Enjoys Targeted Policy Support
“Security nationalism” also assumes a need for broad and novel U.S. government interventions while ignoring the current, targeted federal policies intended to support the defense industrial base. As documented in the Appendix, this includes policies intended to diversify potential sources of essential supplies beyond U.S. borders; to subsidize, procure, and stockpile domestically produced items deemed essential for national defense; or to protect domestic companies from import competition.
These laws, central to past DOD recommendations and actions to support the U.S. defense industrial base, are summarized as follows:
- International policies intended to support the defense industrial base: the “National Technology and Industrial Base” (NTIB), which includes Canada, the UK, and Australia and is intended to enhance national security by eliminating restrictions on trade and R&D collaboration among NTIB partner countries, thereby expanding the United States’ industrial capacity beyond U.S. borders; reciprocal defense procurement agreements between the DOD and its counterparts in 27 foreign governments, under which each country agrees to remove barriers to national security–related purchases of supplies and services of the other country;54 and “security of supply” arrangements with eight countries that “allow the DOD to request priority delivery for DOD contracts, subcontracts, or orders from companies in these countries.“55
- Domestic laws intended to support the defense industrial base on express national security grounds, including: NTIB provisions that require the DOD to assess annually the defense industrial base (published in an annual industrial capabilities report) and to work to mitigate any potential concerns; the Defense Production Act of 1950, which allows the DOD to identify priority sectors for government contracting and enter into those contracts (Title I), and to support, through purchases or loans/loan guarantees, “essential” domestic industrial base capabilities that are found to be nonexistent, at risk of loss, or insufficient to meet government needs (Title III); numerous other programs (see the Appendix) providing the DOD with the authority and funding to support other parts of the industrial base; and the National Defense Stockpile Transaction Fund and Strategic and Critical Materials Stock Piling Act of 1939, which authorize the National Defense Stockpile Manager to fund R&D projects to develop new materials for the stockpile and require the president to encourage the development and conservation of domestic sources of “strategic and critical materials” through procurement.
- Laws intended to protect U.S. manufacturers via the imposition of restrictions on foreign imports, including: Section 232 of the Trade Expansion Act of 1962, which authorizes the executive branch to take action (e.g., through tariffs or quotas) against imports found to have been “imported into the United States in such quantities or under such circumstances as to threaten to impair the national security”;56 U.S. “trade remedy” laws, which allow for the imposition of antidumping or anti-subsidy duties on imports from specific countries that are found to have injured or threatened to injure the U.S. industry making a directly competitive product; and various “Buy American” laws, which require the federal government to purchase or contract for domestically produced industrial goods.
As explained in the Appendix and the following sections, many of these policies have proven to be ineffective, unused, or even counterproductive, and several reforms are proposed. Regardless, these measures’ mere existence rebuts the current caricature of a U.S. defense industrial base ravaged by free markets and government inattention. These policies also show that the federal government, particularly the DOD, has legal tools to address discrete and legitimate weaknesses in essential supply chains (e.g., for weapons). Also, the government’s implementation of some of these laws shows the weaknesses of security nationalism in practice.
“Security Nationalism” Makes the United States Less Secure
Because economic nationalist policies weaken the U.S. economy and manufacturing sector, the government should not pursue “security nationalism” to bolster national security.
Closed Markets Make Economies Less Secure
Protectionism often undermines national security by weakening a country’s economy and manufacturing sector, thus making it less resilient in the face of war or other shocks. Restrictions on international trade and investment not only reduce economic growth (and thus tax revenue) and output but also can distort the economy and divert resources from sectors (e.g., high-tech, high-productivity industries such as information technology) that are also essential to national security.
Decades of research bear this out. For example, International Monetary Fund (IMF) economists in 2018 examined data for 151 countries over 51 years (1963–2014) and found that “tariff increases lead, in the medium term, to economically and statistically significant declines in domestic output and productivity” as well as more unemployment and higher inequality.57 Numerous analyses of U.S. protectionism reveal that these policies impose economic harms that far outweigh possible short-term benefits, fail to protect American firms and workers over the longer term, and breed political dysfunction.58
Furthermore, protectionism’s harms are typically amplified for the U.S. manufacturing sector—the target of current security nationalist demands. The IMF paper, for example, found that increased tariffs on manufacturing inputs (e.g., steel) resulted in a statistically significant decline in manufacturing sector-wide output (6.4 percent) and productivity (3.9 percent) five years after the tariff hikes in question. These findings are particularly relevant for the United States, given the diversity and complexity of the domestic manufacturing sector; the consistently high percentage of manufacturing inputs as a share of total imports; the concentration of “trade remedy” (antidumping, countervailing duty, safeguard) duties on manufacturing inputs; and relatively new “national security” tariffs on almost all primary steel and aluminum imports into the United States.
Other papers have confirmed these harms. For example, a 2020 paper from Alessandro Barattieri and Matteo Cacciatore found that U.S. “trade remedy” duties were concentrated in a few upstream industries (base metals and metal products, chemicals, plastics, and rubber products) and therefore resulted in substantial employment losses for downstream manufacturing industries, along with modest and short-lived employment gains in the industries that won protection. The authors further determined that these downstream industries suffered because they lost competitiveness (and therefore jobs) after raising prices to cover higher input costs.59 Examinations of President Trump’s “national security” tariffs on steel and aluminum found that the measures’ costs were mostly borne by domestic manufacturers that consume these metals—including in industries most closely associated with national security (e.g., transportation and weapons)—and resulted in foreign retaliation against U.S. goods exports. As a result, the import protection harmed these firms in terms of increased costs and reduced output, jobs, exports, and investment.60
Finally, extensive literature ties trade openness to improved economic performance more broadly. A 2018 paper from Robert Feenstra summarized the studies on the long-run, overall gains from trade for the United States, calculating total average GDP gains of 1.1 percent per year due to increased product variety arising from imports, the productivity-enhancing effects of trade-induced creative destruction, and pro-competitive effects on domestic prices.61 A 2017 Peterson Institute for International Economics paper calculated the payoff to the United States from expanded trade between 1950 and 2016 to be $2.1 trillion, increasing U.S. GDP per capita and per household by $7,000 and $18,000, respectively.62 The U.S. International Trade Commission (ITC) found in 2016 that U.S. trade agreements produced small but significant gains in U.S. exports, real GDP, employment, and wages and saved American consumers $13.4 billion in 2014.63 Several other papers have found similar gains.64
Overall, the evidence and analysis refute current arguments that economic nationalism would bolster the U.S. defense industrial base (and thus national security). Instead, American protectionism has been repeatedly found to weaken the U.S. manufacturing sector and the economy more broadly.
“Security Nationalism” Fails in Practice
Regardless of the theory supporting “security nationalism,” the United States’ implementation of these policies—for steel, ships, machine tools, semiconductors, and other “essential” goods—reveals a long track record of costs, risks, failed objectives, and unintended consequences. This checkered history must be considered when evaluating new proposals to support certain industries on national security grounds.
Section 232 Tariffs on Steel. President Trump’s tariffs on steel imports under Section 232 is a powerful example of the perils of American security nationalism. Prior to the tariffs’ imposition, the U.S. steel industry had already won billions of dollars in government subsidies and import protection through dozens of U.S. trade remedy measures covering almost 61 percent of all steel product imports in 2017, the year before the Section 232 tariffs took effect.65 Public data for that same year also showed that the industry was at no risk of collapse: according to the Commerce Department’s Section 232 report, for example, annual U.S. steel output (around 80 million metric tons) and production capacity (around 115 million metric tons) were steady between 1998 and 2016, and the domestic industry’s U.S. market share remained dominant at around 70 percent between 2011 and 2016.66 Furthermore, in the months leading up to the Section 232 investigation, domestic crude steel output and shipments of steel mill products also remained stable;67 five of the six largest domestic steelmakers were profitable, posting a combined net income of $491 million in the first quarter of 2017; and Standard and Poor’s credit ratings showed eight major U.S. producers to be financially viable.68 This was not an industry in crisis.
Nor did imports pose an immediate threat to the United States’ ability to procure steel (and aluminum) for national defense needs, as judged by the same standards that the Commerce Department applied in a 2001 Section 232 investigation that concluded that imports of iron and steel did not pose a national security threat.69 As previously noted, imports constituted less than one-third of all domestic steel consumption, and the majority of those steel imports came from “reliable” (in Commerce Department parlance) U.S. allies, such as Canada (the largest source country), Brazil (2), South Korea (3), Mexico (4), Japan (7), and various EU countries, including Germany (8), the Netherlands (13), Italy (14), Spain (16), and the UK (17). As the Commerce Department noted in 2001, none of these countries—most of which were U.S. treaty, free trade agreement, and/or defense procurement agreement partners and home to companies with major U.S. investments—would realistically deny the United States steel in a time of war or other emergency:
The Department found that iron ore and semi-finished steel are imported from reliable foreign sources. Accordingly, even if the United States were dependent on imports of iron ore and semi-finished steel, imports would not threaten to impair national security.…
Imports of iron ore and semi-finished steel come from diverse and reliable trading partners. More than a dozen countries exported iron ore to the United States in 2000; many of these countries are in the Western Hemisphere. Over the past ten years, Canada—with which the United States shares a 3,987-mile border—has been the source of more than 50 percent of U.S. iron ore imports. Canada is a North Atlantic Treaty Organization (“NATO”) ally, the United States’ largest trading partner, and also a party to NAFTA.70
Meanwhile, China—the repeated excuse for the Section 232 tariffs—was only the 11th largest U.S. supplier of steel in 2017, suffering a 31 percent drop since 2011 (due in part to the dozens of U.S. trade remedy measures).71
The absence of a national security threat in 2017 was established in a statutorily required assessment from then-Secretary of Defense James Mattis that agreed with the Commerce Department that the “systematic use of unfair trade practices … poses a risk to our national security” but explained that because “the U.S. military requirements for steel and aluminum each only represent about three percent of U.S. production … DoD does not believe that the findings in the [Commerce Section 232] reports impact the ability of DoD programs to acquire the steel … necessary to meet national defense requirements.” For this reason, Mattis recommended only “targeted tariffs” focused on “correcting Chinese overproduction and countering their attempts to circumvent existing antidumping tariffs” instead of “a global quota or global tariff,” as well as a dialogue with “key allies” to emphasize the United States’ commitment to these countries’ “bilateral U.S. relationship.“72
Mattis’ recommendations—as well as the Commerce Department’s findings and standards in the 2001 Section 232 investigation—were ignored. Instead, President Trump, surrounded by U.S. steel company chief executive officers and union leaders at a March 2018 White House press event, announced blanket 25 percent tariffs—inexplicably 1 percentage point higher than what the Commerce Department recommended—on all types of steel.73 This included commodity products (e.g., rebar) with little national security nexus and semifinished products (e.g., slab) that American steel companies needed to maintain their domestic operations. It also included steel from close U.S. allies such as Canada, Japan, and the EU (including the UK).74
Numerous studies have documented the tariffs’ high economic costs for U.S. consumers (particularly manufacturing firms). In particular, the tariffs caused higher steel prices that in turn hurt other U.S. manufacturers in terms of higher input costs, lower exports, and lost competitiveness at home and abroad; created an opaque, costly, and uncertain “exclusion” bureaucracy, under which more than 100,000 requests have been filed by U.S. manufacturers seeking relief; resulted in approximately 75,000 fewer manufacturing jobs than would have otherwise existed in the absence of the tariffs; depressed global demand for steel (thereby dampening prices); bred global market uncertainty, which hurt investment in manufacturing; and caused numerous U.S. trading partners to retaliate against American exporters.75
At the same time, the steel tariffs were found to have a minimal impact on U.S. steelworker jobs and to do nothing to address global steel overcapacity—the primary long-term driver of the U.S. steel industry’s weakened financial position in 2018.76 Given these and other market dynamics (e.g., steelmakers bringing back inefficient capacity to capture rents and subsequently flooding the U.S. market), industry stocks tanked in late 2018 and early 2019, and steel companies were actually laying off workers and curtailing investments by the end of 2019.77 In extending the tariffs to downstream “derivative” products in early 2020, the Trump administration tacitly admitted that the steel tariffs had not achieved their primary goal of increasing and stabilizing the industry’s capacity utilization.78 As one Los Angeles Times story put it, “Trump’s steel tariffs were supposed to save the industry. They made things worse.“79
Finally, the president’s baseless invocation of “national security” in this (and other) Section 232 cases has likely harmed U.S. national security in other important ways, including by antagonizing allies and thereby undermining U.S. credibility and complicating efforts to build international coalitions on other, more legitimate security threats (e.g., China); eroding the rule of law in the United States via the clear abuse of constitutional trade powers delegated to the executive branch by Congress; and undermining U.S. leadership at the WTO by exploiting the body’s rarely invoked exceptions for the protection of “essential security interests.”
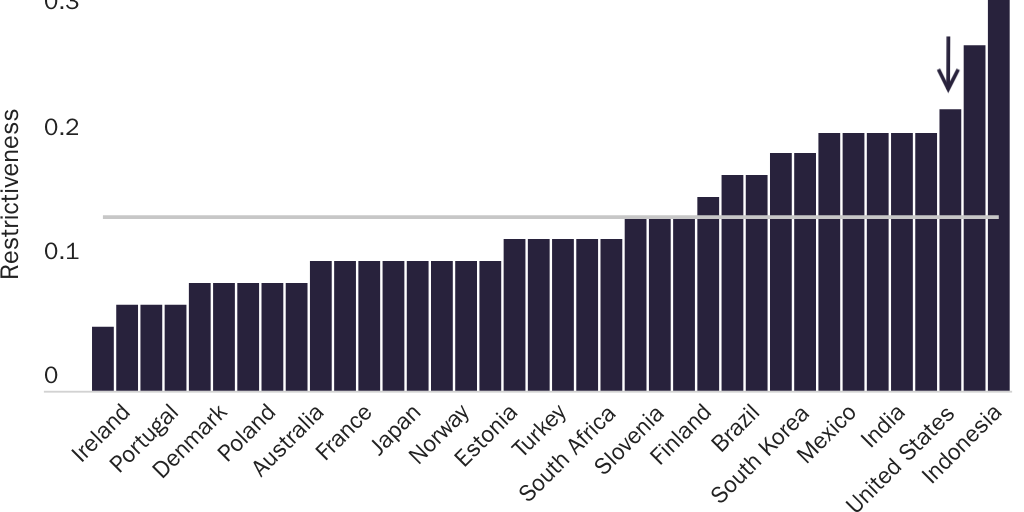
The Jones Act. The Merchant Marine Act of 1920 was presented as a plan to ensure adequate domestic shipbuilding capacity and a ready supply of merchant mariners in times of war or other national emergencies. Section 27 of the law—the “Jones Act”—purportedly supports those objectives by restricting domestic shipping services to vessels that are U.S.-built, U.S.-owned, U.S.-flagged, and U.S.-staffed. As a result, the United States has one of the most (if not the most80) restrictive shipping systems in the world, as shown in Figure 13.
A century of evidence—summarized in a 2018 Cato Institute policy analysis81—reveals that the Jones Act has failed in its main national security objectives while imposing substantial economic costs. First, Jones Act restrictions inflated U.S. shipping costs because the transport of cargo between U.S. ports and on inland waterways is off-limits to foreign competition. Higher shipping rates for waterborne transportation reduced demand for shipping services, thereby leading U.S. companies to purchase fewer vessels. Producers, in turn, build fewer ships, thus retarding both output (ships) and production facilities (shipyards).
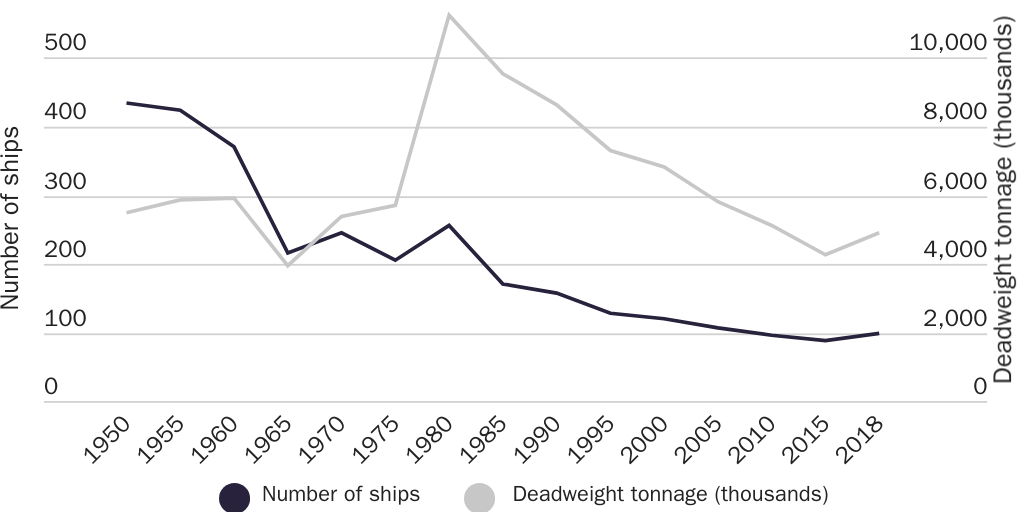
The trends shown in Figure 14 are especially bleak for oceangoing vessels (i.e., the ships that the U.S. military would need in wartime):
Nearly 9 of every 10 commercial vessels produced in U.S. shipyards since 2010 have been barges or tugboats. Among oceangoing ships of at least 1,000 gross tons that transport cargo and meet Jones Act requirements, their numbers have declined from 193 to 99 since 2000, and only 78 of those 99 can be deemed militarily useful. Even in their expressions of support for the Jones Act, government officials concede that the U.S. shipping industry and its associated ecosystem have been depleted.82
The Jones Act fleet is not only shrinking but also increasingly decrepit because of artificially high replacement costs. Of the mere 98 ships in service, more than a third (34.7 percent) are past the age of 20, and a quarter of them (24.5 percent) are past 30. Studies also show that these old vessels are not only inefficient but dangerous.
With fewer (and older) ships, fewer shipyards, and fewer workers in the industry, the Jones Act has undoubtedly failed to achieve its national security objectives—a conclusion evident by the fact that the U.S. military during the Gulf War and thereafter rarely turned to the Jones Act fleet (and overwhelmingly relied on foreign-built ships) to meet its sealift needs.83
Second, higher shipping costs caused by the Jones Act increase demand for alternative forms of transportation, including trucking, rail, and pipeline services, raising those modes’ rates and inflating business costs throughout the supply chain—thus affecting the operations and finances of nearly every business in nearly every U.S. industry, especially manufacturing. The Jones Act therefore disadvantages U.S. companies relative to their foreign competitors and consumes funds that U.S. households could spend or invest elsewhere in the economy (on more productive ventures). Indeed, some of those competitors, such as Russian gas producers that service Northeastern U.S. communities due to the artificially high cost of shipping liquified natural gas from Texas and Louisiana, are in hostile territories—another unintended consequence that undermines national security.
At the same time, heightened use of trucks and freight trains increases infrastructure and maintenance costs, as well as environmental costs (surface transportation emits more carbon than ships). It also raises safety issues (e.g., transporting toxic materials on U.S. highways) and increases traffic congestion—especially on highways running parallel to U.S. sea lanes—thereby generating opportunity costs from lost wages and lost output for American commuters. Finally, the Jones Act has been a persistent irritant to important U.S. trade partners, thus discouraging U.S. exports in those markets. These economic harms further undermine, rather than support, U.S. national security.
Machine Tool “Voluntary” Restraint Agreements, Subsidies, and Buy American Restrictions. Following a 1983 petition from the domestic machine tool industry under Section 232 and an affirmative “national security” determination by the Commerce Department in 1984, the Reagan administration concluded in 1986 five-year “voluntary restraint agreements” (VRAs) with Japan and Taiwan to limit their exports of certain machine tools and requested that nine other countries limit their U.S. machine tool market shares to certain levels. The federal government—led by the Commerce Department and the DOD—simultaneously implemented a “Domestic Action Plan” to “assist, encourage, and fund a variety of research and development activities to help modernize machine tool and manufacturing technology.“84 This included the creation of the National Center for Manufacturing Sciences (NCMS), a public-private consortium intended to “revitalize” the machine tool industry. Finally, Congress in 1986 and 1988 imposed Buy American restrictions on the DOD’s procurement of foreign-made machine tools.85 The VRAs were modified in 1991 and extended through December 1993, when they expired. The NCMS still exists, though it has been expanded to cover all manufacturing operations in North America (as opposed to just U.S. machine tools producers).
These trade restrictions and subsidies proved unsuccessful. First, the VRAs cost U.S. machine tool consumers (i.e., other U.S. manufacturers) hundreds of millions of dollars per year but provided much smaller benefits to U.S. producers, resulting in an estimated annual net loss of $647,892 (in 2017 dollars) per job protected.86 Among the measures’ victims was one of the United States’ largest machine tool producers, Hurco, which sourced certain hardware from Taiwan and survived because it won an exemption from the government through 1990.87 The trade measures also failed to reverse import growth (which expanded by 2.51 percent per year between 1986 and 1990) or domestic job losses (which declined by 2.09 percent per year), while delivering substantial “quota rents” to foreign producers.88 Import growth was attributable to the exemptions, lax government enforcement, and the growth of unconstrained foreign suppliers—most notably Austria and China.89
Second, neither the trade restrictions nor the subsidies revitalized the domestic industry. A 1990 Government Accountability Office report found, for example, that American companies had thus far failed to meet the Reagan administration’s domestic market share targets in four of the six machine tool categories at issue.90 The ITC in 1993 found that domestic machine tools shipments actually declined by 11.7 percent between 1989 and 1991, while employment dropped by 9.8 percent.91 According to a 1995 article for the Philadelphia Inquirer, after years of subsidies and import protection, the U.S. machine tool industry still remained a “distant third” in global production—essentially tied with Italy but well behind both Germany and Japan; had only half the volume of sales (measured in constant dollars) in 1995 that it had 30 years earlier; and saw its workforce shrink from 108,000 in 1980 to 58,300 in 1995 (as well as experience stagnant wages).92
Finally, the programs were plagued with dysfunction. The Government Accountability Office report found that the Commerce Department’s methods for monitoring quota compliance and related import volumes suffered from a lack of documented procedures and data, inaccurate calculation methodologies, and reporting delays of five months or more. It also found problems with compliance and enforcement. Moreover, U.S. restrictions on supplies from major foreign producers likely fueled the growth of new market entrants, including China, which has since become a global leader.
In 1993, the George H. W. Bush administration quietly allowed the machine tools VRAs to fade away.93 Furthermore, neither the Buy American restrictions nor the NCMS’s continued operation ever revitalized the domestic machine tools industry, which remains a DOD concern.
Semiconductor Tariffs and Subsidies. National security also undergirded U.S. support for the semiconductor industry in the 1980s and ’90s, but it also proved costly and unsuccessful.94 Government support was primarily implemented through two measures: the 1986 Semiconductor Trade Agreement (STA) between the United States and Japan and contemporaneous subsidies to support domestic semiconductor research and production. Each measure, however, generated meager benefits for specific U.S. firms while imposing substantial and unforeseen economic costs, leaving long-term national security objectives unmet or even undermined.
The STA. Under the STA, the Japanese government agreed to stop its producers from “dumping” dynamic random-access memory (DRAM) and erasable programmable read-only memory chips—enforced through production limits and export restraints that kept prices above U.S.-determined levels—and to guarantee foreign producers 20 percent of the Japanese market. In exchange, the United States suspended ongoing antidumping and Section 301 (a U.S. law intended to police foreign trading practices that allegedly harm U.S. commerce) investigations of Japanese memory chips.95
The STA’s economic harms were significant. A 1994 Peterson Institute analysis found that in 1989, the STA generated a net national welfare loss of $974 million ($2.04 billion in 2020 dollars) and cost U.S. consumers over $525,000 ($1.10 million in 2020 dollars) per manufacturing job potentially saved. After the STA took effect, domestic semiconductor prices “skyrocketed,” and a “full-fledged shortage of DRAMs was widely felt in the United States and Europe by early 1998.“96 As a result, U.S. semiconductor users, particularly up-and-coming computer manufacturers such as Apple that were dependent on DRAMs, were hobbled and less able to compete with Asian and European producers that could obtain cheaper DRAMs.97 As a result, the computer manufacturing industry shed one job for every U.S. semiconductor job supposedly gained from the STA.98 Increased DRAM prices also added almost $100 to the price of a personal computer selling for $600 or $700 in 1988.99
The STA also ended up helping Japanese semiconductor producers more than their U.S. competitors because the STA allowed the Japanese to charge higher prices in the United States and elsewhere. According to one Brookings Institution study, Japan’s manufacturers earned $1.2 billion in extra DRAM profits in 1988 alone and another $3–4 billion on all products in 1989—most of which was paid by U.S. consumers and computer manufacturers.100 Other studies found similar gains for Japanese producers, in part due to collusive behavior.101
U.S. producers, on the other hand, did not increase production capacity, despite artificially high domestic prices and U.S. government subsidies.102 All but one U.S. chip maker left the DRAM market within a decade, and the STA prevented neither industry recessions nor declining U.S. market share (which shrunk from 83 percent to 70 percent between 1986 and 1992).103 One reason is that U.S. firms found ways to circumvent the STA by importing not individual chips but rather assembled circuit boards that weren’t subject to the agreement.104 The benefits of the Japanese market share targets also proved illusory: although foreign semiconductor exports to Japan in 1992 hit the STA’s 20 percent market share targets, economist Craig Parsons found that this “achievement” was caused by broader macroeconomic trends, not the agreement itself.105 Other reports at the time noted that Japanese firms dumped the semiconductors that they were forced to buy into Tokyo Bay.106 Overall, “there is little consensus on whether the STA was effective in increasing the foreign market share.“107
As a result, “for most U.S. chip makers, the main impact of the price hikes was vastly greater profits strengthening their Japanese competitors.“108 Longer term, the STA actually helped “accelerate the entrance of Korean companies onto the world DRAM scene—as with Japanese companies, the supernormal profits that were obtainable in the years immediately after the [STA] allowed Korean firms such as Hyundai, Samsung, and LG to reap unexpected returns and gain a foothold at the lower end of the semiconductor technology ladder.“109 They are now market leaders.
Finally, the STA had significant political ramifications in the United States and abroad. It encouraged collusion among Japanese producers and restored the Japanese government’s control over the sector, with U.S. help. It led to the creation of a new and powerful lobbying group in the United States—composed of injured downstream user industries—that would go on to mold U.S. trade policy for decades.110 And it demonstrated the folly of U.S. security nationalism: just as the DOD was recommending action, American companies were exiting the DRAM market, having already discerned that their future was not in the “high-volume, low-profit commodity” but in advanced microprocessors, specialty chips, and design.111 As a result, U.S. Memories, a private consortium to expand domestic DRAM production, was “stillborn and collapsed in January 1990 owing to insufficient financial support and an unwillingness of other major buyers … to commit to future purchases.“112 Government planners foresaw none of this.
Sematech. Sematech (short for “semiconductor manufacturing technology”) was not a DRAMs project but instead a semiconductor R&D consortium funded jointly by private industry and the federal government—very similar to the consortium now proposed in the NDAA. As chronicled by Brink Lindsey in a 1992 piece for Reason, the primary impetus for Sematech was national security: only a month before the entity’s formation, a Pentagon-sponsored study on “defense semiconductor dependency”—prepared by the Defense Science Board, whose advisory panel conveniently included Sematech member companies—concluded that “it is simply no longer possible for individual U.S. semiconductor firms to compete independently against world-class combinations of foreign industrial, governmental and academic institutions.” The DOD therefore recommended $1 billion in government funding for a “Semiconductor Manufacturing Technology Institute.” Congress authorized $100 million a year for five years via the Defense Advanced Research Projects Agency.113
Lindsey showed how Sematech “confirm[ed] all the darkest suspicions of industrial-policy critics.” In its first phase, “Sematech was able to borrow technology from private companies and reproduce manufacturing results that other private companies had achieved years before—and do it with taxpayers’ money”; and in its second phase, Sematech did some “useful work, both in evaluating new equipment and improving working relations between chipmakers and suppliers”—but it was work that, while it may have helped a few favored U.S. equipment suppliers, added “very little to what private industry is already capable of doing for itself.“114
Meanwhile, U.S. semiconductor firms were staging a major turnaround but did so by “ignor[ing] just about everything Sematech’s supporters have ever said about semiconductor competitiveness.” Instead, “American companies have been thriving in those supposedly marginal ‘specialty’ markets derided by the Defense Science Board.” Even worse, Lindsey explained how Sematech actually hindered the industry’s revitalization by “favoring older, more-established companies [i.e., Sematech’s member companies] over innovative newcomers.” He finally debunked Sematech’s national security basis, noting that the U.S. military had ample domestic and foreign supplies of both commodity DRAMs and the chips most essential to U.S. weapons systems.115
Subsequent studies have confirmed Lindsey’s contemporaneous reporting. In a 1996 paper, for example, Douglas A. Irwin and Peter J. Klenow concluded that the “U.S. government’s contributions to Sematech do not induce more semiconductor research than would otherwise occur.“116 Even Sematech proponents Kenneth Flamm and Qifei Wang concluded that the consortium’s impact on member companies’ R&D expenditures was inconclusive and could in fact have been negative on net.117 That is hardly a ringing endorsement, given Lindsey’s account of other, noneconomic harms. In 2020, the Carnegie Endowment’s James L. Schoff included Sematech among the cautionary tales of American “technonationalism” in the 1980s:
The U.S. and Japanese bureaucrats promoting industrial policy and technonationalism at that time could not foresee the growth of the internet and how it would evolve in tandem with the smartphone and other new digital technologies. They could not conceive of AI-enabled cyber hacks of cloud-based data centers or stimulate the rise of internet titans like Google, Amazon, or the modern version of Apple. These companies flourished in the technoglobalist era and avoided single-firm product models by incorporating the best components of various leading technologies into their own product lines. Now these firms possess some of the world’s most coveted technology, investing more than most governments do to push new boundaries and accelerate change through design and systems integration.
Another lesson is that governments generally overreact to perceived technonationalist threats. Many U.S. policymakers and scholars during the 1980s viewed competition with Japan over technology as a form of economic warfare and regularly assumed the worst about the Japanese government’s intentions. American fears that Japan would come to dominate technological fields like semiconductors, supercomputers, satellites, and aerospace in the same way they pushed U.S. manufacturers out of the production of radios and televisions simply never happened, and U.S. initiatives such as SEMATECH or Super 301 trade dispute cases had only a marginal effect. After all, Japanese firms became members of SEMATECH within ten years, and many market-opening Super 301 cases against Japan involved products (like dynamic random access memory chips) that were soon overtaken by new technology or—in the case of satellites—were eventually subject to U.S. export controls. U.S. firms prospered because of their ability to innovate and compete effectively, not because of such technonationalist or protectionist measures.118
Given the NDAA’s plans to subsidize the U.S. semiconductor industry and to establish another R&D consortium, it appears that U.S. policymakers have not learned these lessons.
Other “Security Nationalist” Failures
These four case studies are a representative sample of the U.S. government’s long-standing inability to achieve national security objectives through protectionism and industrial policy, as well as the frequent abuse of “national security” for political purposes. Other examples of security nationalist failures include: Trump administration Section 232 tariffs on aluminum and Section 301 tariffs on Chinese imports;119 previous episodes of steel protectionism, including President Bush’s broad “safeguard” measures in 2001;120 the Sugar Program;121 crude oil import quotas from the 1950s to early 1970s;122 textiles and apparel protection;123 wool/mohair subsidies;124 Japanese automobile quotas; and antidumping duties on supercomputers and flat panel displays (which also received generous U.S. government R&D subsidies).125 In each case, along with many others, the outcome was essentially the same: high economic costs, the continued demise of the favored industry, political dysfunction, and U.S. government advocates who, as the American Enterprise Institute’s Claude Barfield explained in his book High Tech Protectionism, “either never understood or willfully ignored the structure of the industry and the nature of worldwide competition in the sector.“126
In short, any past successes of U.S. security nationalism are the exception, not the rule.
Free Markets Enhance U.S. National Security and “Resilience”
Freer markets—including openness to international trade and investment—can bolster national security and enhance the country’s resilience to economic “shocks,” such as a pandemic. The relationship between trade and national security has played a central role in U.S. economic and foreign policy since Secretary of State Cordell Hull helped create the World Trade Organization’s predecessor, the General Agreement on Tariffs and Trade, in the late 1940s and usher in the modern era of globalization.127 Since that time, numerous academic studies have supported Hull’s instincts, in terms of both geopolitics and economics, that trade and economic interdependence can prevent armed conflict and make countries more resilient to shocks.
Open Markets Help Achieve Geopolitical Objectives
A wide body of research across a range of countries and time periods reveals a strong, positive relationship between trade and national security.128
- One of the most influential analyses of trade and peace is that of John R. Oneal, Bruce Russett, and Michael L. Berbaum, who examined almost 10,000 country pairs between 1885 and 1992 and found that increasing two nations’ economic interdependence (as measured by bilateral trade-to-GDP ratio) from the 10th to the 90th percentile lowers the probability of a fatal dispute between them by 32 percent. They estimated that the growth in U.S.-China trade between the 1960s and 2002 reduced the probability of a fatal militarized dispute between the two nations by 27 percent, as compared with what it would have been without the increase in commercial relations (and assuming China’s authoritarianism remained unchanged). They further found that militarized disputes between nations significantly decreased their bilateral trade in the following year, thus indicating that “the relationship between trade and conflict is reciprocal.… Peace and commerce promote each other.“129
- Solomon W. Polachek and Carlos Seiglie similarly found in a 2006 study that as two countries’ gains from trade increase, their level of armed conflict decreases and their level of cooperation increases. In particular, a doubling of bilateral trade volumes leads to a 20 percent decrease in conflict.130
- In a 2016 Review of Development Economics paper, Jong-Wha Lee and Ju Hyun Pyun examined 243,225 country pairs from 1950 to 2000 and found that “an increase in bilateral trade interdependence significantly promotes peace,” with this effect strongest for contiguous countries (e.g., the United States and Canada). They also showed that peace is separately promoted by a nation’s openness to global trade and that “an increase in global trade openness reduces the probability of interstate conflict more for countries far apart from each other than it does for countries sharing borders.” Finally, they found that “states more dependent on the world economy tend to have fewer conflicts than those less dependent,” thus providing a strong “security motive” for nations’ efforts to increase other countries’ global economic integration.131
- Patrick J. McDonald in a 2004 article for the Journal of Conflict Resolution found that “free trade, and not just trade, promotes peace by removing an important foundation of domestic privilege—protective barriers to international commerce—that enhances the domestic power of societal groups likely to support war, reduces the capacity of free-trading interests to limit aggression in foreign policy, and simultaneously generates political support for the state often used to build its war machine.” Testing the link between individual countries’ trade barriers (measured in terms of both tariff levels and deviation from an ideal “free trade” state) and their propensity to engage in military conflicts, McDonald found that “the tendency of protective trade policies to increase military conflict is both statistically and substantively significant” and that “the level of free trade exerts a larger effect than aggregate trade flows on the outbreak of peace” between countries. He concluded that “these results strongly support the claim that free trade enhances the prospects for peace.“132
- Matthew O. Jackson and Stephen Nei in a 2015 paper examining alliances and interstate wars found that international trade induces peaceful and stable alliances: “Trade increases the density of alliances so that countries are less vulnerable to attack and also reduces countries’ incentives to attack an ally.” Examining detailed historical data on wars and trade, they showed that “the dramatic drop in interstate wars since 1950 is paralleled by a densification and stabilization of trading relationships and alliances”; that “countries with high levels of trade with their allies are less likely to be involved in wars with any other countries (including allies and nonallies)”; and that “an increase in trade between two countries correlates with a lower chance that they will go to war with each other.” They found that a country having more allies and more trade with those allies leads the country to be less prone to attack and less prone to being attacked. Importantly, they also noted that “in the absence of international trade, no network of alliances is peaceful and stable”—thus indicating the centrality of trade to peace, especially after 1950.133
- A 2020 analysis of 140 countries from 1970–2012, by Benny Kleinman, Ernest Liu, and Stephen J. Redding, found that as countries become greater economic “friends” (as measured by welfare exposure/gains due to the other countries’ productivity growth), they become greater political “friends” in terms of having more similar United Nations voting records, being less likely to be strategic rivals (i.e., “whether two countries regard each other as competitors, a source of actual or latent threats that pose some possibility of becoming militarized, or enemies”) and being closer to the “U.S.-led liberal order.” They concluded that these results, taken together, “are consistent with the view that increased conflict of economic interests between countries leads to heightened political tension between them.“134
- Finally, in a 2012 issue of the British Journal of Political Science, Timothy Peterson and Cameron Thies found that the post-World War II decline in armed conflict is driven by an “unprecedented” increase in intra-industry trade (i.e., trade in similar—in many cases, branded—commodities, caused by economies of scale and consumer demands for variety) during this period.135
In sum, armed conflicts decrease as nations’ economic interdependence and trade openness increase, and a country should seek to encourage other countries’ global economic integration to discourage future attacks on that country. These national security benefits are driven by several factors: First, by making countries more commercially interdependent, trade encourages these nations to avoid war or other large-scale armed conflicts (which could impose substantial economic losses). Second, trade and commercial bargaining are more cost-effective than war as a means of resolving disputes with, or obtaining resources from, another country. Third, trade increases material prosperity (e.g., goods, services, investment, ideas) and promotes mutual tolerance and understanding.136 And fourth, free trade can limit the political power of domestic constituencies that may benefit from increased conflict.
Regardless of the reason, the outcome is clear: while global economic integration cannot eliminate armed conflicts, trade liberalizing policies make peace among nations more likely (and thus enhance national security) than the nationalist alternative.
“Open” Nations Can Still Be “Resilient”
Finally, there is little to indicate that trade and investment openness has made the United States less economically resilient and thereby increased national security risk. Indeed, openness in many cases can decrease a country’s vulnerability to demand or supply shocks, or it can help the economy recover thereafter.
Just How “Open” Are We? That being said, the United States is not nearly as open or “dependent” on imports and global supply chains as claimed. Regarding openness, the United States has low “most favored nation” tariffs on goods generally, for example, but maintains high tariffs on dozens of politically sensitive goods and is one of the world’s most frequent users of nontariff barriers (e.g., trade remedies) on goods, services, and investment.137
Nor is the U.S. economy especially reliant on imported goods: according to a 2019 analysis from the Federal Reserve Bank of San Francisco, imports account for only about 11 percent of U.S. consumer spending—a share that has remained “nearly unchanged” in the past 15 years. Thus, “despite how individual shopping experiences may appear, the majority of U.S. personal consumption expenditures are on domestically produced goods and services.“138
In fact, the United States is one of the least trade-dependent countries in the world. According to the World Bank, for example, the United States in 2019 ranked second-to-last among surveyed countries in terms of trade (imports and exports of goods and services) as a share of national GDP—26 percent, right below Cuba (27 percent) and also well below major manufacturers such as China (36 percent), Japan (37 percent), South Korea (77 percent), and Germany (88 percent), as well as the world average (60 percent).139 The United States also ranked near the bottom of a similar ranking of only import shares: fifth lowest at 14.6 percent and again below China (17.3 percent), Japan (18.3 percent), South Korea (37 percent), Germany (41.1 percent), and the world average (29.8 percent).140 More complex analyses of trade dependency reveal similar results.141 In terms of manufacturing supply chains, for example, Richard Baldwin and Rebecca Freeman found that imported inputs from only five countries—Canada, China, Mexico, Germany, and South Korea—make up more than 0.5 percent of U.S. manufacturing output, tied for the lowest number among the 21 Organisation for Economic Co-operation and Development nations.142
This is not to say, of course, that the United States’ relative lack of global integration is a “good” thing or that further closing the U.S. economy would be relatively costless—in fact, the preceding sections reveal much the opposite. Nevertheless, the nation’s alleged import “dependency” and lack of protective measures are a common justification for new security nationalism—one that the data reveal to be generally groundless.
Openness and Resiliency Are Not Mutually Exclusive. More importantly, there is little to suggest that a country’s openness to foreign trade and investment undermines its economic resiliency or response to national emergencies. This conclusion makes intuitive sense—greater trade and investment openness might make an economy more vulnerable to external supply or demand shocks, but it also helps reduce a nation’s vulnerability to (and improve its recovery from) domestic shocks—and is borne out in academic research. For example, economists Francesco Caselli and others found in 2015 that, when a countrywide shock occurs, “openness to international trade can lower GDP volatility by reducing exposure to domestic shocks and allowing countries to diversify the sources of demand and supply across countries.“143 Similarly, a 2016 examination of openness and economic fragility from Aida Caldera-Sánchez and colleagues found a positive relationship between trade openness and economic vulnerability.144 Examining how certain policies (i.e., financial market liberalization, capital account openness, trade openness, exchange rate policies, and product market regulation) affect a country’s economic growth and risk of financial crisis, the authors found that “lower import tariffs … lowers crisis risk while having a favourable impact on average growth.“145
Similar conclusions apply to the COVID-19 crisis. For example, a 2020 assessment from Barthélémy Bonadio and others of the pandemic’s impact on global supply chains and national economic performance found that “renationalization” of supply chains would generally not improve a country’s economic performance after a global pandemic:
We show that the average real GDP downturn due to the Covid-19 shock is expected to be ~29.6%, with one quarter of the total due to transmission through global supply chains. However, “renationalization” of global supply chains does not in general make countries more resilient to pandemic-induced contractions in labor supply. The average GDP drop would have been ~30.2% in a world without trade in inputs and final goods. This is because eliminating reliance on foreign inputs increases reliance on the domestic inputs, which are also disrupted due to nationwide lockdowns. In fact, trade can insulate a country imposing a stringent lockdown from the pandemic-shock, as its foreign inputs are less disrupted than its domestic ones.146
The authors also examined the effect of pandemic lockdowns on individual sectors (including manufacturing industries such as textiles, chemicals and pharmaceuticals, and electrical equipment) and concluded that “there is no sector in which supply chain renationalization notably improves resilience, measured either by GDP, or by value added of the sector itself.” These results are preliminary but consistent with the research on openness and resiliency more generally. Combined, the analyses should foment caution among American policymakers seeking to improve U.S. economic resiliency and performance by renationalizing supply chains.
The research is also backed by anecdotal evidence: in his book on the economics of COVID-19, for example, Cato’s Ryan Bourne documents several instances of foreign suppliers and trade openness (e.g., East Asian clothing producers and foreign carmakers) helping the U.S. economy recover and of closed sectors (e.g., domestic meatpacking facilities or tariff-protected light truck production) doing the opposite.147
Indeed, domestic policy likely outweighs trade openness in terms of mitigating the risk of economic shocks. For example, two of the most “trade-dependent” countries noted in the previous section (Germany and South Korea) experienced COVID-19-induced
quarterly GDP contractions in the first half of 2020 that were similar to or better than the relatively “closed” Japan or United States, while other “open” economies performed less favorably over the same period.148 Germany’s initial “V‑shaped” recovery is particularly noteworthy in this regard, given the country’s level of economic development and high dependence on trade.149 Sweden, meanwhile, also has “high exposure to international value chains” but “face[d] a milder recession this year than many economies in the euro area.“150 Bourne further notes that certain foreign suppliers rebounded quickly from COVID-19, but “it was the lack of demand from importing countries that took longer to contain the virus, such as the United States and the UK, which prolonged a depression of activity in those industries.“151 These situations indicate that domestic policies, in particular countries’ ability to control the virus or keep their economies open, drove their economic performance more than trade or investment liberalization. Subsequent research supports these conclusions.152
Research also supports the general primacy of domestic policy and domestic demand over trade openness in terms of mitigating economic shocks. For example, the study from Caldera and others found that the policies with the greatest benefit in terms of both economic growth and crisis risk were those that improve the quality of domestic institutions (e.g., more effective government, greater voice and accountability, and better control of corruption). A 2016 examination from Lino Briguglio and Melchior Vella of 172 countries found that trade openness can lead to economic growth volatility but that this risk can be mitigated entirely by good governance (as measured in this case by the Rule of Law portion of the Worldwide Governance Indicators).153 A World Bank analysis of how various policies affect the ability of European economies to absorb an external shock and recover thereafter found the most significant and negative effects for both shock absorption and recovery to come from domestic policies, namely state control of production and prices; regulatory barriers to entrepreneurship; and an uncompetitive banking sector. (Trade openness effects, meanwhile, were mixed or ambiguous.)154
Market-Oriented Policies Can Support Manufacturing and National Security
Although the data belie the supposed “death” of the U.S. manufacturing sector and the defense industrial base, several market-oriented policy reforms would support national security by strengthening the U.S. economy in general and boosting the manufacturing sector’s performance in particular. Where possible, the reforms discussed in this section incorporate current U.S. laws and policies related to national security (see the Appendix) and reflect the preceding sections’ conclusions that using only domestic output to satisfy U.S. demand in times of emergency would be impractical (as even many industrial policy advocates recognize155) and counterproductive; that U.S. industrial policies targeting specific companies or industries have a woeful track record; that simply removing government restrictions on trade, investment, and consumption would better achieve core national security objectives; and that domestic policies are a critical contributor to a nation’s economic strength and resiliency.
Trade and Investment Reforms to Bolster National Security
Six policies liberalizing trade and investment would support U.S. national security by improving access to and production of essential goods:
- Unilateral liberalization of tariffs on industrial inputs. President Trump’s tariffs on global steel and aluminum imports, as well as on Chinese capital goods, have been repeatedly found to harm the U.S. manufacturing sector and antagonize allies (e.g., the EU and Canada) while providing little long-term benefit to the protected domestic industries at issue. Eliminating these measures—whether through unilateral executive action or legislation—would thus provide an immediate boost to the U.S. manufacturing sector. Longer term, Congress should reform or eliminate the U.S. laws, such as Section 232, that provide the president with vast discretion to impose tariffs on “national security” or other grounds without any congressional input or oversight—thus generating tariffs and injecting uncertainty into manufacturing supply chains. Should full repeal or line-by-line amendment of these laws prove politically untenable, Congress should consider legislation that would subject presidential trade restrictions to congressional approval, such as the Global Trade Accountability Act, which Sen. Mike Lee (R‑UT) introduced.156157 Congress should follow other jurisdictions by requiring the executive branch to consider the costs that these duties inflict on other U.S. manufacturers and to refrain from implementing them where doing so would be inconsistent with the “public interest,” including U.S. national security. Other methodological improvements might also be in order.158 Finally, Congress should expand the current provision of U.S. law prohibiting the president from restricting “the importation into the United States of any material determined to be strategic and critical” under the Stock Piling Act (with limited exceptions) to apply to any other goods that the U.S. government deems so “essential” as to be stockpiled in case of national emergency.159
- New trade and investment agreements with U.S. allies. The U.S. government should liberalize trade and investment with allies through existing legal mechanisms, including expanding the National Technology and Industrial Base (NTIB) to include allies (and innovative manufacturing nations) such as Finland, Germany, Japan, the Netherlands, South Korea, Singapore, Switzerland, and Sweden; fully implementing the NTIB and further liberalizing trade, investment, and R&D collaboration among all NTIB members, for example by eliminating U.S. procurement restrictions (e.g., Buy American; the Berry Amendment; and the Byrnes-Tollefson Amendment), exempting NTIB members from U.S. investment screening, and eliminating U.S. controls on high-technology and defense-related exports to these trusted nations; and entering into new reciprocal defense procurement agreements or security of supply arrangements, or expanding the coverage of the current agreements (e.g., to medical goods), to ensure that the United States and partner countries have access to essential items in times of emergency or abnormally high demand. Over the longer term, the United States should consider new comprehensive free trade agreements with these and other countries, including by reentering the Trans-Pacific Partnership (now the Comprehensive and Progressive Trans-Pacific Partnership).
There already appears to be support in Congress for several of these recommendations. For example, the 2021 NDAA instructs the DOD to improve NTIB implementation and consider expanding the list of NTIB member countries.160 This process has only just begun, and further NTIB reforms—for example with respect to procurement, investment, and export controls—remain necessary. The legislation also imposes new printed circuit board acquisition requirements on the DOD but permits the DOD to acquire these items from “covered nations,” which includes the United States, NTIB members, NATO members with reciprocal procurement agreements, and any other country (excluding Russia, China, Iran, and North Korea) that meets specified national security conditions.161 - Repealing the Jones Act. As the 2018 Cato Institute paper concluded, the evidence against the Jones Act is compelling:
Under its watch the U.S. shipbuilding industry has atrophied, its shipping fleet has withered, and any contribution to the military’s sealift capability has been trivial at best. The failure of the Jones Act to meet its intended objectives, meanwhile, has inflicted considerable economic harm through a variety of direct and indirect channels. Rather than serving to bolster national security, the Jones Act has stultified domestic shipbuilding, diminished the size of America’s merchant marine reserve, and hamstrung our ability to respond expeditiously and effectively to natural and manmade disasters.162
Nothing less than immediate repeal is warranted. In the meantime, the president should grant any waiver requests submitted by American companies now suffering under the law. - Reforming U.S. export controls. As documented by numerous experts, U.S. “national security” restrictions on certain exports, especially technology products such as satellites and semiconductors, can harm the U.S. defense industrial base.163 For example, export controls can reduce the incentive for investment by reducing the market size for a company’s goods.164 Beyond the aforementioned NTIB-related reform, U.S. policymakers should reform the U.S. export controls regime more broadly by limiting controls to only essential national security objectives; omitting items that are available in other countries; streamlining the export licensing process to minimize exporter (and taxpayer) burdens; or ensuring system flexibility through automatic sunset provisions or mandatory annual reviews of controlled products.
- Reforming existing trade agreement rules on national security and short supply. The terms under which U.S. trade agreement parties can restrict trade in the name of “national security” or “short supply” should be revised to establish objective definitions of both terms and ensure that participants’ invocation of these exceptions is subject to binding dispute settlement.165 These reforms would maintain national sovereignty while increasing predictability for U.S. companies and disciplining abuse by governments. The national security exception changes would also be consistent with the United States’ historical view of the General Agreement on Tariffs and Trade.166
- Eliminating Buy American restrictions. As Cato scholars have argued for decades, Buy American procurement requirements are bad law, bad economics, bad trade policy, and bad politics—and can especially harm U.S. manufacturers.167 The U.S. government should eliminate these restrictions, particularly for the procurement of essential goods and services. For example, the government should terminate the Stock Piling Act’s Buy American rules for “strategic and critical materials” and should block attempts to implement similar rules for the Strategic National Stockpile (which covers medical goods). As President Truman warned when signing the Stock Piling Act into law:
These principles apply equally today.
Other Market-Oriented Reforms to Enhance U.S. National Security
Beyond trade policy, the United States should implement “horizontal” economic reforms that would boost U.S. manufacturers and national security:
- Human capital. To address the DOD’s immediate concerns regarding the dearth of qualified U.S. manufacturing workers in science, technology, engineering, and mathematics fields, the federal government should significantly expand high-skilled immigration. Research shows that U.S. restrictions on high-skilled immigration have undermined national security objectives by encouraging multinational corporations to offshore jobs and R&D activities to their affiliates in more welcoming countries and by benefiting potential U.S. adversaries, especially China, in terms of new jobs, new businesses, and new innovations, thus causing a relative decline in the United States’ own innovative capacity.169 In fact, restrictive U.S. immigration policies have likely boosted China’s semiconductor industry, which the ITC in 2019 found had been hamstrung by a lack of skilled human capital.170
Over the longer term, private-sector training and apprenticeship programs can equip native workers for the future needs of advanced manufacturing industries. For example, the employer-funded Federation for Advanced Manufacturing Education program has helped hundreds of new high-school graduates and older factory workers gain modern (“grey collar”) manufacturing skills and find high-paying work in U.S. factories that now utilize computers and robotics.171 These efforts can be assisted by reforms to federal, state, and local government educational policies that eliminate biases against vocational schools that can provide skills at lower cost and allow older workers, whether currently employed or recently jobless, to train for new careers.172 - Tax policy. Governments should further reform corporate tax policy to encourage American companies—manufacturers or otherwise—to locate and invest in the United States and to ensure that current businesses are globally competitive. In particular, the federal government and the states should further reduce corporate tax rates, which combined remain above the Organisation for Economic Co-operation and Development average and are shouldered in large part by workers and consumers.173 The government should also expand and make permanent the 2017 Tax Cuts and Jobs Act’s temporary “full expensing” provision (“100 percent bonus depreciation”), which allows U.S. businesses to write off certain business investments immediately and fully. Localities might also consider lowering property taxes, which are borne by owners of industrial (and other) real estate and are high by global standards.174 These reforms would benefit all companies and should be pursued regardless of any national security concerns. Nevertheless, they would benefit the U.S. manufacturing sector: substantial research shows, for example, that full expensing increases investment, jobs, and economic growth and that a permanent and expanded version (covering structures such as factories) would especially benefit U.S. manufacturers.175
- Eliminate “never needed” regulations. During the COVID-19 pandemic, state and federal governments temporarily suspended hundreds of regulations to boost domestic production, investment, and adjustment during the national emergency, revealing in the process that these “never needed” regulations discouraged economic growth and dynamism while providing little, if any, public benefit.176 Although many of these regulations affect nonmanufacturing issues and industries (e.g., physician licensing), many others—such as FDA testing and approval of medical goods—directly inhibit the domestic production of certain essential goods. Others, such as biofuels mandates, increase production costs for U.S. manufacturers. Repeal of these regulations would therefore boost not only economic growth generally but also American manufacturers directly—all to the benefit of national security.
Additional government action should not be considered unless and until these and other market-oriented policies prove insufficient to satisfy legitimate U.S. national security concerns. New and expansive industrial policy programs, however, would be unnecessary. U.S. law already provides the federal government with several tools (e.g., Title III of the Defense Production Act of 1950 or U.S. government stockpiles) to fill discrete gaps in the defense industrial base. (See the Appendix.) And experience with these laws, the current state of the U.S. manufacturing sector, and the failures of past “security nationalism” policies argue for both skepticism and caution when pursuing protectionism, subsidies, or other government interventions intended to boost specific parts of the U.S. defense industrial base.177
Case Study: Machine Tools
The case of machine tools—an industry highlighted as “at risk” by the DOD in its Fiscal Year 2019 Industrial Capabilities Report to Congress (and often by advocates of U.S. industrial policy)—shows the potential benefits of several of the reforms in the previous section. The DOD’s report made the following findings:
- The United States in 2017 was the second largest consumer and fifth largest producer of machine tools (behind China, Japan, Germany, and Italy, and just in front of South Korea, Taiwan, and Switzerland).
- “Major risks” to the industry include U.S. universities’ lack of “large-scale industrial machine tool research programs” and of cooperative efforts with industry; a lack of skilled labor to meet current and projected needs (likely the largest problem); “economic tradecraft” and intellectual property theft by China and unnamed other countries; other nations’ “coherent investment plans and tax policies to support their own industrial sectors”; and U.S. export controls. The DOD subsequently lamented the fact that foreign machine tool producers, notably in Japan and Taiwan, were increasing exports to China while decreasing exports to the United States.
- To address the “major risks” identified, the DOD has begun working on plans to improve the U.S. machine tools workforce and establish a national network of “machine tool hubs” focused on both skills development and “increasing the prestige of manufacturing as a profession in order to inspire more prospective workers to choose it as a career.“178
Despite these risks, the DOD did not view it necessary to directly subsidize the U.S. machine tool industry or specific domestic goods using one of the numerous legal authorities permitting it to do so (see Appendix).
Many of the problems that the DOD identified (to the extent that they are valid at all179) would be improved by implementing the reforms discussed in the preceding subsections. Although the United States remained a top-five global producer of machine tools, the government could solidify access to these goods through new arrangements that liberalize trade (tariff and nontariff barriers180) in machine tools with allies and major producing nations such as Japan, Germany, Italy, South Korea, and Taiwan. (In a good first step, the Trump administration reduced tariffs on certain Japanese machine tools as part of the 2019 U.S.-Japan “Phase One” Deal.181) U.S. machine tools producers and their customers, moreover, would benefit from the elimination of tariffs on industrial inputs (especially steel and aluminum) and current restrictions on high-skill foreign workers as well as from corporate tax and regulatory reforms. And U.S. workers would benefit from private-sector workforce development programs such as the Federation for Advanced Manufacturing Education program.
Given the failures of U.S. machine tools protectionism and planning in the 1980s and 1990s, as well as the documented economic and political problems with American protectionism and industrial policy more broadly, these market-oriented policies should be prioritized.
Conclusion
Although theory might support using protectionism and other market interventions to boost national security, current “security nationalism” proposals ignore several facts. First, reports of the demise of U.S. industrial base are exaggerated—overall, the U.S. manufacturing sector is productive on both global and historical terms, as are the industries that are most relevant to national security. Second, history and academic research show that freer markets can bolster national security and economic resilience and that U.S. “security nationalism,” by contrast, has been not only unsuccessful but often based on an expansive and political definition of “national security.” Third, U.S. law already permits the federal government, primarily through the DOD, to address discrete weaknesses in the defense industrial base.
For these reasons, expansive new security nationalism proposals warrant extreme skepticism, and market-oriented policies should be prioritized. As President Truman stated decades ago:
The United States is opposed to governmental policies fostering autarchy, for itself as well as for others. Encouragement of uneconomic domestic production and unjustified preferential treatment of domestic producers destroys trade and so undermines our national economic strength. A large volume of soundly based international trade is essential if we are to achieve prosperity in the United States, build a durable structure of world economy and attain our goal of world peace and security.182
American policymakers would be wise to remember—and heed—Truman’s advice.
Appendix: Summary of U.S. Laws Intended to Support the Defense Industrial Base
U.S. Policies Expanding International Cooperation to Bolster National Security
The National Technology and Industrial Base. The United States has established a four-country National Technology and Industrial Base (NTIB) specifically designed to bolster U.S. national security by expanding the country’s industrial capacity beyond U.S. borders. A 2020 Congressional Research Service (CRS) report describes the NTIB as follows:
The [NTIB] consists of the people and organizations engaged in national security and dual-use research and development (R&D), production, maintenance, and related activities within the United States, Canada, the United Kingdom, and Australia. The NTIB, as established by 10 U.S.C. §2500, is intended to support national security objectives of the United States, including supplying military operations; conducting advanced R&D and systems development to ensure technological superiority of the U.S. Armed Forces; securing reliable sources of critical materials; and developing industrial preparedness to support operations in wartime or during a national emergency.183The CRS report adds that the NTIB was part of an effort by Congress in the mid-1990s to support production and R&D of critical defense materials and products. It originally included Canada—a long-standing U.S. defense industrial partner184—but was expanded in 2016 (as part of the National Defense Authorization Act for Fiscal Year 2017) to include the United Kingdom and Australia to leverage those countries’ defense R&D efforts and to avoid U.S. restrictions on exports of technology to these allies. According to the report, “Congress also directed [the Department of Defense] to create a plan that would promote closer integration of the technology and industrial bases of all NTIB member countries.“185 Such integration was, in Congress’ view, an important way to boost U.S. national security.
Participation in the NTIB allows member countries and their manufacturers several benefits: procurement preferences for conventional ammunition, uniforms, and other items; exemptions from some domestic sourcing (Buy American) restrictions on the U.S. government’s acquisition of buses, chemical weapons antidotes, valves and machine tools, ball bearings and roller bearings, and certain components for naval ships (including diesel engines);186 exemptions from foreign ownership requirements of the National Industrial Security Program; and preferences for contracts awarded under a national security program. U.S. law also directs the secretary of defense to develop a “national security strategy for the NTIB based on a prioritized assessment of risks and challenges to the defense supply chain” and to submit both an annual report to Congress on “NTIB capabilities, performance, and vulnerabilities” and a report on “unfunded priorities to address gaps or vulnerabilities in the NTIB.“187
Although the NTIB was established years ago and reflects Congress’s priority to bolster national security through international cooperation, little work has been undertaken to achieve congressional objectives. For example, the Fiscal Year 2019 Industrial Capabilities Report to Congress issued in 2020 contains limited references to the NTIB and describes no major U.S. government efforts thereunder (even though it notes a 2018 Department of Defense [DOD] recommendation to address industrial base risks by “working with allies and partners on joint industrial base challenges through the NTIB and similar structures”).188
The CRS also noted other limitations on the NTIB’s use and thus the effective integration of the NTIB countries’ defense industrial bases, including domestic sourcing requirements, such as the Buy American Act (41 U.S.C. §§ 8301–8303) and the Byrnes-Tollefson Amendment (10 U.S.C. § 8679); small business set-asides that apply only to American small businesses as defined under U.S. law; U.S. export controls on certain categories of defense articles and services, especially the International Traffic in Arms Regulations, administered by the State Department, that restrict the export of defense-related goods and services;189 and the NTIB’s omission of Finland, Germany, the Netherlands, South Korea, Singapore, Switzerland, Sweden, or other U.S. allies that are innovative and productive.190
International Defense Procurement Agreements. The United States also has several agreements with allies to ensure sufficient supplies of defense-related materials:
- Pursuant to reciprocal defense procurement agreements between the DOD and its counterparts in 27 foreign governments, each country agrees to remove barriers to national security–related purchases of supplies and services of the other country.191 The countries with which the DOD has these agreements also are considered “qualifying countries” under the United States’ Defense Federal Acquisition Regulation Supplement 225.872, meaning that the DOD has determined it “inconsistent with the public interest” to apply restrictions on the federal government’s acquisition of qualifying products from these countries.192
- Second, the DOD also has security of supply arrangements with several countries (see Table 8) that “allow the DOD to request priority delivery for DOD contracts, subcontracts, or orders from companies in these countries.” These arrangements implement the “Meeting National Defense Requirements” section of the “Declarations of Principles for Enhanced Cooperation in Matters of Defense Equipment and Industry” that the United States has signed with certain nations that “recognizes the potential for a certain degree of mutual interdependence of supplies needed for national security, and calls for the parties to explore solutions for achieving assurance of supply.“193

Domestic Laws Aimed at Supporting the “Defense Industrial Base”
U.S. law also provides the DOD with authority to identify and mitigate defense-related industrial procurement and capacity issues.
First, U.S. law requires the DOD to assess annually the defense industrial base and work to mitigate any potential concerns. In particular, the DOD is required to “develop a national security strategy” for the NTIB that “shall be based on a prioritized assessment of risks and challenges to the defense supply chain and shall ensure that the national technology and industrial base is capable of achieving” multiple enumerated objectives, including the president’s National Security Strategy and “sustaining production, maintenance, repair, logistics, and other activities in support of military operations of various durations and intensity.” The law further requires the DOD, in consultation with secretary of commerce and the secretary of energy to “prepare selected assessments of the capability of the national technology and industrial base to attain the national security objectives set forth” in the statute. This includes the submission of an annual Industrial Capabilities Report to Congress that reviews the U.S. defense industrial base and describes “any mitigation strategies necessary to address any gaps or vulnerabilities in the national technology and industrial base” and “any other steps necessary to foster and safeguard the national technology and industrial base.“194
Second, U.S. law provides the DOD with several tools to implement the “mitigation strategies,” including those listed and described in Table 9. For example, the Defense Production Act of 1950 (DPA) allows the DOD to identify priority sectors for government contracting and enter into those contracts (Title I) and to support, through purchases or loans/loan guarantees, “essential” domestic industrial base capabilities that are found to be nonexistent, at risk of loss, or insufficient to meet government needs (Title III). Several other programs provide the DOD with the authority and funding to support the industrial base. The DOD also can use the National Defense Stockpile Transaction Fund and Strategic and Critical Materials Stock Piling Act (50 U.S.C. § 98 et seq.), which authorizes the National Defense Stockpile Manager to fund material R&D projects to develop new materials for the stockpile and requires the president to encourage the development and conservation of domestic sources of “strategic and critical materials” through procurement.195 The Stock Piling Act is also subject to the Buy American Act of 1933, despite President Truman’s opposition at the time the policy was enacted.196
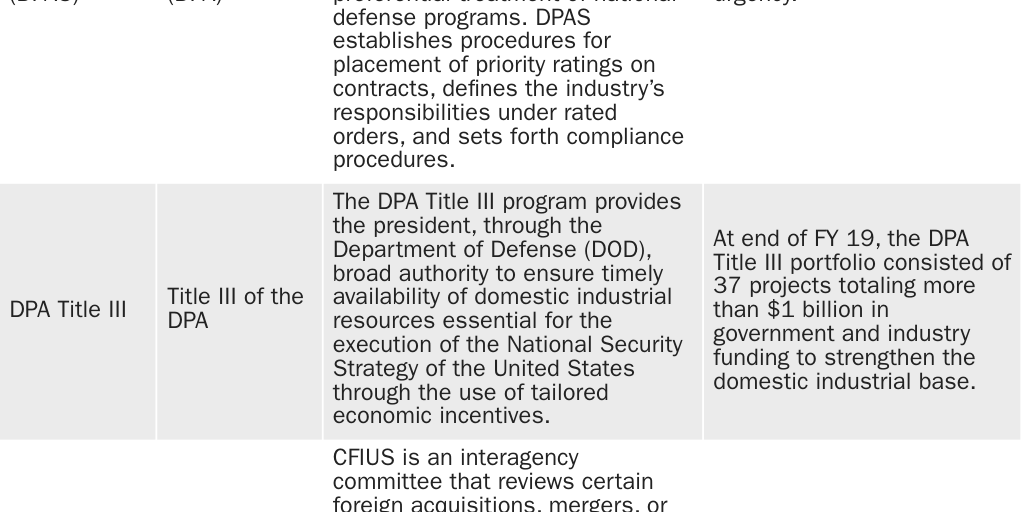
Past DOD recommendations and actions have used these laws to support the U.S. defense industrial base. For example, in a September 2018 DOD report issued pursuant to President Trump’s July 21, 2017, Executive Order 13806 on “Assessing and Strengthening the Manufacturing and Defense Industrial Base and Supply Chain Resiliency of the United States,” the DOD expressly noted that it can address industrial base risks by, among other things: expanding direct investment in the lower tier of the industrial base through DPA Title III, ManTech, and Industrial Base Analysis and Sustainment programs; diversifying sources of domestic and international supply of critical materials and technologies, including through expanded use of the National Defense Stockpile program; and working with allies and partners on joint industrial base challenges through the NTIB and similar structures.197
The fiscal years 2018 and 2019 industrial capabilities reports submitted to Congress also use the legal authorities from Table 9. The reports, however, do not show a broad-based decline in the U.S. manufacturing sector as a whole and instead conclude that the U.S. defense industrial base is, in general, “profitable and expanding.“198 The fiscal year 2019 report, in particular, summarizes the strong and improving state of the defense industry and then provides sector-specific risk assessments for aircraft; chemical, biological, radiological, nuclear; ground systems; missiles and munitions; nuclear matter warheads; radar and electronic warfare; shipbuilding; soldier systems; space; materials; cybersecurity for manufacturing; electronics; machine tools; organic defense industrial base; software engineering; and workforce. These analyses reveal very few sector-wide concerns, instead focusing on narrow product/process risks (e.g., ammonium perchlorate supply or gallium nitride technologies199) that may require DOD support. As a result, the fiscal year 2019 report lists relatively few actions by the DOD to mitigate—for example through direct funding under DPA Title III—risks to the domestic industrial base. Indeed, the most common risks found in the DOD industrial bases analyses are lack of a skilled and “clearable” workforce and insufficient demand from the U.S. government. Neither can be blamed on “deindustrialization.”
The primary exceptions to DOD’s conclusions are in the soldier systems (textiles; batteries; night vision), electronics (in particular, printed circuit boards), and machine tools sectors, where the DOD voiced broader concerns about the health of the domestic industry. However, despite these complaints, the DOD did not intervene (e.g., through subsidies or contracts) to support the sector’s industrial capabilities or specific products. Among the DOD’s reasons for not doing so was a lack of “unacceptable levels of industrial base risks.“200 Instead, the DOD’s efforts were again focused on improving workforce-related impediments, such as science, technology, engineering, and mathematics training and “increasing the prestige of manufacturing as a profession in order to inspire more prospective workers to choose it as a career.“201
U.S. Trade Laws Aimed at Protecting the Defense Industrial Base
U.S. law also authorizes the imposition of restrictions on imports to protect certain U.S. industries. The following laws are the most common:
- Section 232 of the Trade Expansion Act of 1962 authorizes the executive branch to initiate an investigation to determine the effects on the national security of imports of a certain product or group of products; prepare a report on the findings of such an investigation and recommend action (e.g., tariffs or quotas) against the subject imports where the report finds that “such article is being imported into the United States in such quantities or under such circumstances as to threaten to impair the national security”; and based on the report and recommendations, adjust the imports of the article and its derivatives so that such imports will not threaten to impair the national security.202 The Commerce Department (or the Department of the Treasury before it) initiated a total of 31 Section 232 investigations between 1962 and 2019 and initiated three more cases in the first half of 2020.203
- U.S. “trade remedy” laws allow for the imposition of duties on imports from specific countries that are found to have injured or threatened to injure the U.S. industry making the same (or directly competitive) product. Antidumping duties guard against imports that are alleged to be priced below “fair market value” (typically determined via a Commerce Department examination of home market prices or production costs); countervailing duties apply to allegedly subsidized imports; and safeguards apply to imports that have experienced recent and unexpected surges. As of August 2020, there were 539 antidumping or countervailing duty orders and two safeguard actions.204
- Buy American laws restrict government procurement to domestically produced goods. The Buy American Act of 1933 requires federal agencies, including the DOD, to buy U.S. “unmanufactured articles, materials, and supplies” and “manufactured articles, materials, and supplies” (produced in the United States domestic inputs) when they are acquired for public use, unless a specific exception applies.205 Other major domestic procurement restrictions include the Buy America provision of the Surface Transportation Assistance Act of 1982; the American Iron and Steel Requirements of the Consolidated Appropriations Act, 2014, and the Water Resources Reform and Development Act of 2014; and the American Recovery and Reinvestment Act of 2009. These laws restrict specific types of federal government procurement, especially for the construction of public buildings, aviation projects, highways, railroads and rail cars, and buses;206 specific sectors, including supplies, construction materials, information technology, and defense;207 and the procurement of specific materials, especially iron and steel.208 Finally, defense procurement is further restricted by the Berry Amendment (10 U.S.C. § 2533a), which applies to food, clothing, fabrics, fibers, yarns, other made-up textiles, and hand or measuring tools; and the Byrnes-Tollefson Amendment (10 U.S.C. § 8679), which restricts U.S. government contracting for vessel construction or repair at foreign shipyards.209
Other U.S. laws intended to protect American manufacturers from allegedly unfair or injurious competition include Section 337 (19 U.S.C. § 1337), which addresses antitrust and intellectual property rights claims, including allegations of patent infringement and trademark infringement by imported goods; Section 301 of the Trade Act of 1974, which permits the Office of the U.S. Trade Representative to respond to unfair trade practices and in certain cases impose unilateral remedies (e.g., tariffs) against imports from the offending country; and both the Trading with the Enemy Act of 1917 and International Emergency Economic Powers Act of 1977, which allow the president to regulate all forms of international commerce and to freeze assets in times of war or national emergency.
Citation
Lincicome, Scott. “Manufactured Crisis: ‘Deindustrialization,’ Free Markets, and National Security,” Policy Analysis no. 907, Cato Institute, Washington, DC, January 27, 2021. https://doi.org/10.36009/PA.907.

About the Author


This work is licensed under a Creative Commons Attribution-NonCommercial-ShareAlike 4.0 International License.