
Americans are concerned about immigrants’ involvement in crime and their potential reluctance to cooperate with law enforcement. The National Crime Victimization Survey (NCVS) can help address these concerns. First, since criminals typically commit offenses near where they live and against people with similar demographics, the victimization rate can show whether immigrant communities are experiencing higher crime rates. Second, the NCVS can prove whether immigrants are less likely to report crimes to the police.
The NCVS started recording citizenship status in 2017. From 2017 to 2023, immigrants were 44 percent less likely than US-born Americans to be victimized by violent criminals and were 64 percent less likely to be harmed by someone they knew. Immigrants also worked with police to solve violent crimes. Immigrant victims were 29 percent more likely than US-born victims to personally report violent crime to the police. Immigrants worked with police on 5.1 million crimes during that time. Victims’ cooperation with police led to nearly half a million criminal arrests and about 300,000 arrests of violent offenders.
Because they commit fewer violent crimes, immigrants lower the violent-victimization rate in the United States. Furthermore, at least prior to the current mass deportation efforts, immigrants cooperated more with police to solve violent crimes when they occurred. Americans should trust that their immigrant neighbors help create safer communities.
Introduction
For decades, researchers have found that the average immigrant to the United States commits fewer crimes than the average US-born American.1 But critics have complained that surveys of offenders are unreliable, that arrest and conviction data are incomplete, and that immigrants’ lack of crime reporting may understate their criminality. This paper tests the robustness of past research by analyzing immigrant violent crime from the perspective of crime victims. Given the fact that criminals disproportionately victimize people they know, people in their area, and other people involved in crime, demographic groups with higher rates of victimization also have higher rates of offending.
Using data from the National Crime Victimization Survey (NCVS), we find that from 2017 to 2023:
- Victimization and offending rates by race were highly correlated, suggesting that victims and offenders share common backgrounds;
- All immigrants were 44 percent less likely to be victims of violent crimes, and noncitizens were 30 percent less likely, than US-born Americans;
- All immigrants and all noncitizens were 64 percent and 49 percent, respectively, less likely to be violently victimized by people they knew—who in turn are more likely to be immigrants themselves;
- Violent-victimization rates by relatives and intimate partners were also 65 percent lower for immigrants than for the US-born;
- These differences in victimization rates by known offenders almost precisely match the Census Bureau’s estimates for the differences between US-born and immigrant incarceration rates;
- Victimization by people known to victims is lower for immigrants for all types of violent crime: threats, robbery, simple assault, aggravated assault, and sex offenses;
- There is also no evidence of a recent shift, with the victimization gap remaining nearly the same from 2020 to 2023 as it was pre-pandemic, from 2017 to 2019;
- Violent crimes against immigrants were reported 15 percent more frequently than violent crimes against the US-born from 2017 to 2023. For noncitizens, the difference was 18 percent;
- Rather than relying on intermediaries to report on their behalf, immigrant victims personally reported violent crimes 29 percent more frequently than US-born victims. Noncitizens were 32 percent more likely to report violent crimes; and
- Immigrants reported 5.1 million crimes to the police. Immigrant victims’ cooperation with police led to about 457,000 total arrests and about 300,000 arrests for violent crimes within six months of the offense.
We have good reasons to believe that immigrants are both less likely to commit crimes—at least they were before the recent mass deportation efforts—and more likely to report them. The NCVS reinforces the conclusion of the immigrant crime literature that finds immigrants are less crime prone. Although some immigrants do commit crimes and therefore contribute to the total number of crimes, lower crime rates reduce the likelihood of victimization for Americans.
Background
Immigrants’ effect on crime has become a polarizing topic in politics in recent years, but the lack of available data has hampered efforts to find direct answers. The federal government and nearly all states do not maintain any record of criminal arrests by the immigrant history and status of the offenders.2 Where such data exist, they show that immigrants are less likely to commit serious crimes.3 However, there are ongoing debates about the quality of the data and whether immigrants’ unwillingness to report crimes biases the results.4
By surveying both victims and nonvictims of crimes, the National Crime Victimization Survey (NCVS) can check the robustness of the rest of the immigrant crime literature.5 The NCVS is a large-scale, rotating-panel household survey of a randomly selected, nationally representative sample of 240,000 noninstitutionalized persons (not in prisons, nursing homes, etc.) over the age of 12.6 The Census Bureau has conducted the survey on behalf of the Bureau of Justice Statistics since the 1970s—with the citizenship question being added in 2017.7 New households are added every three and a half years. The survey, which is conducted throughout the year, asks participants whether they have been a victim of a crime in the last six months, and if so, asks details about the incident, including whether it was reported to the police.8
Although the NCVS surveys victims, it can also provide important insights into the characteristics of perpetrators. First, many crimes, such as domestic violence and child sexual abuse, are most often committed against close household members.9 In the NCVS, most violence victims know their offenders. Second, criminals typically commit offenses near their homes because they are more familiar with those areas,10 and immigrants tend to collocate.11 In the NCVS, over half of all violent crimes occur in the victim’s home or within a mile of it. Third, as criminals often victimize other criminals, and exposure to violence is a predictor of violent behavior among both immigrants and the US-born,12 if a particular population is committing crimes, they are more likely to also be victims of crimes.13
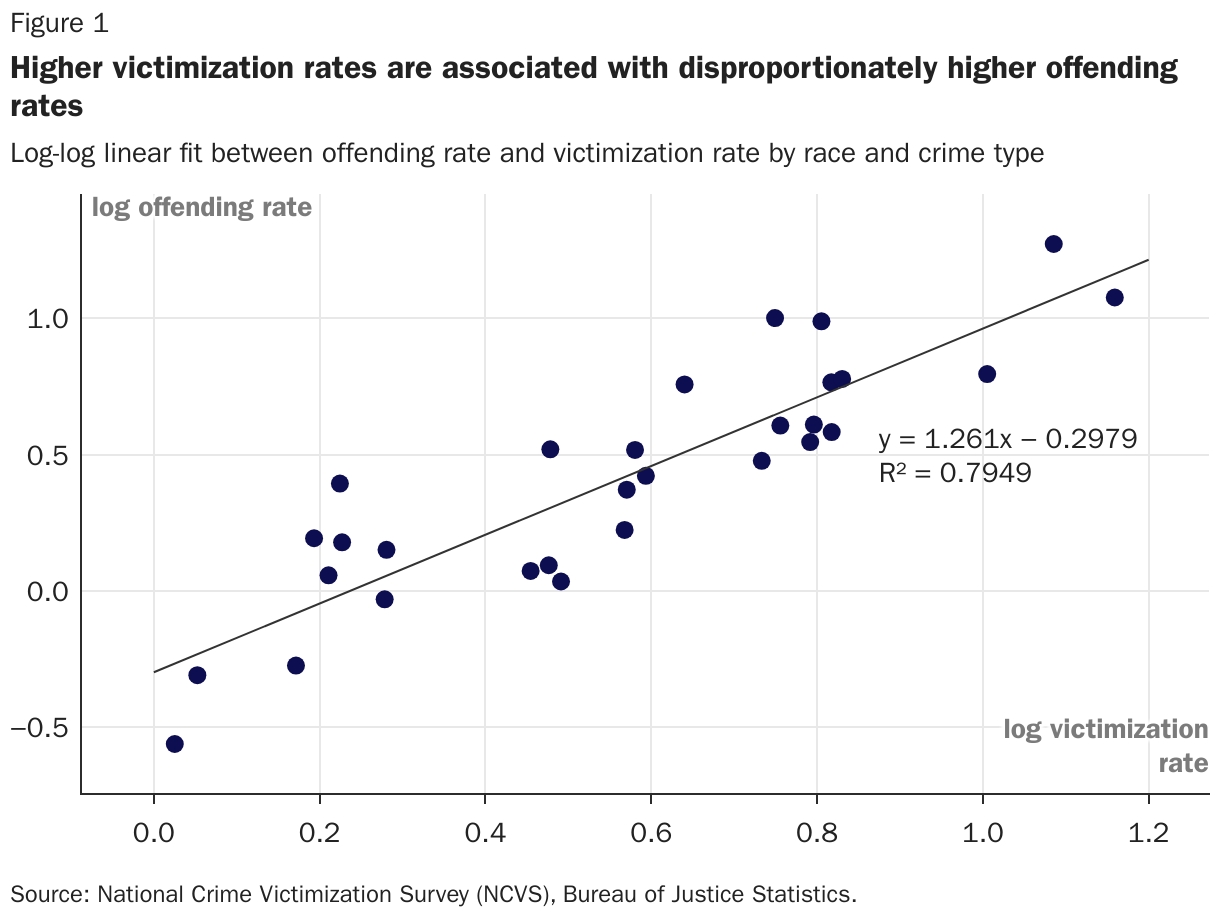
For these reasons, perpetrators are much more likely to commit crimes against people who share their demographic characteristics, including age, sex, race, and socioeconomic status.14 From 2017 to 2023, more than three-quarters of white victims who could identify the race of their offenders identified them as white. For Asians, Blacks, and Hispanics, the share of same-race assailants was between two and six times greater than the race’s share of the US population. Unsurprisingly, then, victimization rates and offending rates by type of violent crime and demographic group are correlated in the NCVS. A 1 percent increase in the victimization rate of one subpopulation is associated with a 1.26 percent increase in the offending rate by that same subpopulation (Figure 1).
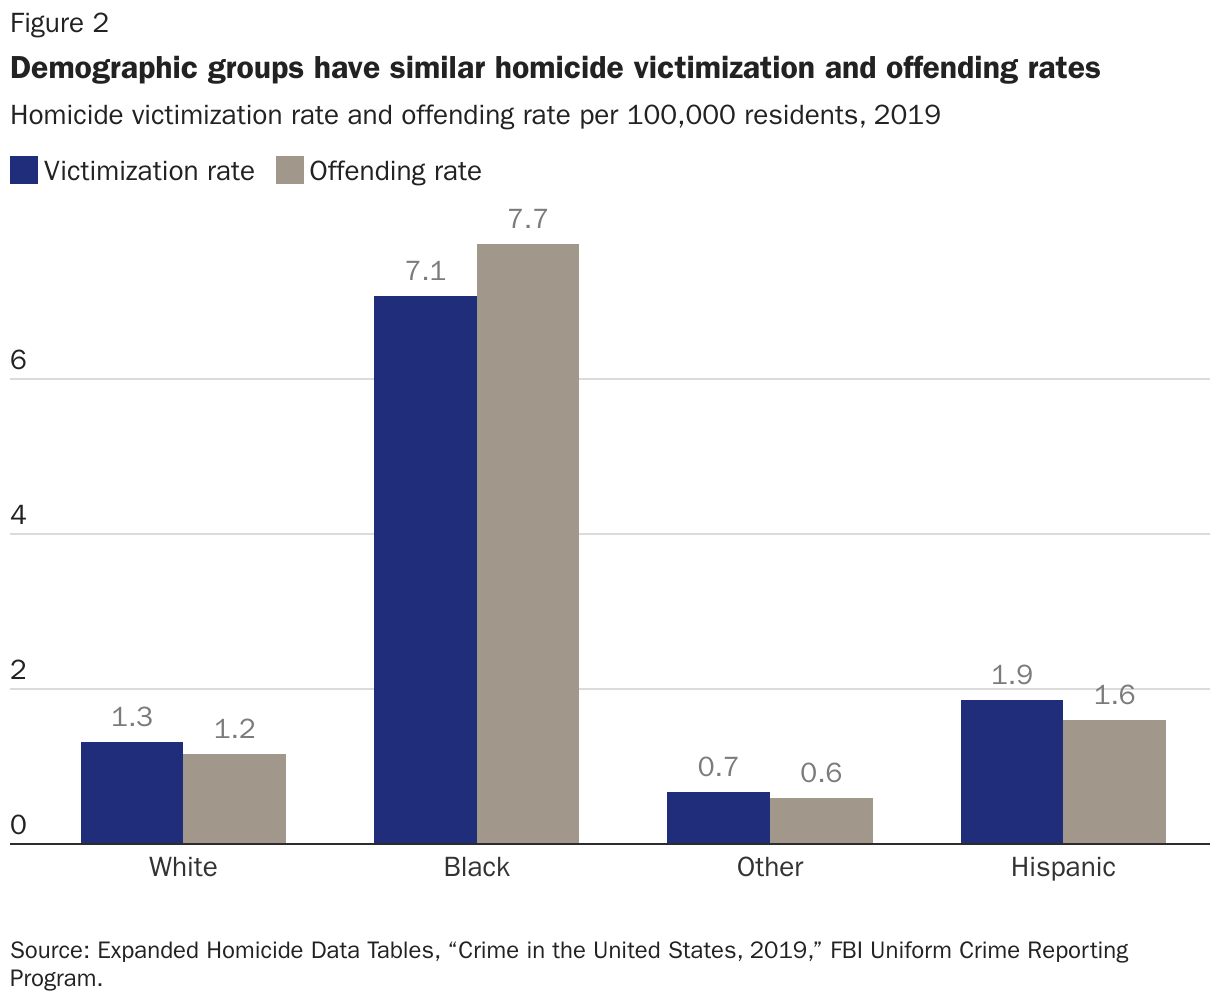
In the NCVS, victims are asked about their subjective assessment of the perpetrator’s race, which could prejudice the result or leave significant uncertainty about it, and many victims did not identify any race. For this reason, we also show victimization and offending rates for homicide, a category of crime that is not included in the NCVS (since the victim is dead) and is the one where offenders are identified by law enforcement most frequently.15 As Figure 2 shows, homicide victimization rates are very similar to offending rates. In 2019, the victimization rate for each racial group was within 14 percent of the offending rate for that race.
This suggests that if immigrants have a noticeably high offending rate, they may be more likely to have a high victimization rate. Although all surveys suffer from sampling and measurement errors, various respondent biases, and other problems, surveying victims can sidestep potential biases inherent to data on arrests, convictions, and incarcerations. Moreover, the victimization survey avoids the concern that criminals might not respond to or might lie on other surveys with direct offending measures.
Our results indicate that immigrants are significantly less likely to experience violent victimization and that immigrants are more likely to report violent crimes. Both conclusions are consistent with previous research from earlier NCVS panels that included the citizenship question.16 Findings from other, smaller surveys support this conclusion.17 The NCVS includes only nonfatal violence since murder victims cannot be surveyed, but additional research using the National Violent Death Reporting System has established that immigrants are also less likely to be homicide victims, at least in the subset of states using the system in 2017.18
The fact that immigrants report crimes at higher rates means that estimates of immigrant crime rates based on reported crime may overstate immigrants’ involvement in crime. Since those measures had routinely indicated that immigrants were less likely to end up arrested, convicted, or incarcerated, the NCVS provides even more reasons to believe that immigration positively affects community safety by lowering crime rates.19 Moreover, if immigrants were assured that they would not be targeted by immigration enforcement over their immigration status, there is some evidence that immigrants would become even more cooperative with the police.20
Immigrant Victimization Rates
Since 2017, the NCVS has asked survey respondents to report whether they were US citizens by birth, US citizens by naturalization, or noncitizens. The survey also allows “don’t know” or no response.21 We generally categorize the relatively small number of nonresponses as noncitizens because noncitizens are most likely to respond in these ways, and they otherwise have similar demographic characteristics to noncitizens.22 It is a conservative assumption, as immigrant victimization rates are slightly higher with this population. In this paper, “immigrants” refers to both naturalized citizens and noncitizens. “Noncitizens” includes illegal immigrants, who are almost half of all noncitizens,23 but the NCVS does not separately identify them, nor is there a way to indirectly identify a statistically valid sample of illegal immigrants in the NCVS.24
Although there is always a concern that immigrants—particularly undocumented immigrants—may be undersampled in any survey, there are reasons to believe that immigrants generally respond to the NCVS at similar rates as the US-born population. First, the citizenship question is always asked at the end of the survey, after victimization information is gathered, to avoid raising undue concern about the respondents’ status.25 Second, the NCVS provides interpreters for non-English-speaking respondents.26 Finally, Spanish speakers were statistically as likely as native English speakers to respond to the survey, and places where immigrants make up more of the population respond similarly to the NCVS—at least from 2011 to 2014, the years for which the NCVS made detailed location and language data available to some researchers.27
Although the NCVS includes a robust sample of the population, the annual subsamples of immigrant violent-crime victims are usually too small to analyze by individual years. For this reason, we pool the samples for the entire period from 2017 to 2023 for which citizenship data are available. In a later section, we break out 2020 to 2023 to compare between periods, but the differences are minor. Following the Bureau of Justice Statistics’ methodologies, we present victimization rates as the number of victimizations (not victims) per 1,000 residents, and we exclude outliers with more than 10 victimizations.28 Our main results are for violent crimes, but the Appendix shows all crime categories, which broadly follow the same pattern.
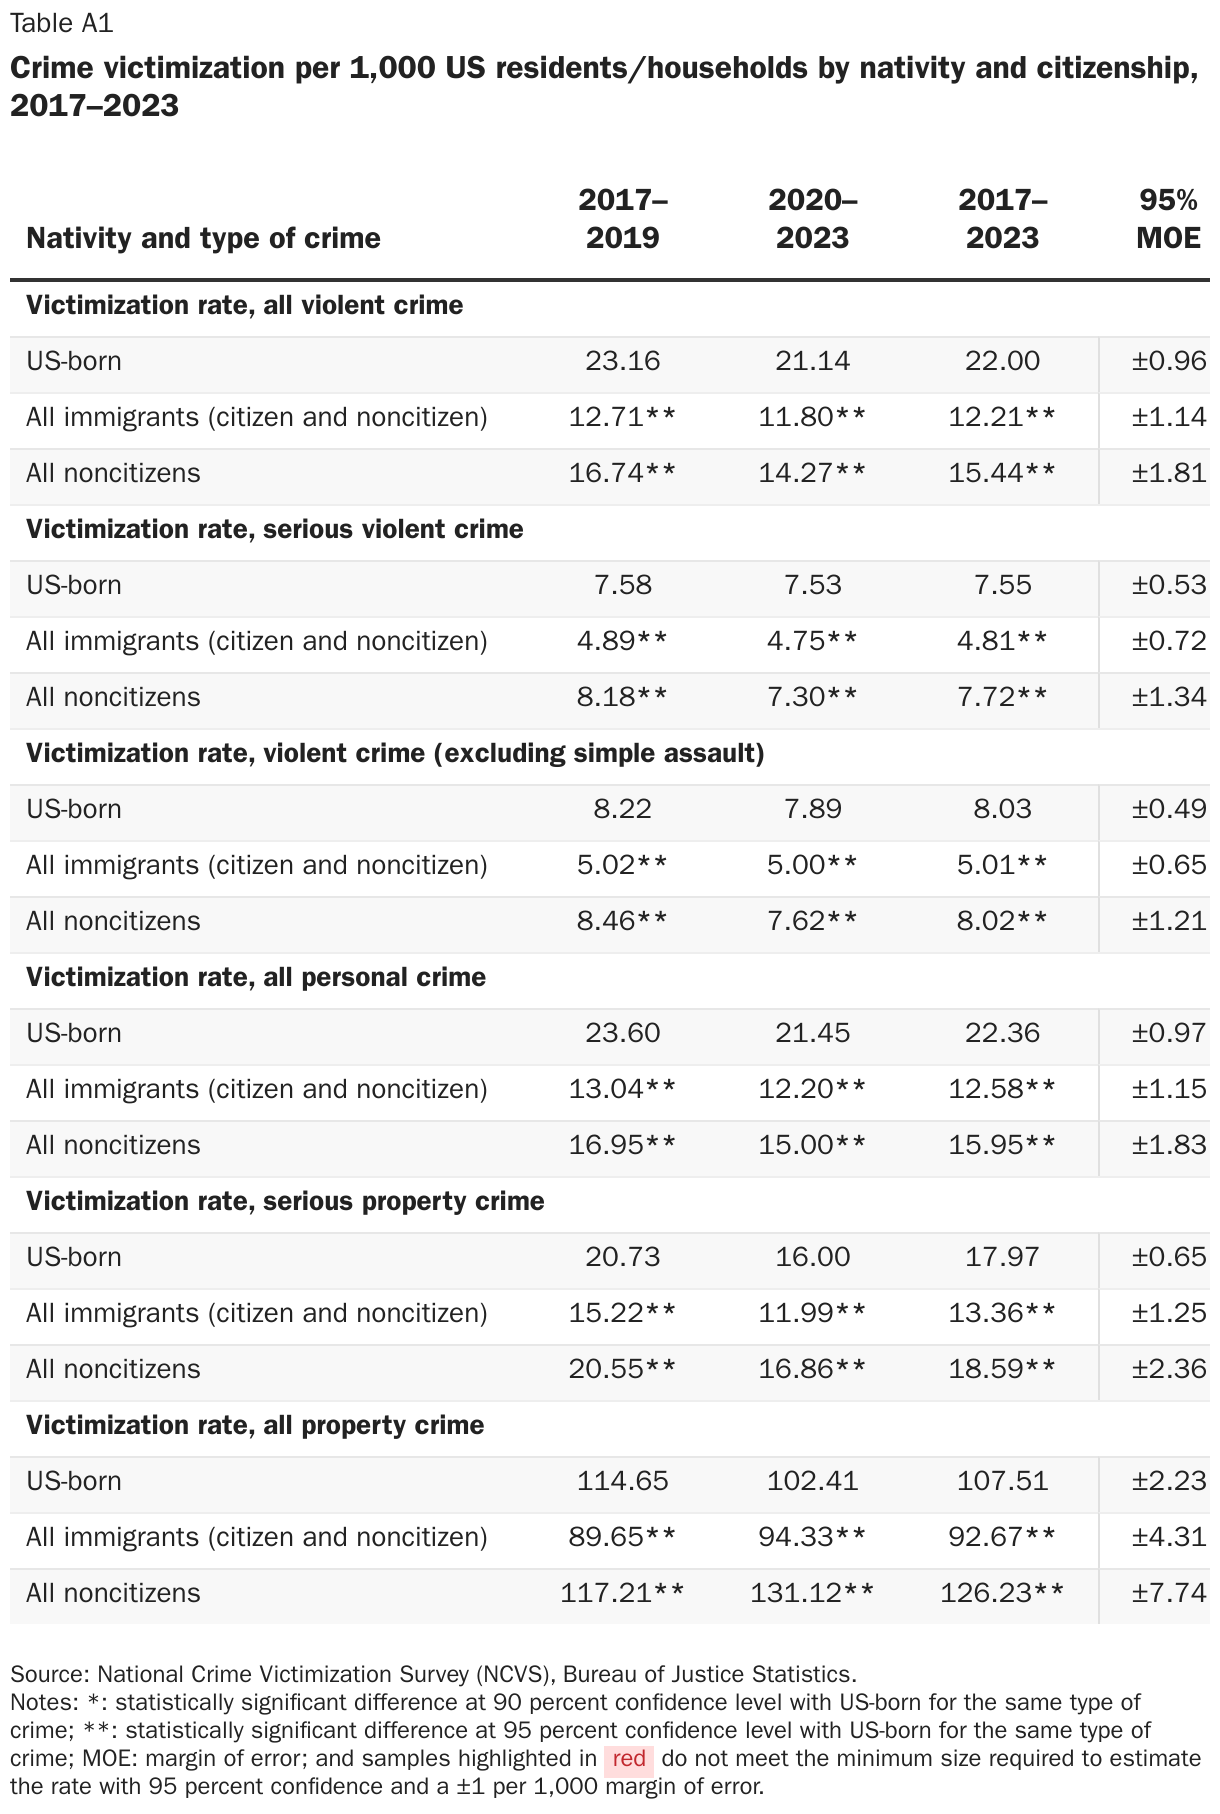
The NCVS shows that, from 2017 to 2023, immigrants had a violent-victimization rate of about 12 victimizations per 1,000 individuals, and that the US-born had an average violent-victimization rate of 22, about twice the immigrant victimization rate (Figure 3). Immigrants were 44.5 percent less likely than the US-born population to be victims of violent crimes. In cities with populations greater than 100,000, the gap was 47 percent. Even among people under age 35, the disparity narrows but remains strong at 39 percent. These differences with the US-born are all statistically significant at the 95 percent confidence level.29
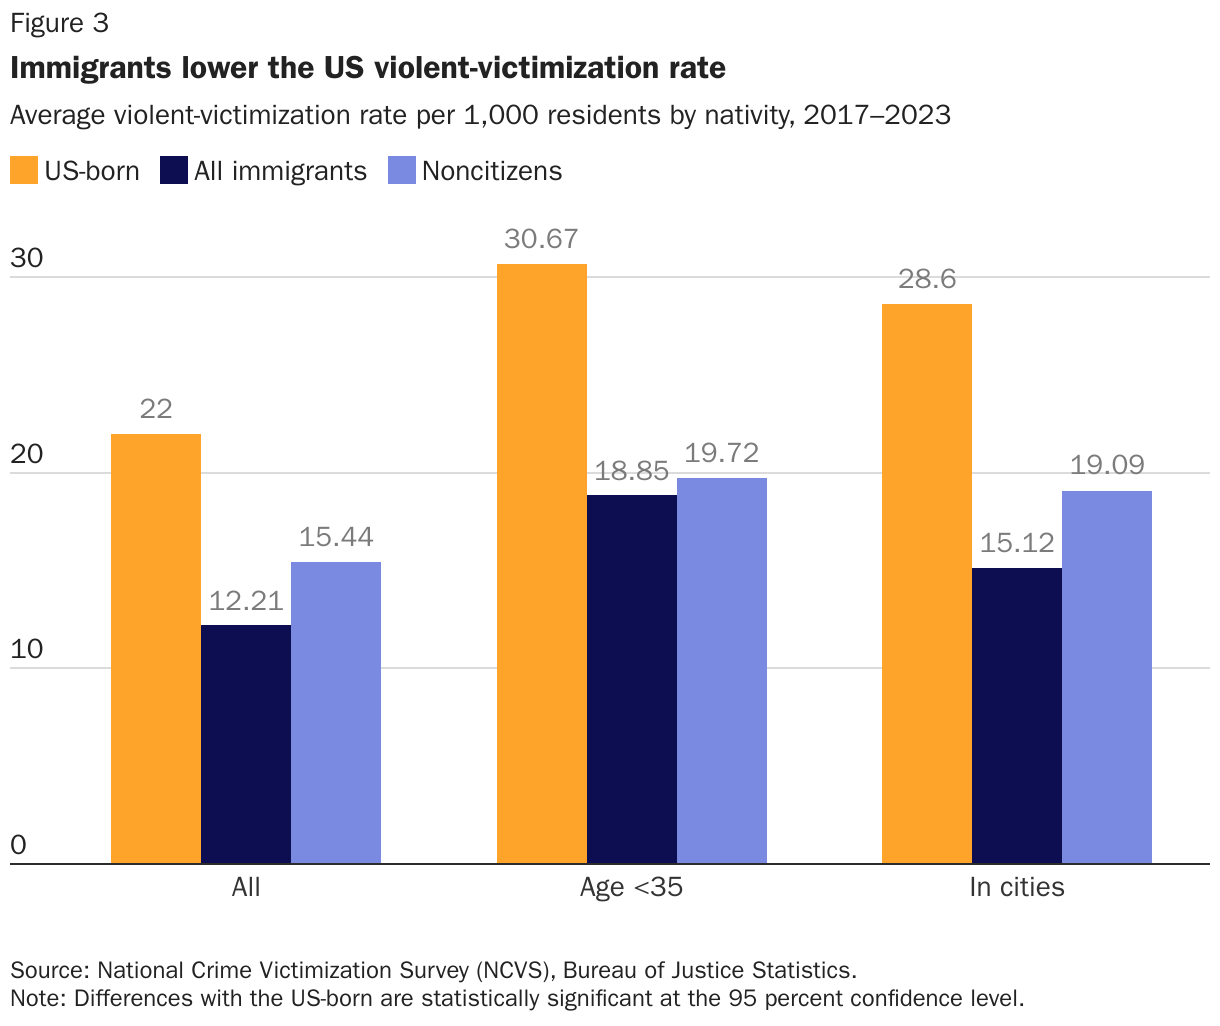
The NCVS also reveals a substantial gap between victimization rates for US-born individuals and noncitizens. From 2017 to 2023, noncitizens—both legal and illegal—were 30 percent less likely to be victims of violent crimes. Although the victimization rate was higher for noncitizens compared to all immigrants, their younger ages mostly explain this difference. The noncitizen and immigrant victimization rates for people under age 35 were nearly identical. Even lesser-skilled noncitizens—those without bachelor’s degrees—were less likely than the average US-born citizen to be victims.30
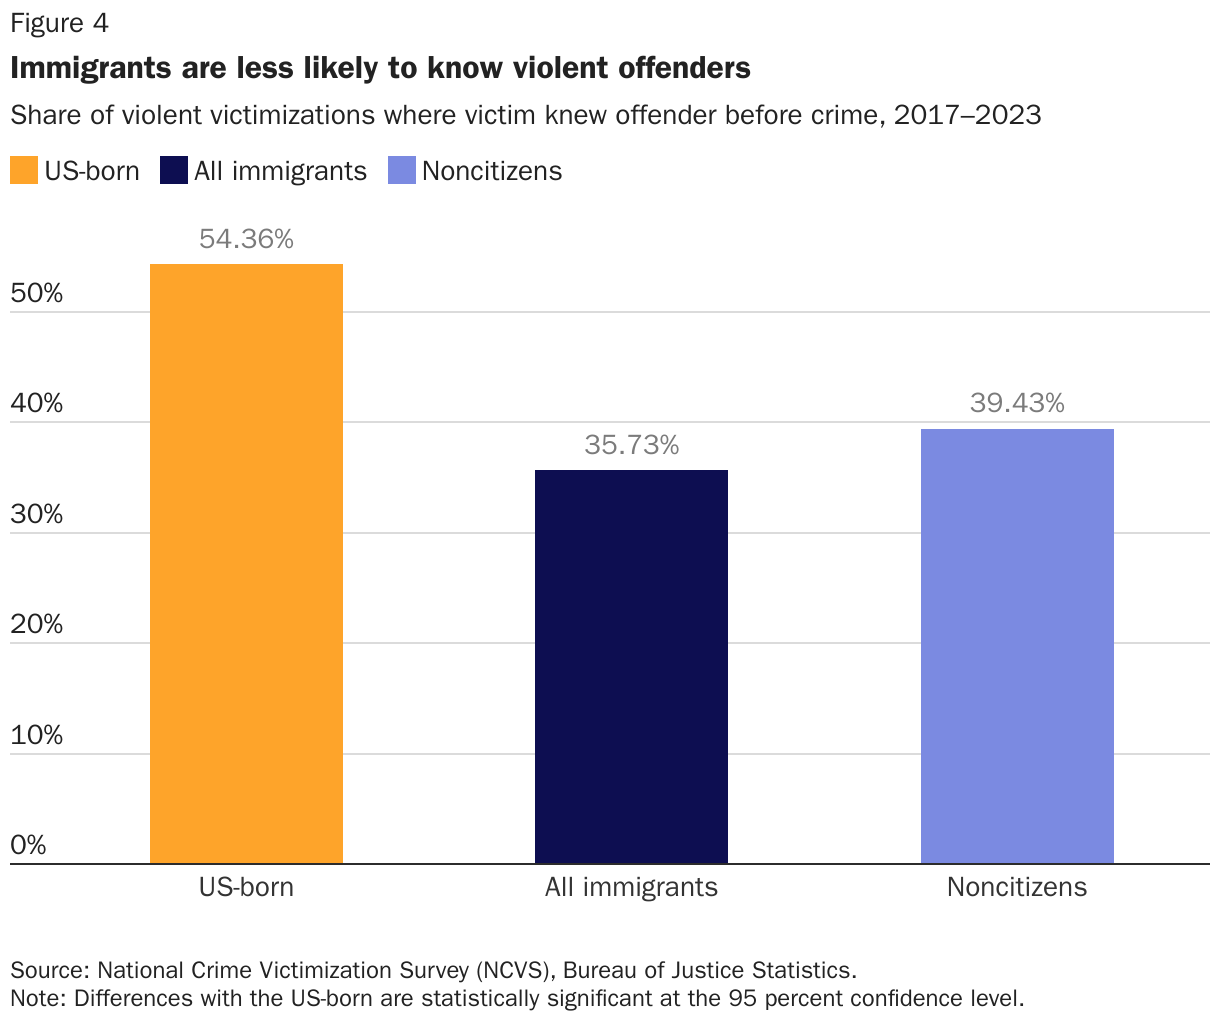
If immigrants have lower victimization rates because they are less likely to commit crimes, that could mean they are also less likely to be victimized by people they know, who are more likely to be immigrants as well. The NCVS supports this conclusion. From 2017 to 2023, 54 percent of US-born American violent-crime victims knew their attackers, compared to 36 percent of immigrants and 40 percent of noncitizens (Figure 4).
This means that, as seen in Figure 5, the immigrant victimization rate per 1,000 residents is even lower compared to the US-born when focusing on crimes where the victim knew the offender (12 versus 4.4). Overall, immigrants were 64 percent less likely to be victimized by someone they knew, while noncitizens were 49 percent less likely than US-born Americans to be victimized by someone they knew. Again, this suggests that the people whom immigrants know—commonly other immigrants—are much less likely to commit violent crimes.
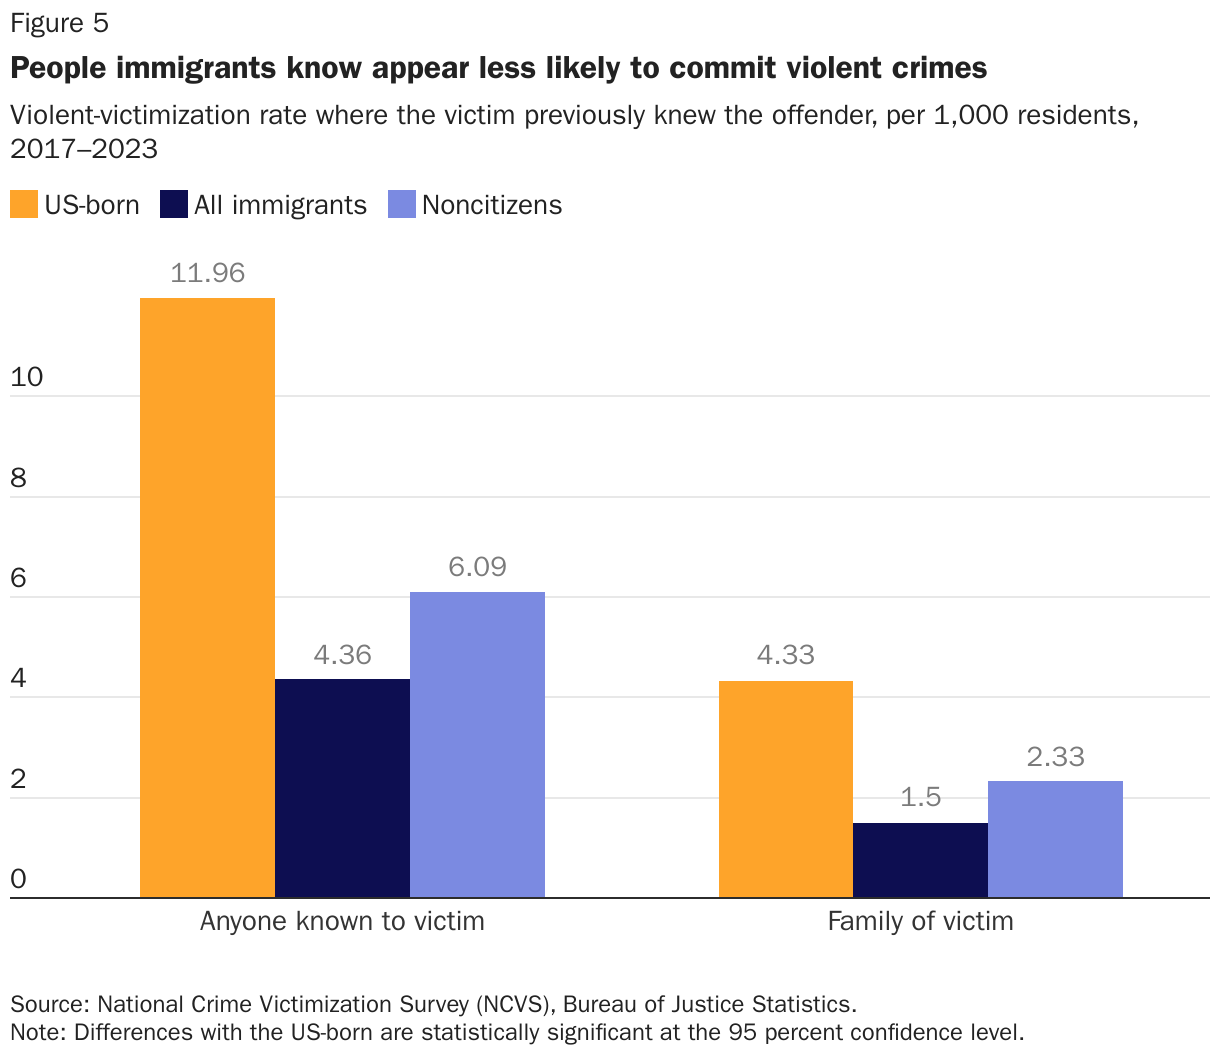
This conclusion also holds for immigrants’ relatives and intimate partners, who are even more likely to be immigrants. All parents of immigrants in the US are also immigrants, and about three-quarters of their spouses and coparents are immigrants.31 The NCVS asks about victimizations by close and extended relatives, though most violent crimes are committed by immediate relatives. From 2017 to 2023, immigrants were 65 percent less likely than a US-born person to be victims of violent crime perpetrated by a relative or intimate partner; noncitizens were 46 percent less likely. Thus, the relatives of immigrants appear much less violent than those of US-born Americans.
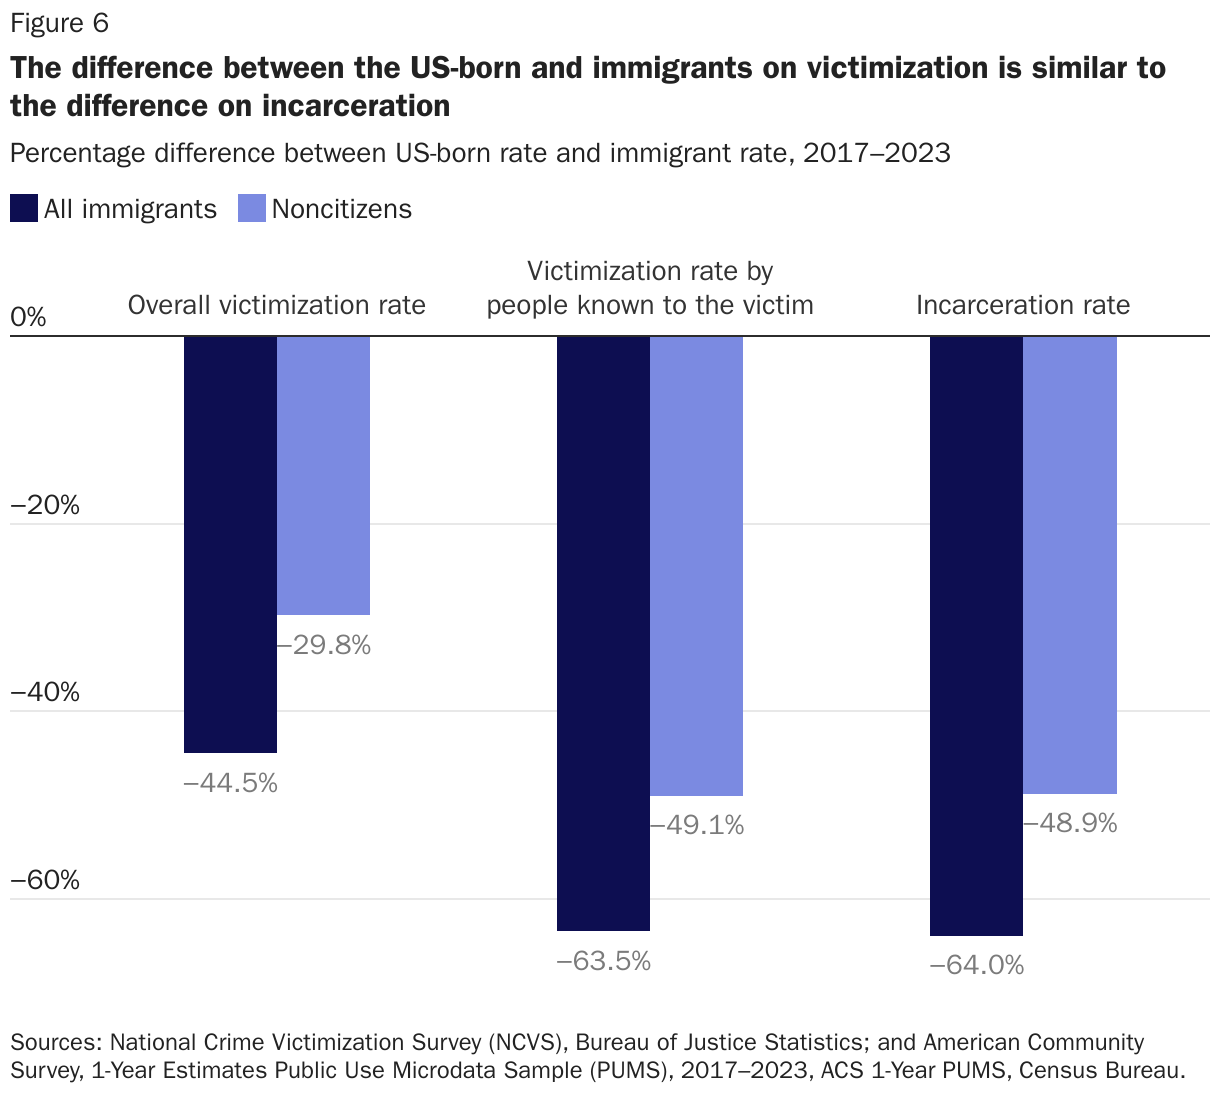
The NCVS does not survey institutionalized persons, and most prisoners are incarcerated for violent crimes.32 If immigrants are overrepresented in the prison population, this could affect our conclusion, especially because criminals are more likely than the average person to be victimized.33 But immigrants are not overrepresented in prisons—in fact, they are underrepresented. The Census Bureau’s American Community Survey (ACS) shows that from 2017 to 2023, an average of only half a percent of immigrants and 0.7 percent of noncitizens were incarcerated, compared to 1.4 percent of the US-born population.34
Incarceration rates also reinforce the conclusion that lower victimization rates accurately indicate less involvement in crime. Figure 6 compares the percentage difference between the immigrant victimization rate and the US-born rate to the percentage difference between the immigrant incarceration rate and the US-born rate. From 2017 to 2023, the ACS reports that immigrants and noncitizens were, respectively, 64 percent and 49 percent less likely to be incarcerated in the US than were US-born Americans.35 These gaps compare favorably to the victimization rate gaps between immigrants and the US-born and are nearly identical to the victimization rate gaps for people previously known to the victim (63.5 percent and 49.1 percent). Immigrants are less likely to be victims of crimes and to end up in prison for the same reason: They are less likely to commit crimes.
Immigrant Victimization Rates by Type of Crime
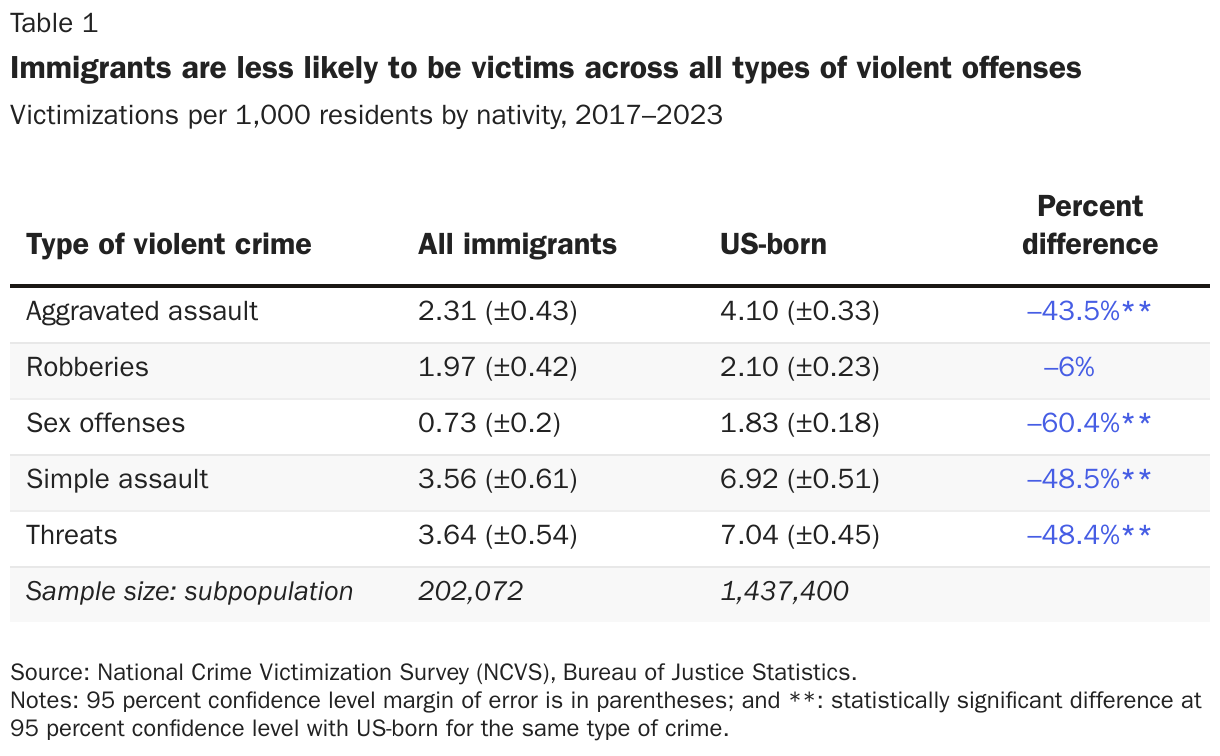
Breaking down victimization rates by type of crime bolsters the proposition that immigrant victimization is low because immigrant offending is low. To begin, the NCVS shows that immigrants were less likely than the US-born to be victims across all types of violent crimes—44 percent for aggravated assaults, 60 percent for violent sex offenses, 6 percent for robberies, 49 percent for simple assaults, and 48 percent for verbal threats (Table 1).36 This means that for four violent-crime categories, immigrants were about half as likely as the US-born to be victims of violent crimes. It also means that immigration lowers the violent-victimization rate in the US across a range of types of violent crime.
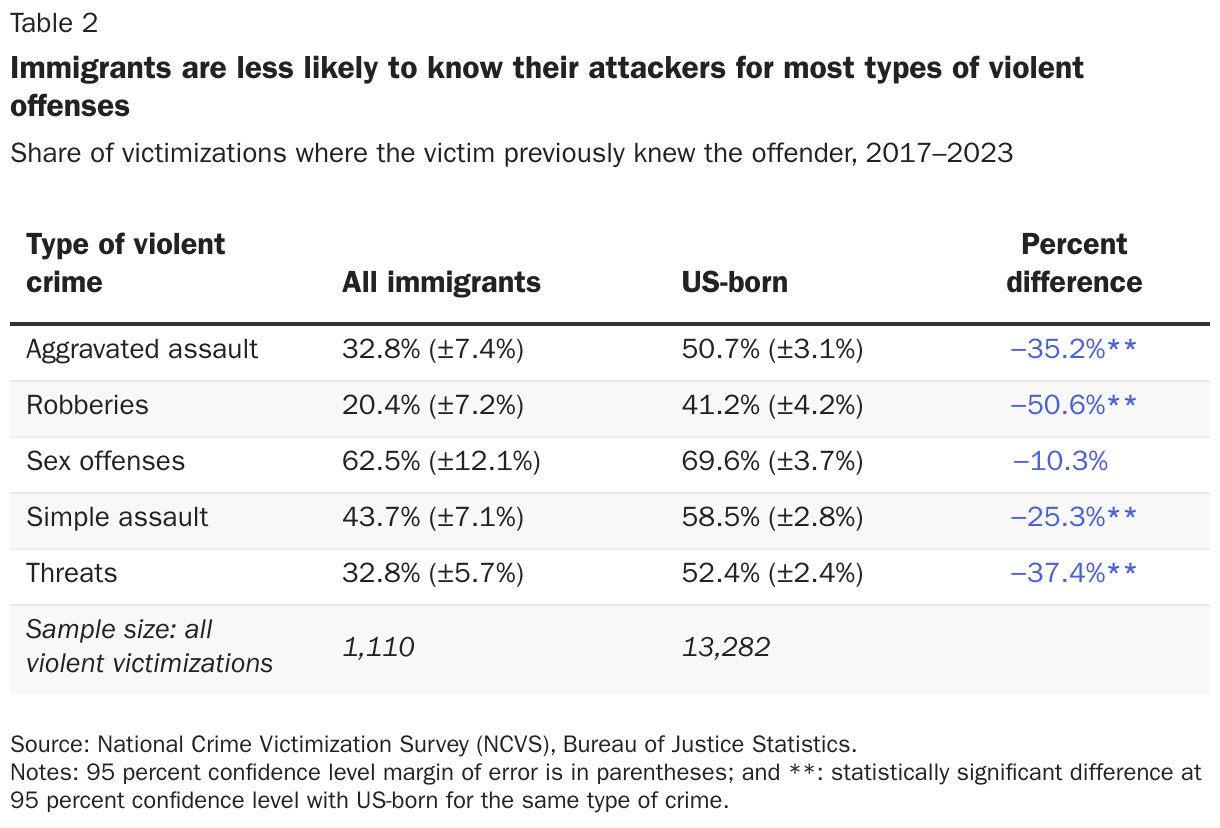
Although the immigrant–US-born victimization gap is very small for robberies, it is the exception that proves the rule, as robberies are the one violent offense most likely to be committed by someone outside a person’s social circle, especially for immigrants. From 2017 to 2023, immigrants were less likely than the US-born public to know their offender before the crime, across almost every type of violent crime (Table 2). For robberies, however, the difference is even more striking: Immigrants were half as likely to know their robber, and nearly four in five immigrant robbery victims said they did not know the perpetrator—by far the highest of any offense category.
This means that the rates of victimization by people previously known to the immigrant victim reveal even more extreme differences from the US-born population. From 2017 to 2023, immigrants were less likely to be victims of people they knew, across all types of crime (Figure 7). The immigrant victimization rates were 63 percent lower for aggravated assault, 65 percent lower for violent sex offenses, 61 percent lower for simple assaults, and 54 percent lower for robberies. People whom immigrants know are less likely to commit all types of violence against immigrants—and presumably against other people too.
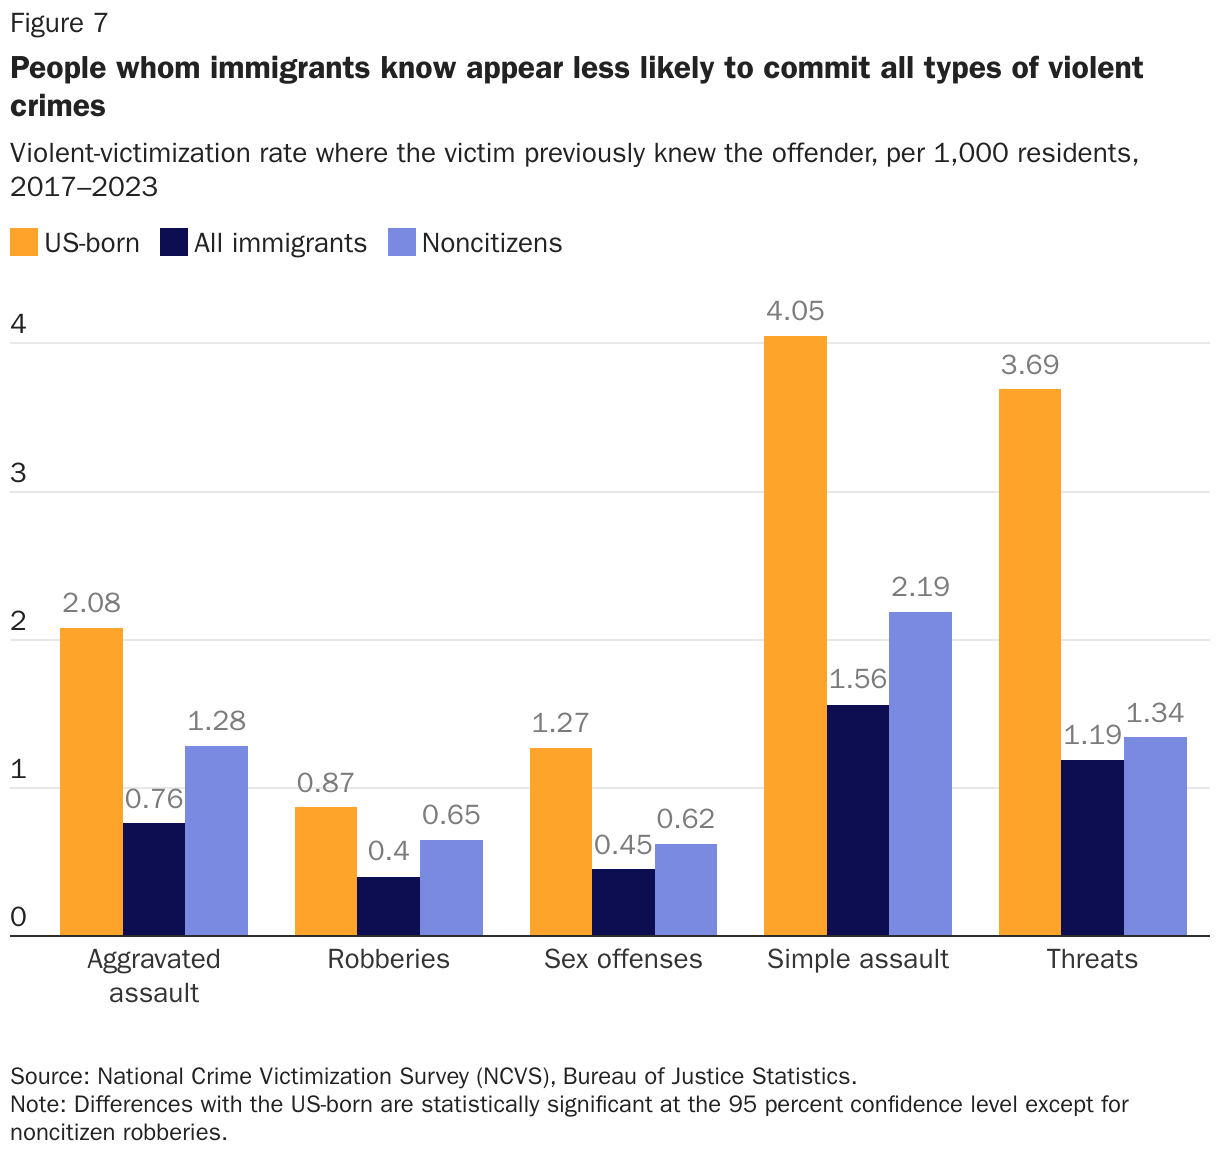
Notably, the immigrant–US-born gap in robbery victimization rates not only reemerges when focusing on victimizations by people whom the victim knows, it also reaches the same level as any other type of violent crime. This further supports the idea that the low victimization rate is directly related to the people in immigrants’ lives—mainly other immigrants—offending less.
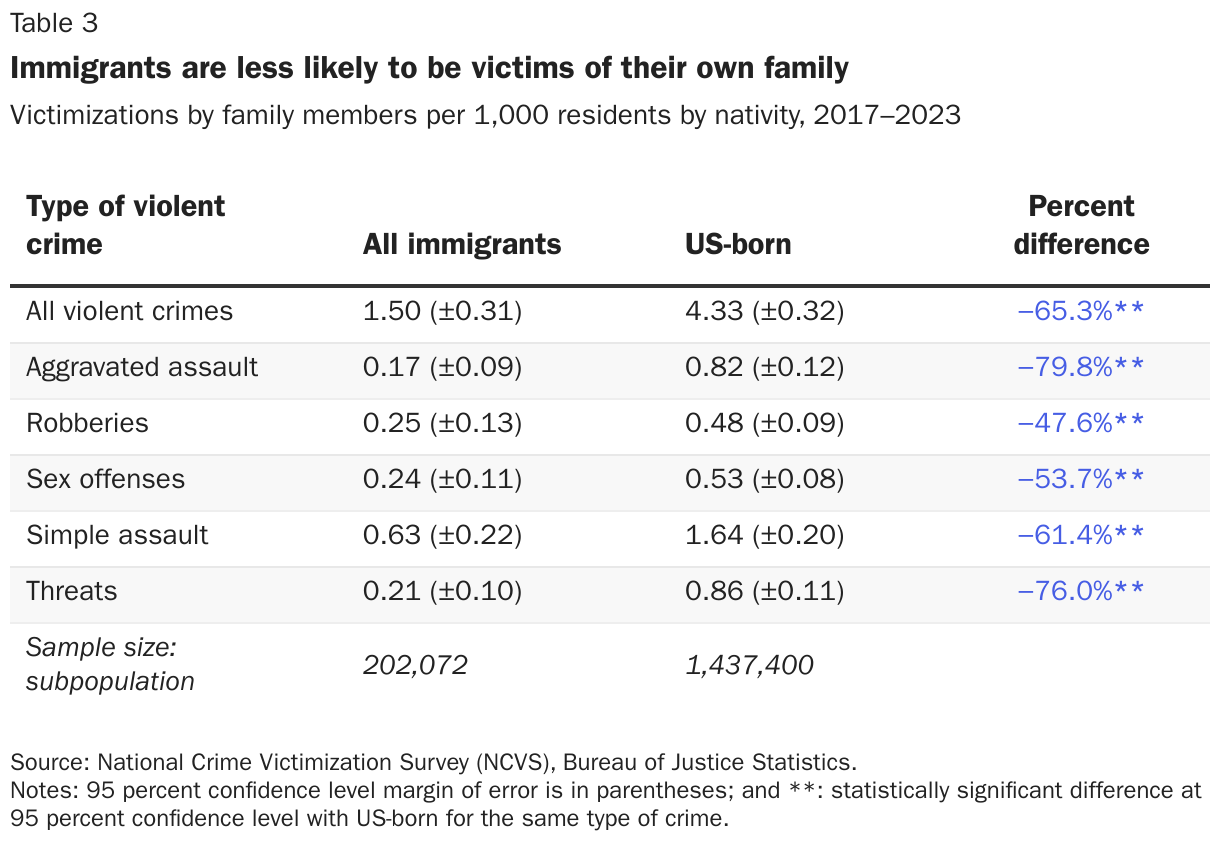
Immigrants are also much less likely to be victimized by their family members, across all types of crime. They were 80 percent less likely to be a victim of an aggravated assault committed by a relative, 48 percent less likely for robberies, 54 percent for violent sexual offenses, 62 percent for simple assaults, and 76 percent for threats (Table 3). Since the relatives of immigrants are usually immigrants themselves, this reinforces the conclusion that immigrants reduce the rate of nearly all types of violent crime.
Immigrants experience much less violence in their lives. When they do experience violence, it is less likely to be committed by people they know in their community—relatives, friends, neighbors, coworkers, teachers, schoolmates, roommates, and so on. Since immigrants usually live with and near one another, and most violent victimizations happen near the victim’s home, immigrants’ lower victimization rates support the idea that immigrants have lower rates of violent offending and reduce their neighborhoods’ crime rates. This conclusion supports the extensive academic literature that finds that immigrants are less prone to violence than the US-born population.
Immigrant Victimization Rates by Period
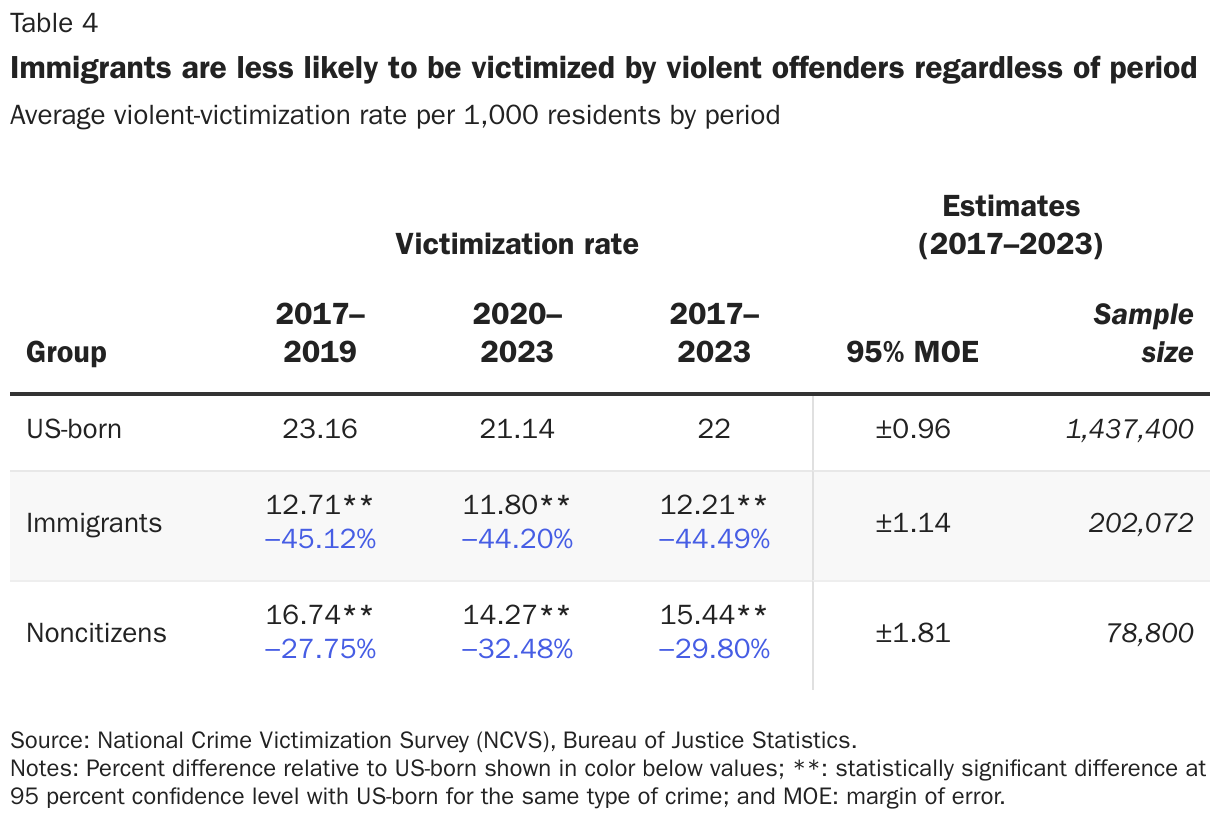
The NCVS also helps refute the concern that there may have been a change in the results since the COVID-19 pandemic, when there was a brief increase in nonfatal violent crime. Individual years’ sample sizes are so diminished that we must pool multiple years. Table 4 uses two periods: 2017 to 2019 (“pre-pandemic”) and 2020 to 2023 (“post-pandemic”). The NCVS shows that the US-born–immigrant violent-victimization gap remained statistically similar post-pandemic. The noncitizen violent-victimization rate fell somewhat lower from 2020 to 2023 than from 2017 to 2019 relative to the US-born rate.
Some criminologists believe that the NCVS undercounted victimizations for 2020 and 2021.37 Generally, the evidence for this is that the decline in violent victimizations recorded in the survey for those years is at odds with a modest rise in violent crime recorded by police departments in 2020.38 The difference in trend is usually attributed to the fact that the NCVS was forced to change its methods during 2020 and 2021 to accommodate COVID-19 pandemic precautions and survey participation dipped slightly.39
Moderating this concern is the fact that the NCVS records crimes estimated by the victims as having occurred as far back as six months prior. For instance, a crime committed in July 2020 but recorded in January 2021 would count toward the 2021 survey, which may count crimes committed throughout the summer of 2020, so the annual trends can never precisely match the FBI trends. In any case, any potential underreporting for 2020 or 2021 would have a small effect on our results.40 The FBI’s average reported violent-crime rate was barely higher for the entire 2020–2023 period (0.4 percent) than for 2017–2019. In comparison, the NCVS shows a small 3 percent drop for violent crimes (other than simple assault, which the FBI excludes).41
More important, our interest is not in the absolute levels but in the relative difference in rates between immigrant and US-born victims. There is no evidence that underreporting biased the results for those years in favor of lower immigrant victimization, and the results for 2017 to 2019 are compatible with those from 2020 to 2023. Again, areas with more immigrants are no less likely to participate in the NCVS.42 Overall, the NCVS consistently shows, regardless of the period, that immigrants are much less likely to become victims of violent crimes.
Because immigrants lower the violent-victimization rate in the US, they are likely also reducing victimizations of US-born Americans. This is because some portion of US-born offenders will offend against immigrants at higher rates than immigrants will offend against the US-born, redirecting US-born criminals away from US-born victims. For instance, immigrants end up being robbed at nearly the average rate, but the robbers appear to be disproportionately US-born, so US-born robbers who might seek US-born victims might go after peaceful immigrants instead. In July 2023, for example, a group of US-born teenagers looking to steal a car in the District of Columbia shot and killed Nasrat Ahmadyar, an Afghan immigrant.43 If Ahmadyar had not been there, they likely would have victimized someone else.
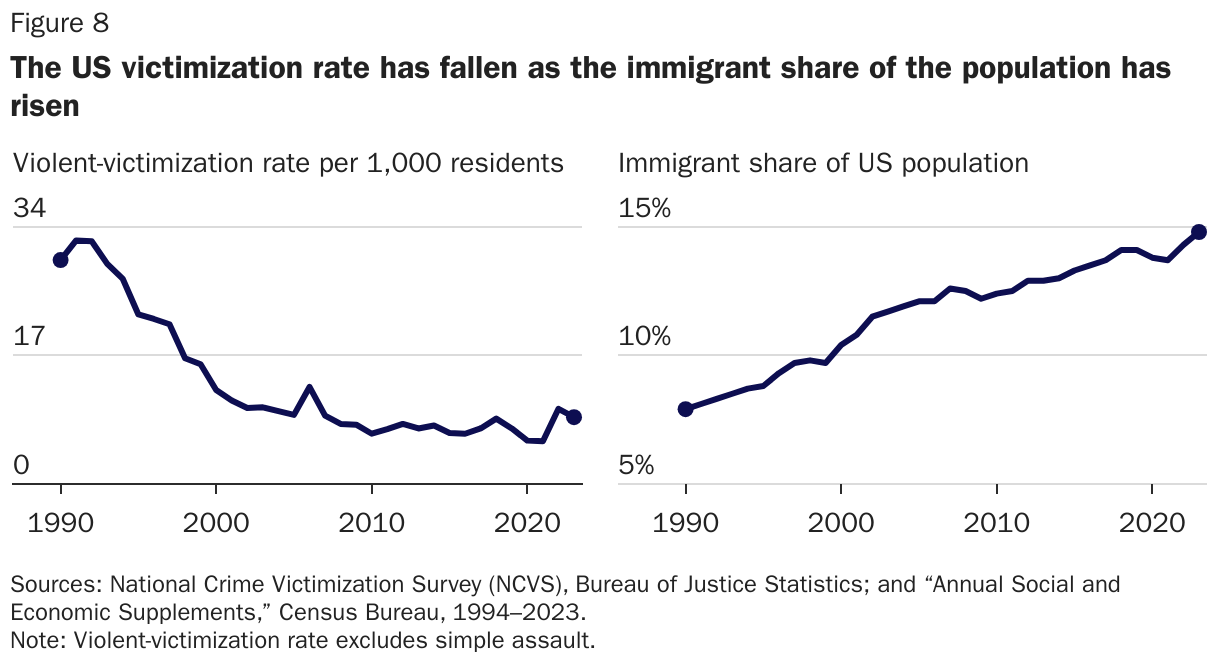
Given these facts, it shouldn’t be surprising that as the immigrant share of the US population has risen, the US victimization rate has fallen nearly 70 percent (Figure 8). Although immigration is not primarily responsible for the decline in crime, previous research has established that higher immigration did help lower crime rates further by changing the composition of the population to be less prone to crime.44 Our research complements this work by demonstrating that immigrants directly lower the violent-victimization rate in the US.
Immigrant Reporting Rates
Another way in which immigrants could influence the crime rate is by reporting or refusing to report crimes to police—either bringing criminals to justice or allowing them to escape. A Pew Research Center poll of Hispanics showed that at least as of 2008, Hispanic immigrants were not less willing than US-born Hispanics to report a hypothetical violent crime to the police, with nearly 80 percent saying they would “definitely” report a violent crime.45 Therefore, immigrants may not be opposed to reporting crimes, at least in theory.
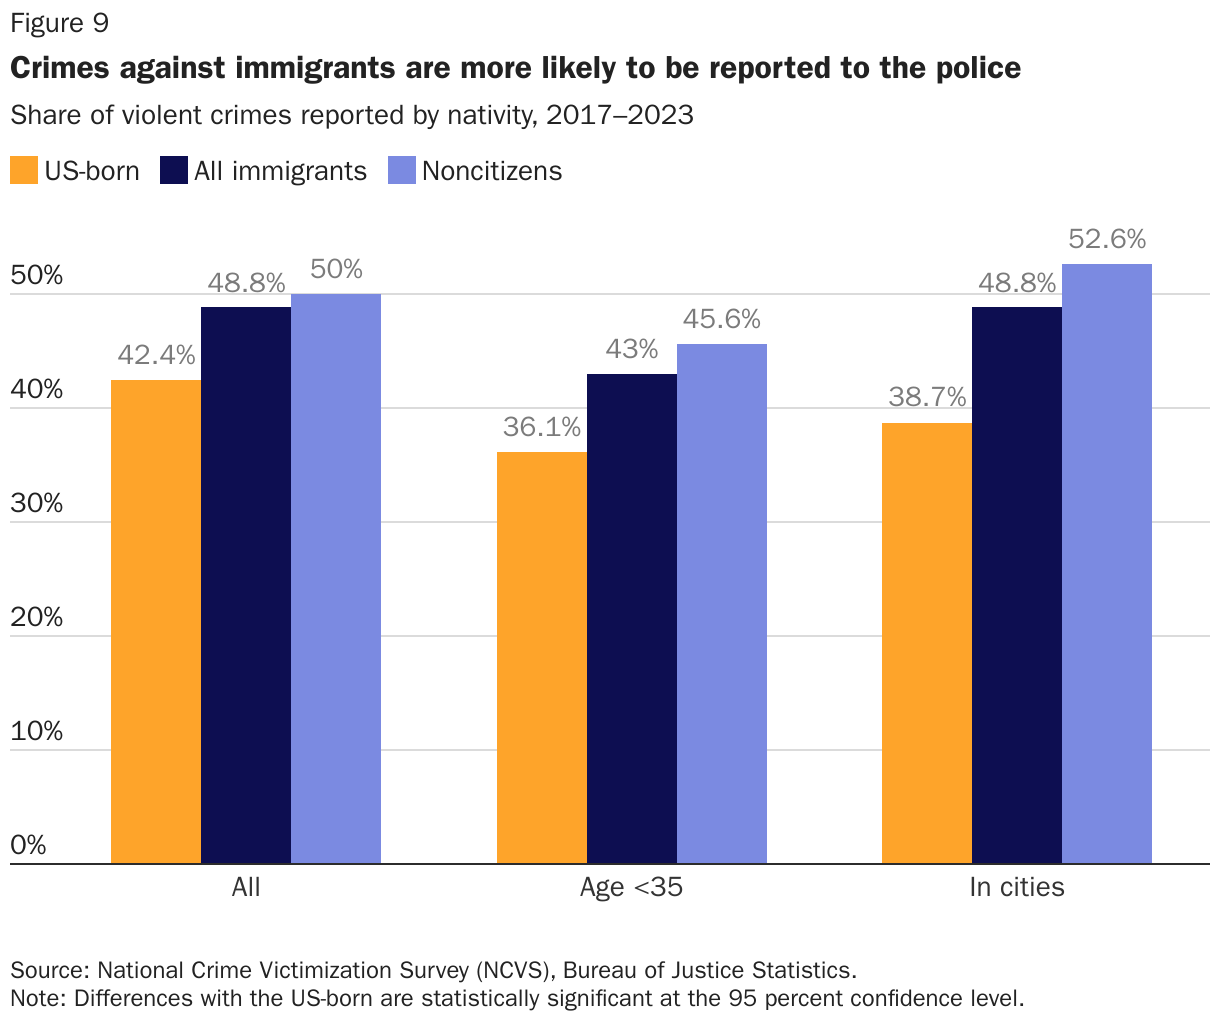
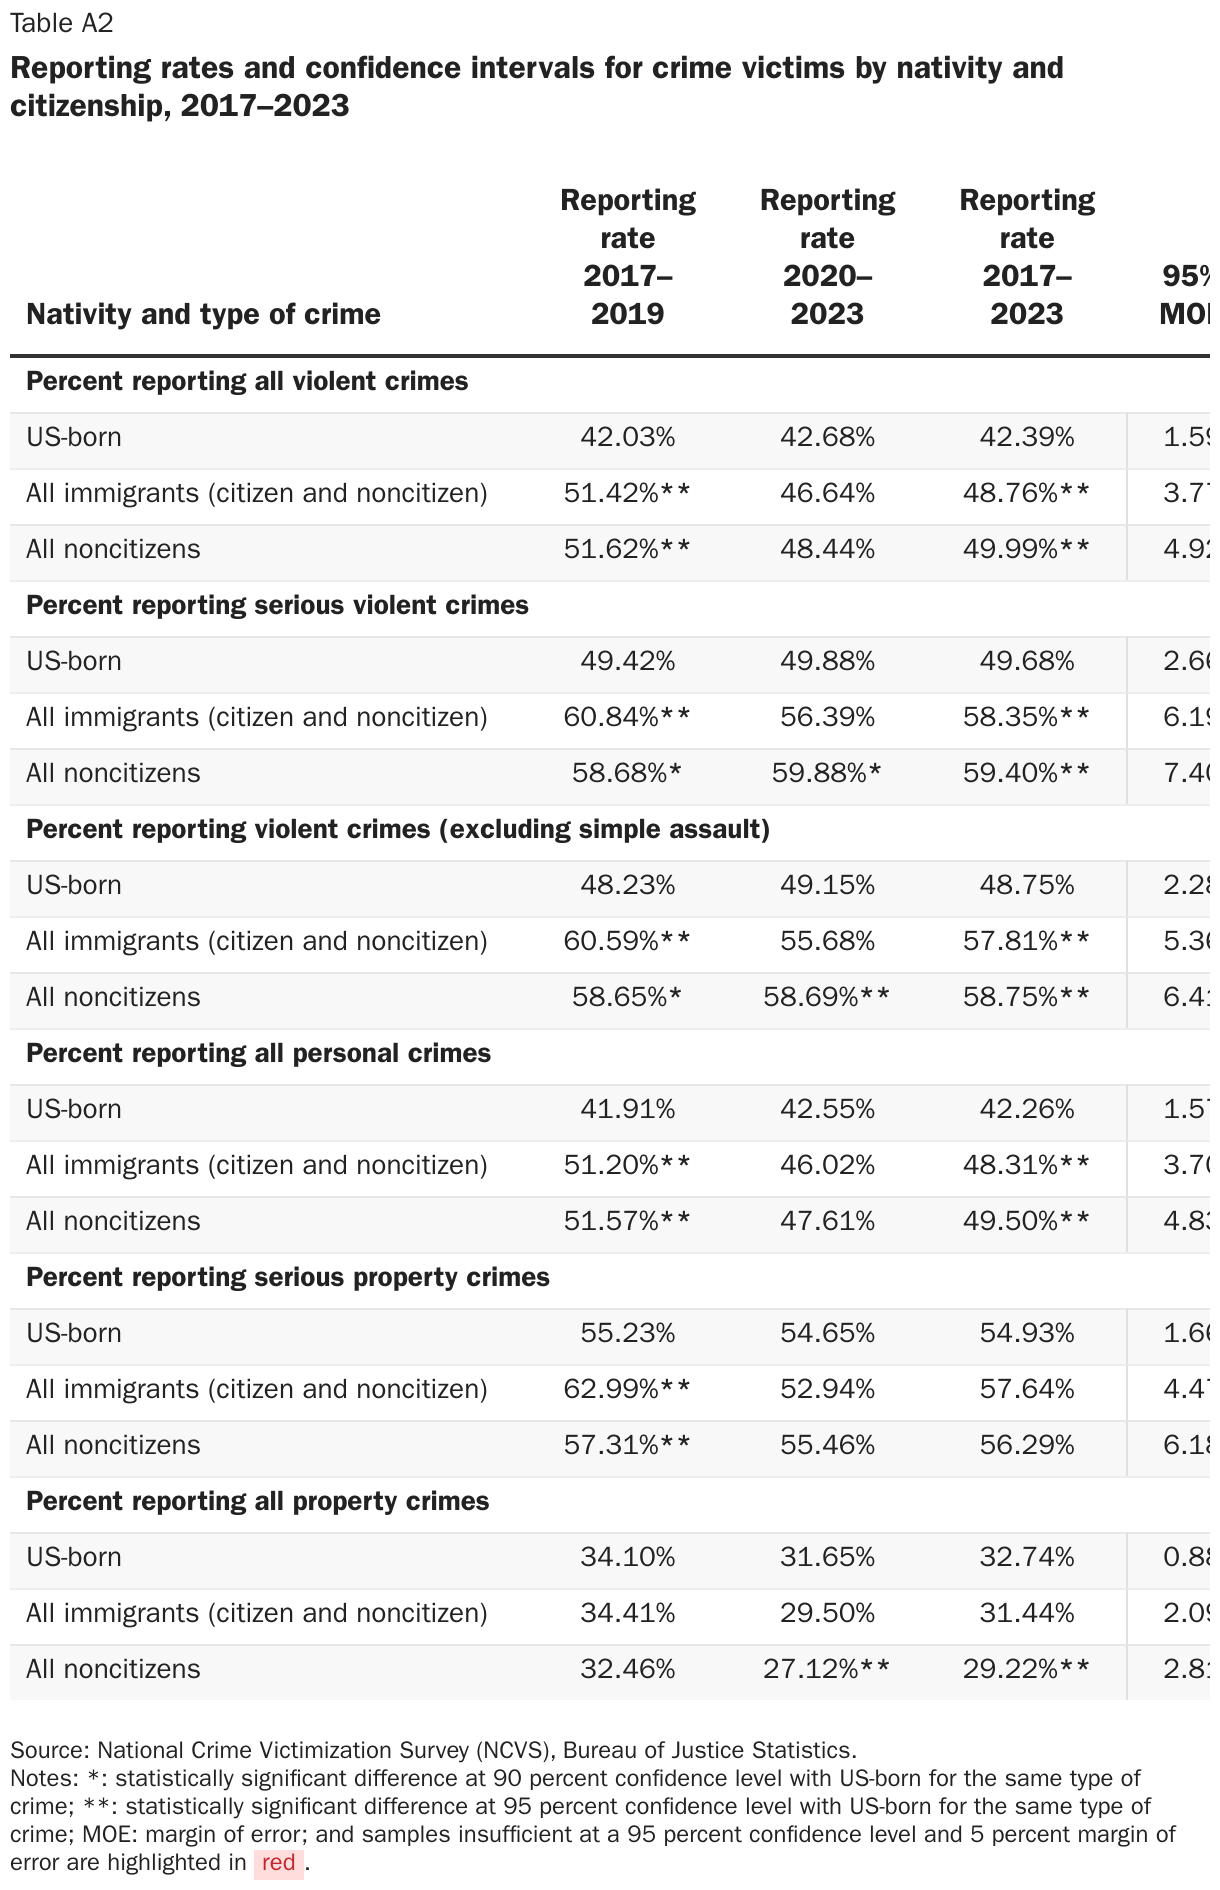
In practice, the NCVS indicates that crimes are reported less frequently than the Pew survey indicates, but violent crimes against immigrants are still 15 percent more likely to be reported to the authorities than crimes against the US-born. From 2017 to 2023, immigrants reported violent crimes to the police 49 percent of the time, compared to 42 percent for the US-born (Figure 9). The gap in reporting is essentially the same among young people; in cities, it rises to over 10 percentage points higher. Violent crimes against noncitizens—both legal and illegal immigrants without US citizenship—were reported at similar rates as those against immigrants generally from 2017 to 2023. Crimes against noncitizens were reported 18 percent more frequently than crimes against the US-born.
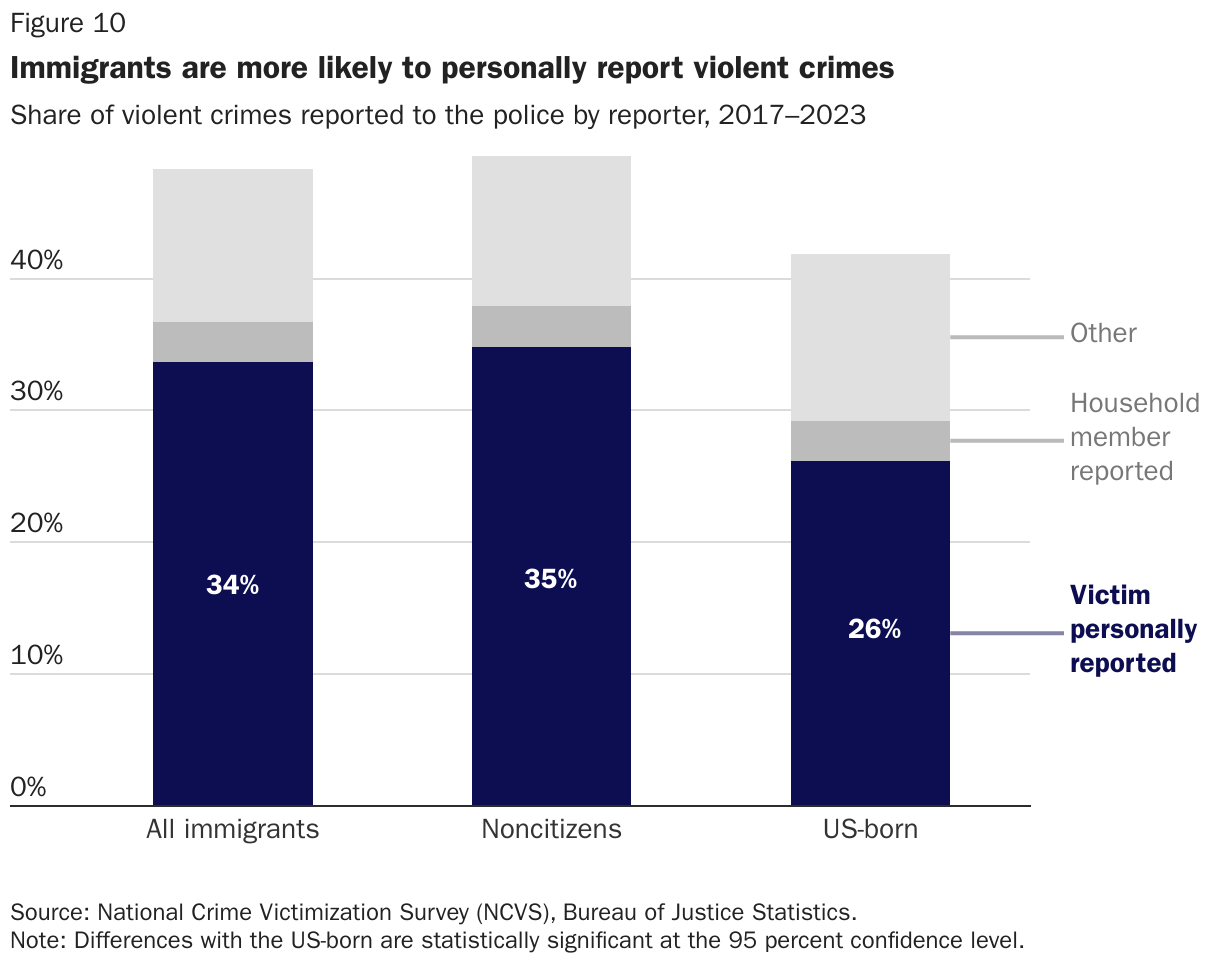
The NCVS also asks respondents if they personally reported the crime. Other options were that a household member or others, such as guards, apartment managers, or school officials, reported the crime, or that the police were present when the crime happened. From 2017 to 2023, US-born victims personally reported violent crimes 26.2 percent of the time (Figure 10). All immigrants personally reported 34 percent of the time, and noncitizens personally reported 35 percent of the time. Thus, immigrants were 29 percent more likely, and noncitizens were 32 percent more likely, to personally report crime compared to the US-born population.
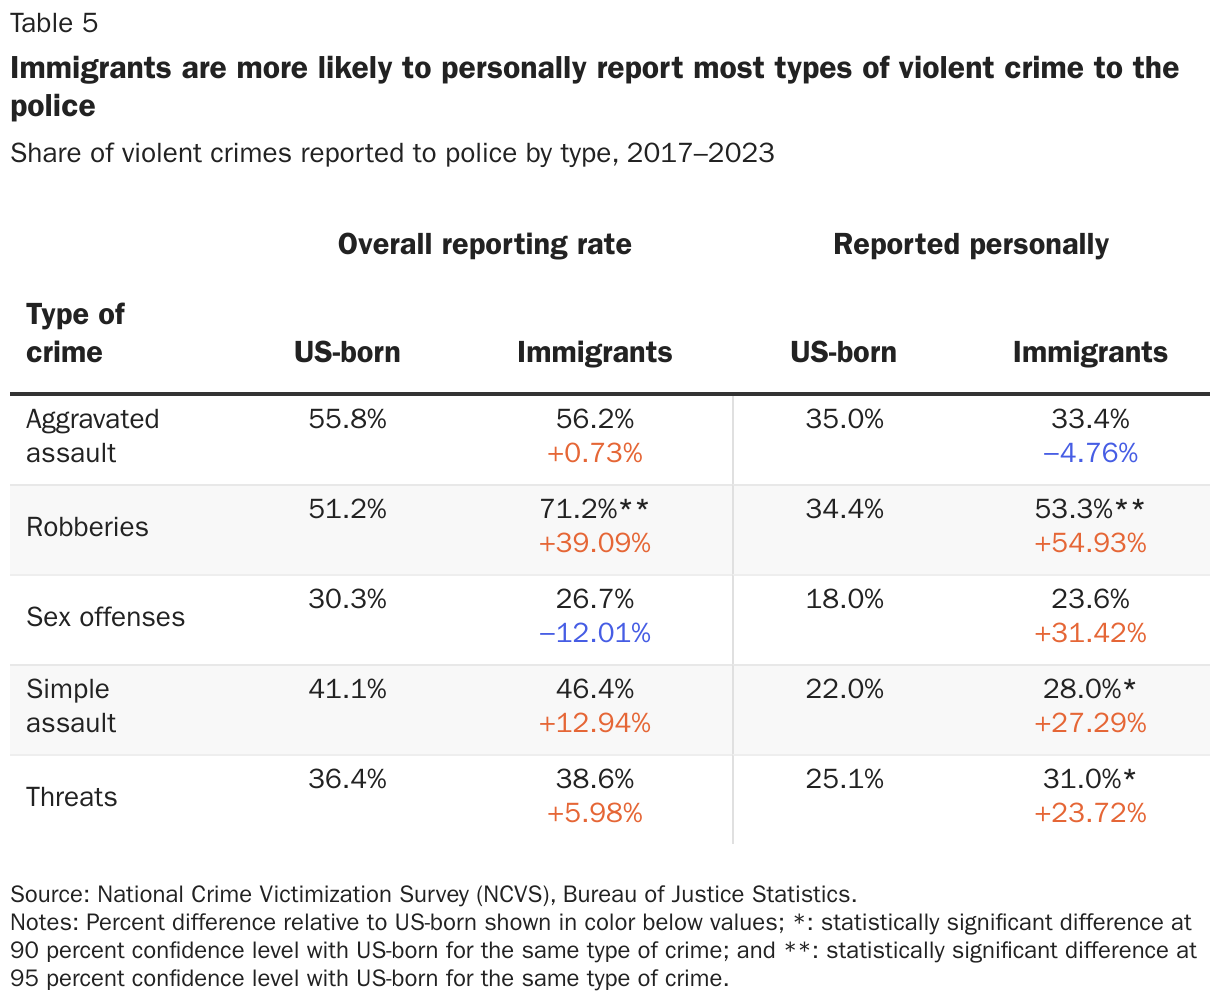
Sex offenses, threats, and aggravated assaults against immigrants were just as likely to be reported as those against the US-born (Table 5). Simple assaults and robberies are more likely to be reported if they were committed against immigrants than against US-born victims. However, immigrants are more likely to personally report crimes for all types of violent crimes except for aggravated assaults.
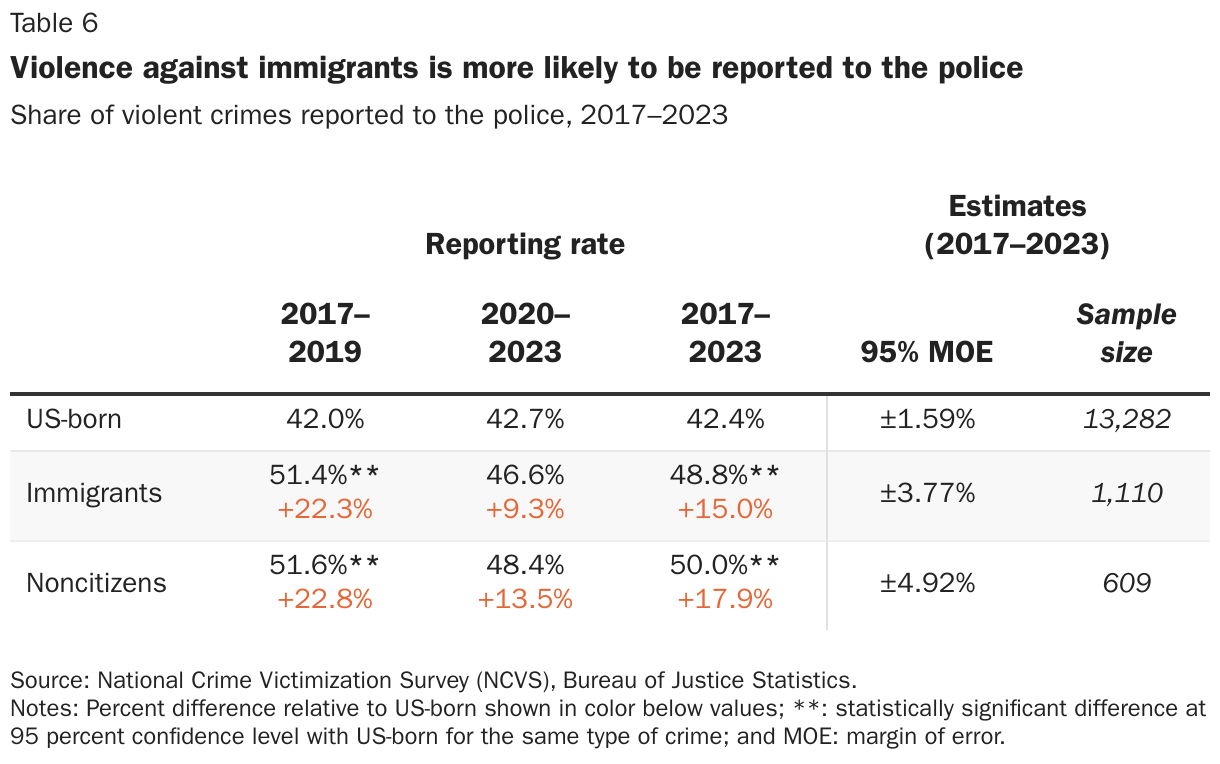
Immigrants have become somewhat less likely to report crimes in recent years (Table 6). This may reflect a compositional shift within the immigrant population, as recent immigration has increased, and new arrivals may be less likely to report crimes than more established immigrants.46 However, from 2020 to 2023, violent crimes against noncitizens as a group were still more than 13 percent more likely to be reported than crimes against the US-born.
Although the high rate of immigrant crime reporting defies conventional wisdom, it may ultimately relate to immigrants’ unwillingness to commit crimes. It could also reflect their higher confidence in US police and courts compared to those in their home countries.47 It may also be a recent shift. Immigrants’ reputation for low crime reporting also developed in a different context.48 Since 1997, police departments have doubled the share of Hispanic officers, lowering cultural and linguistic barriers to reporting.49 As of 2023, most major cities had also adopted policies clarifying and limiting when they will cooperate with immigration enforcement, policies that have been associated with increased reporting of violent crimes.50
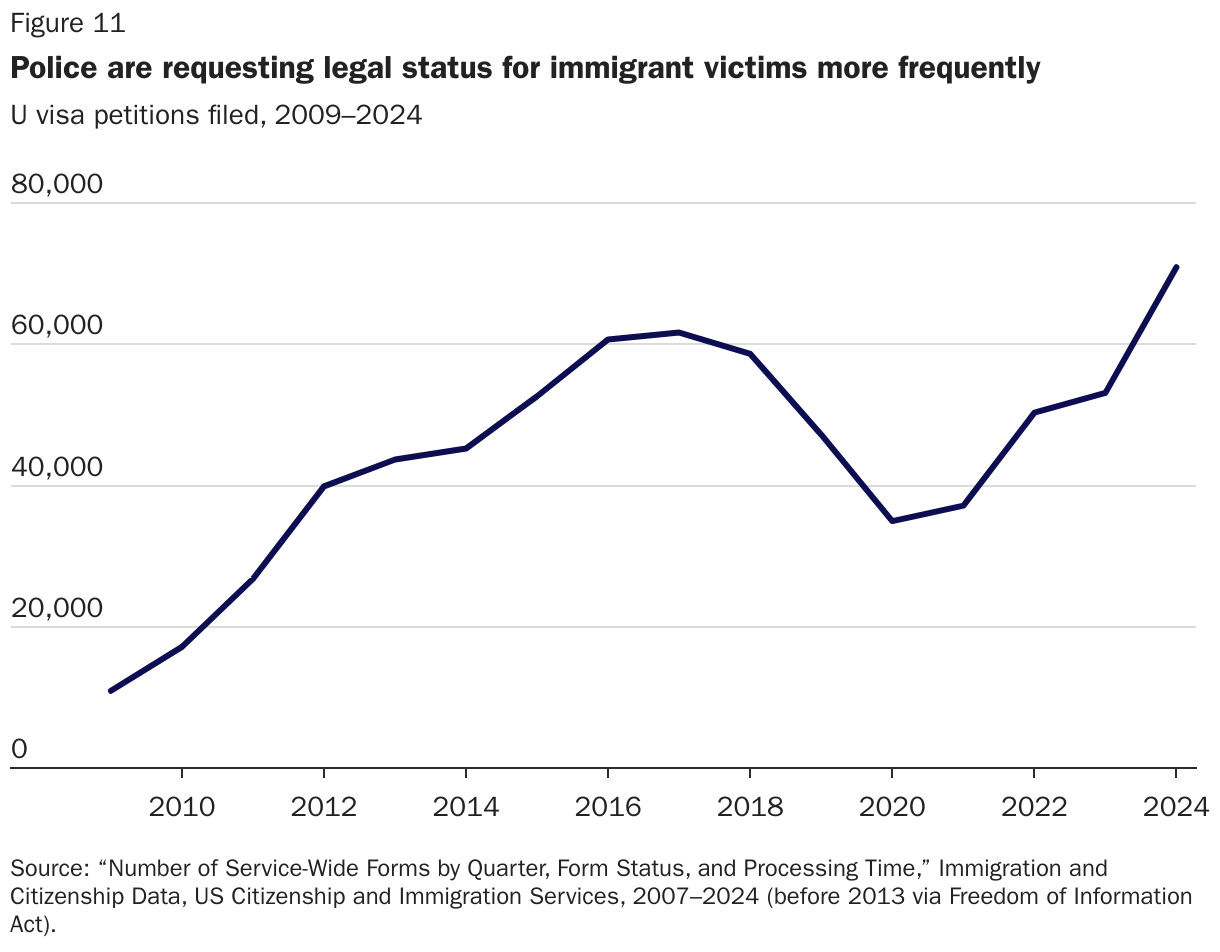
In 2000, Congress created the U visa, which grants legal status to immigrants who work with law enforcement to solve crimes.51 Since implementing regulations were created in 2008, police departments have requested U visas for nearly 600,000 immigrant crime victims, offering a powerful incentive to work with law enforcement (Figure 11).52 In 2012, the Department of Homeland Security established the Deferred Action for Childhood Arrivals (DACA) program, which provided temporary lawful presence to more than 800,000 younger illegal immigrants; some research suggests this increased crime reporting from 2012 to 2016.53
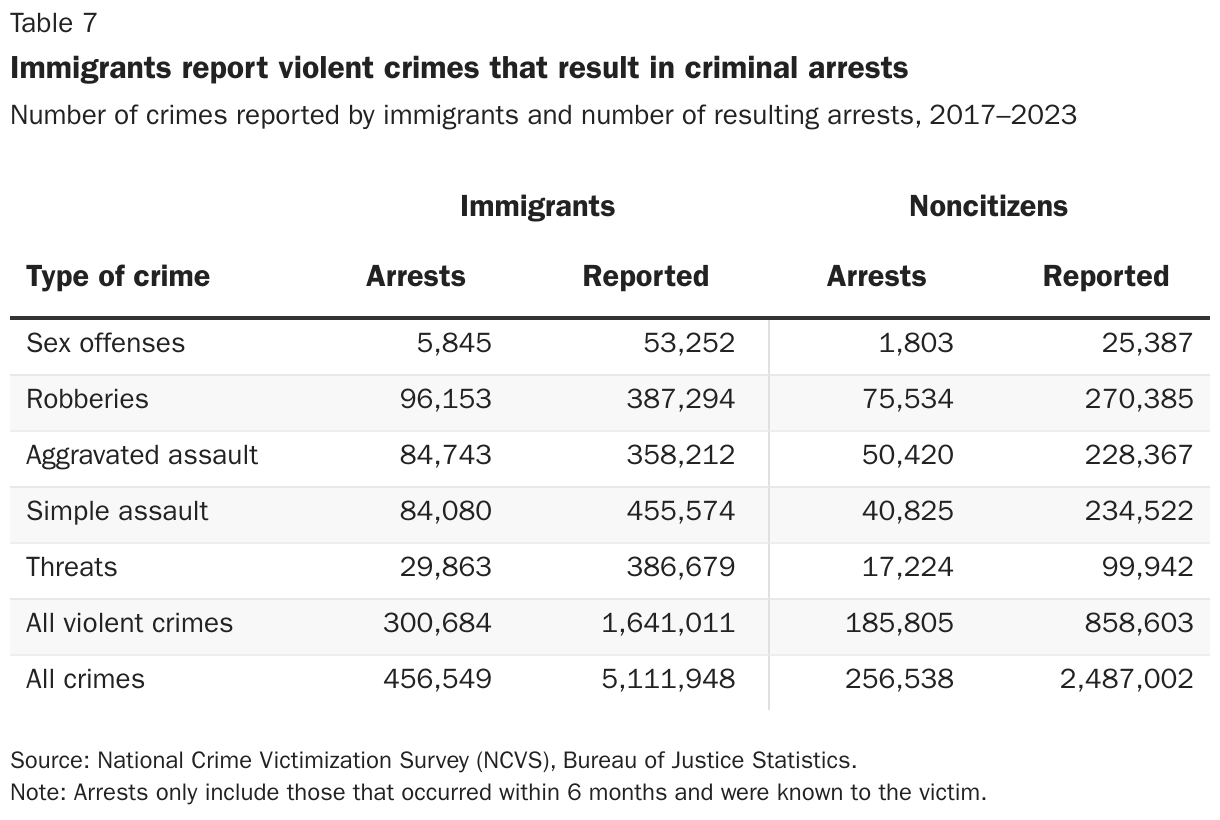
The fact that immigrants report crimes more frequently suggests that they provide an additional public safety benefit beyond merely committing fewer crimes: helping bring offenders to justice. From 2017 to 2023, 5.1 million crimes against immigrants were reported to police, including about 1.6 million violent crimes (Table 7). These immigrant collaborations with police resulted in 457,000 arrests, including about 300,000 arrests for violent crimes. Noncitizen victims collaborated with police on 2.5 million crimes, resulting in about 257,000 arrests.
These were arrests that occurred only in the six months prior to the NCVS interview for crimes in which the victim learned of the arrest, so they likely understate the true number of arrests significantly. Arrests known to the victim as a share of all reported crimes is only about one-third of the violent-crime clearance rate (defined as total arrests divided by reported crimes) reported by the FBI.54 Even when arrests did not occur, evidence suggests that police investigations may reduce crime by increasing the criminals’ perceived risk of apprehension and prosecution.55 By itself, reporting is associated with fewer repeat domestic violence victimizations.56 Reporting may also lead to deportation of immigrant offenders.
Immigrants have played an important role in the US in preventing crimes from reoccurring, which can itself bring down crime rates.57 Immigrants are more likely to start businesses, which may help contribute to a sense that they have a personal stake in cooperation.58 Consider the example of Paterson, New Jersey, which has a 45 percent immigrant share of its total population.59 The police commissioner, Jerry Speziale, attributed South Paterson’s falling crime rate to immigrant business owners’ reporting of crimes. “For as long as I’ve been in law enforcement in this area, it’s always been a group that’s been very willing to work with us,” he told the Los Angeles Times in 2019. “They care about the businesses in the area and have always worked hard to make sure the area thrives.”60
Immigrant Concerns About Crime Reporting
The fact that immigrants are generally more likely to report violent crimes does not necessarily contradict the notion that they would be even more likely to cooperate with the police in investigations if federal or local governments had different immigration policies. Although the NCVS does not directly ask about fear of deportation, some smaller surveys indicate that immigration status can affect willingness to report crime.61 One line of research suggests that policies limiting the likelihood of a noncitizen’s deportation—such as pathways to legalization—might further increase noncitizen crime reporting and decrease crime.62
This evidence suggests that immigrant crime reporting might fall in response to the Trump administration’s mass deportation efforts. Although the media has publicized several cases where crime victims were targeted directly after reporting crimes, these were anomalous before 2025.63 The administration has implemented arrangements with police in several states that permit the arrest and transfer of crime victims.64 Texas law enforcement has actually reported multiple immigrant victims—only for the federal government to decline to arrest them for logistical reasons.65 But in other cases, local police reporting has led to arrests of immigrants in 2025.66
The federal government has also added the names of people with deportation orders to a database usually reserved for criminal fugitives, confusing the local police about the nature of the person’s offense.67 A January 2025 memorandum from the acting director of ICE states that its agents are not “required to look for indicia or evidence suggesting an alien was a victim of crime (e.g., being the beneficiary of an order of protection) and consider such information as a positive discretionary factor in determining whether to take civil immigration enforcement action.”68
One small survey in 2025 found that 76 percent of the attorneys or advocates for immigrant survivors of domestic abuse reported that their clients were concerned about calling the police.69 About 41 percent of immigrants feared they or a family member would be detained or deported in April 2025, which was before the biggest increase in enforcement in 2025.70 Whether this changing climate will reduce immigrant crime reporting is too soon to say, but it unnecessarily jeopardizes it.
Conclusion
As immigration increases, people are understandably concerned about how newcomers will affect public safety in their communities. The National Crime Victimization Survey shows that immigrants were nearly half as likely to become victims of violent crimes from 2017 to 2023. When they were victims of violent crimes, they were much less likely to be victimized by people they knew in their community or by their relatives. Given that criminals tend to disproportionately victimize their own communities, neighbors, and family members, these data suggest that immigration is not contributing to an increase in the crime rate in the US.
Immigrants also cooperate with law enforcement to stop and solve violent crimes at higher rates than the US-born population. Between 2017 and 2023, violence against immigrants was 15 percent more likely to be reported to the police, and immigrants were 29 percent more likely than a US-born person to personally report a violent crime to the police. Additionally, noncitizens were 32 percent more likely to report violent crimes. They reported over 5 million crimes from 2017 to 2023, which resulted in half a million arrests. Immigrants could be even more likely to report crimes and work with law enforcement if they had protection against deportation.
The fact that immigrants in the NCVS are more likely to report crimes to the police rebuts concerns that reported crime rates are biased in favor of immigrants. Since analyses that rely on reported crime have consistently shown that immigrants are less likely to be arrested, convicted, and incarcerated for offenses in the United States, we can be even more confident in our conclusion that immigrants have a beneficial effect on crime in the United States. The NCVS shows that immigrants play a vital role in protecting American communities from violence.
Appendix
Citation
Bier, David J., and Julián Salazar. “Immigrants Cut Victimization Rates, Boost Crime Reporting,” Policy Analysis no. 1003, Cato Institute, Washington, DC, August 26, 2025.

About the Authors


This work is licensed under a Creative Commons Attribution-NonCommercial-ShareAlike 4.0 International License.