You Ought to Have a Look is a feature from the Center for the Study of Science posted by Patrick J. Michaels and Paul C. (“Chip”) Knappenberger. While this section will feature all of the areas of interest that we are emphasizing, the prominence of the climate issue is driving a tremendous amount of web traffic. Here we post a few of the best in recent days, along with our color commentary.
—
As Pope Francis, this week, focused on examining the moral issues of climate change (and largely ignoring the bigger moral issues that accompany fossil fuel restrictions), he pretty much took as a given that climate change is “a scientific reality” that requires “decisive mitigation.” Concurrently, unfolding scientific events during the week were revealing a different story.
First and foremost, Roy Spencer, John Christy and William Braswell of the University of Alabama-Huntsville (UAH)—developers and curators of the original satellite-derived compilation of the temperature history of the earth’s atmosphere—released a new and improved version of their iconic data set. Bottom line: the temperature trend in the lower atmosphere from the start of the data (1979) through the present came in as 0.114°C/decade (compared with 0.14°C in the previous data version). The new warming trend is less than half what climate models run with increasing atmospheric carbon dioxide emissions project to have occurred.
While the discrepancy between real world observations and climate model projections of temperature rise in the lower atmosphere has been recognized for a number of years, the question has remained as to whether the “problem” lies within the climate models or the observations. With this new data release, the trend in the UAH data now matches very closely with the trend through an independent compilation of the satellite-temperature observations maintained by a team of researchers at Remote Sensing Systems (RSS). The convergence of the observed data sets is an indication the climate models are the odd man out.
As with most long-term, real-world observations, the data are covered in warts. The challenge posed to Spencer et al. was how to splice together remotely sensed data collected from a variety of instruments carried aboard a variety of satellites in unstable orbits—and produce a product robust enough for use in climate studies. The details as to how they did it are explained as clearly as possible in this post over at Spencer’s website (although still quite a technical post). The post provides good insight as to why raw data sets need to be “adjusted”—a lesson that should be kept in mind when considering the surface temperature compilations as well. In most cases, using raw data “as is” is an inherently improper thing to do, and the types of adjustments that are applied may vary based upon the objective.
Here is a summary of the new data set and what was involved in producing it:
Version 6 of the UAH MSU/AMSU global satellite temperature data set is by far the most extensive revision of the procedures and computer code we have ever produced in over 25 years of global temperature monitoring. The two most significant changes from an end-user perspective are (1) a decrease in the global-average lower tropospheric (LT) temperature trend from +0.140 C/decade to +0.114 C/decade (Dec. ’78 through Mar. ’15); and (2) the geographic distribution of the LT trends, including higher spatial resolution. We describe the major changes in processing strategy, including a new method for monthly gridpoint averaging; a new multi-channel (rather than multi-angle) method for computing the lower tropospheric (LT) temperature product; and a new empirical method for diurnal drift correction… The 0.026 C/decade reduction in the global LT trend is due to lesser sensitivity of the new LT to land surface skin temperature (est. 0.010 C/decade), with the remainder of the reduction (0.016 C/decade) due to the new diurnal drift adjustment, the more robust method of LT calculation, and other changes in processing procedures.
Figure 1 shows a comparison of the data using the new procedures with that derived from the old procedures. Notice that in the new dataset, the temperature anomalies since about 2003 are less than those from the previous version. This has the overall effect of reducing the trend when computed over the entirety of the record.
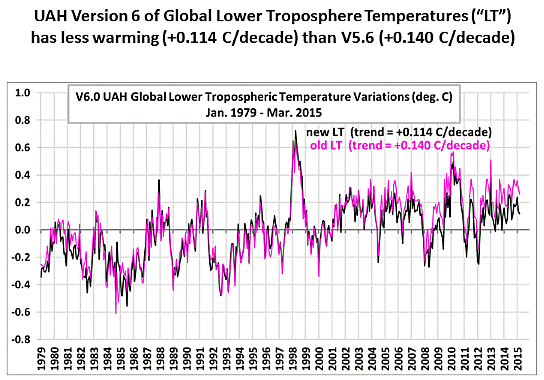
Figure 1. Monthly global-average temperature anomalies for the lower troposphere from Jan. 1979 through March 2015 for both the old and new versions of LT. (Source: www.drroyspencer.com)
While this new version, admittedly, is not perfect, Spencer, Christy, and Braswell see it as an improvement over the old version. Note that this is not the official release, but rather a version the authors have released for researchers to examine and see if they can find anything that looks irregular that may raise questions as to the procedures employed. Spencer et al. expect a scientific paper on the new data version to be published sometime in 2016.
But unless something major comes up, the new satellite data are further evidence the earth is not warming as expected. That means that, before rushing into “moral obligations” to attempt to alter the climate’s future course by restricting energy production, we perhaps ought to spend more time trying to better understand what it is we should be expecting in the first place.
One of the things we are told by the more alarmist crowd that we should expect from our fossil fuel burning is a large and rapid sea level rise, primarily a result of a melting of the ice sheets that rest atop Greenland and Antarctica. All too frequently we see news stories telling tales of how the melting in these locations is “worse than we expected.” Some soothsayers even attack the United Nations’ Intergovernmental Panel on Climate Change (IPCC) for being too conservative (of all things) when it comes to projecting future sea level rise. While the IPCC projects a sea level rise of about 18–20 inches from its mid-range emissions scenario over the course of this century, a vocal minority clamor that the rise will be upwards of 3 feet and quite possibly (or probably) greater. All the while, the sea level rise over the past quarter-century has been about 3 inches.
But as recent observations do little to dissuade the hardcore believers, perhaps model results (which they are seemingly more comfortable with) will be more convincing.
A new study available this week in the journal Geophysical Research Letters is described by author Miren Vizcaino and colleagues as “a first step towards fully-coupled higher resolution simulations with more advanced physics”—basically, a detailed ice sheet model coupled with a global climate model.
They ran this model combination with the standard IPCC emissions scenarios to assess Greenland’s contribution to future sea level rise. Here’s what they found:
The [Greenland ice sheet] volume change at year 2100 with respect to year 2000 is equivalent to 27 mm (RCP 2.6), 34 mm (RCP 4.5) and 58 mm (RCP 8.5) of global mean SLR.
Translating millimeters (mm) into inches give this answer: a projected 21st century sea level rise of 1.1 in. (for the low emissions scenario; RCP 2.6), 1.3 in. (for the low/mid scenario; RCP 4.5), and 2.3 in (for the IPCC’s high-end emission scenario). Some disaster.
As with any study, the authors attach some caveats:
The study presented here must be regarded as a necessary first step towards more advanced coupling of ice sheet and climate models at higher resolution, for instance with improved surface-atmosphere coupling (e.g., explicit representation of snow albedo evolution), less simplified ice sheet flow dynamics, and the inclusion of ocean forcing to Greenland outlet glaciers.
Even if they are off by 3–4 times, Greenland ice loss doesn’t seem to be much of a threat. Seems like it’s time to close the book on this imagined scare scenario.
And while imagination runs wild when it comes to linking carbon dioxide emissions to calamitous climate changes and extreme weather events (or even war and earthquakes), imagination runs dry when it comes to explaining non-events (except when non-events string together to produce some sort of negative outcome [e.g., drought]).
Case in point, a new study looking into the record-long absence of major hurricane (category 3 or higher) strikes on the U.S. mainland—an absence that exceeds nine years (the last major hurricane to hit the U.S was Hurricane Wilma in late-October 2005). The authors of the study, Timothy Hall of NASA’s Goddard Institute for Space Studies and Kelly Hereid from ACE Tempest Reinsurance, concluded that while a streak this long is rare, their results suggest “there is nothing unusual underlying the current hurricane drought. There’s no extraordinary lack of hurricane activity.” Basically they concluded that it’s “a case of good luck” rather than “any shift in hurricane climate.”
That is all well and good, and almost certainly the case. Of course, the same was true a decade ago when the United States was hit by seven major hurricanes over the course of two hurricane seasons (2004 and 2005)—an occurrence that spawned several prominent papers and endless discussion pointing the finger squarely at anthropogenic climate change. And the same is true for every hurricane that hits the United States, although this doesn’t stop someone, somewhere, from speculating to the media that the storm’s occurrence was “consistent with” expectations from a changing climate.
What struck us as odd about the Hall and Hereid paper is the lack of speculation as to how the ongoing record “drought” of major hurricane landfalls in the United States could be tied in with anthropogenic climate change. You can rest assured—and history will confirm—that if we had been experiencing a record run of hurricane landfalls, researchers would be falling all over themselves to draw a connection to human-caused global warming.
But the lack of anything bad happening? No way anyone wants to suggest that is “consistent with” expectations. According to Hall and Hereid:
A hurricane-climate shift protecting the US during active years, even while ravaging nearby Caribbean nations, would require creativity to formulate. We conclude instead that the admittedly unusual 9‑year US Cat3+ landfall drought is a matter of luck. [emphasis added]
Right! A good string of weather is “a matter of luck” while bad weather is “consistent with” climate change.
It’s not like it’s very hard, or (despite the authors’ claim) it requires much “creativity” to come up with ways to construe a lack of major hurricane strikes on U.S. soil to be “consistent with” anthropogenic climate change. In fact, there are loads of material in the scientific literature that could be used to construct an argument that under global warming, the United States should experience fewer hurricane landfalls. For a rundown of them, see p. 30 of our comments on the government’s National Assessment on Climate Change, or check out our piece titled, “Global Savings: Billion-Dollar Weather Events Averted by Global Warming.”
It is not for lack of material, but rather, for lack of desire, that keeps folks from wanting to draw a potential link between human-caused climate change and good things occurring in the world.
References:
Hall, T., and K. Hereid. 2015. “The Frequency and Duration of US Hurricane Droughts.” Geophysical Research Letters, doi:10.1002/2015GL063652
Vizcaino, M. et al. 2015. “Coupled Simulations of Greenland Ice Sheet and Climate Change up to AD 2300.” Geophysical Research Letters, doi: 10.1002/2014GL061142
