“We are going to have an immigration system that works, but one that works for the American people,” Donald Trump told the Republican National Convention last week. “Decades of record immigration have produced lower wages and higher unemployment for our citizens.” But the candidate is wrong in two respects. First, the United States has not seen “record” immigration in recent years, and second, higher immigration is not associated with higher unemployment. Immigrants are heralds of growth, not portents of economic disaster.
Recent immigration is no record
The amount of immigration to the United States can be measured in two ways. The most obvious is the absolute number of people receiving permanent residency in the United States. By this measure, the peak year was 1991 with 1.8 million. Even by this measure, Trump is wrong. Rather than “decades of record immigration,” out of the top ten highest levels of all time, five occurred since 1990 and five before 1915.
But measuring immigration in terms of the absolute number of permanent residents is narrow and misleading. The biggest problem is that it implies that a million immigrants entering China, with a population of 1.4 billion, would have the same effect on employment as a million entering Estonia with a population of 1.2 million. Clearly, to understand the impact of immigration, you need to control for the size of the destination country.
Table 1: Top Ten Immigration Rates and Immigration Levels 1820 to 2014
| Year | Rate | Year | Number | ||
| 1 | 1854 | 1.61% | 1 | 1991 | 1,826,595 |
| 2 | 1850 | 1.59% | 2 | 1990 | 1,535,872 |
| 3 | 1851 | 1.58% | 3 | 1907 | 1,285,349 |
| 4 | 1882 | 1.50% | 4 | 2006 | 1,266,129 |
| 5 | 1852 | 1.49% | 5 | 1914 | 1,218,480 |
| 6 | 1907 | 1.48% | 6 | 1913 | 1,197,892 |
| 7 | 1853 | 1.43% | 7 | 2009 | 1,130,818 |
| 8 | 1849 | 1.31% | 8 | 2005 | 1,122,257 |
| 9 | 1881 | 1.30% | 9 | 2008 | 1,107,126 |
| 10 | 1906 | 1.29% | 10 | 1906 | 1,100,735 |
| Present | 2014 | 0.32% | Present | 2014 | 1,016,518 |
Source: Department of Homeland Security. “2014 Yearbook of Immigration Statistics.”
By this measure, that “record year” of 1990 comes in 52nd overall. Rather than decades of record immigration, we see decades of below average immigration. Indeed, per capita immigration during the current decade is almost 30 percent lower than the historical average, and five times less than the record rates in the 19th and 20th centuries.
Figure 1: Immigration Rates (1820 to 2014) and Unemployment Rates (1890 to 2014)

Sources: Immigration: Department of Homeland Security. “2014 Yearbook of Immigration Statistics.” Unemployment: Census Bureau. “Bicentennial Edition: Historical Statistics of the United States, Colonial Times to 1970.” p. 135 and Bureau of Labor Statistics via Federal Reserve Bank of St. Louis. “Fred Economic Data: Civil Unemployment Rate.”
Higher immigration is not associated with higher unemployment
The other obvious aspect of the above visual is that the years with higher immigration do not coincide with the years with highest unemployment.* In fact, the reverse is true. Unemployment is highest when immigration is lowest. During years when immigration was above the historical average, unemployment was 5.7 percent. During all other years, it was 7.2 percent, a difference of 1.5 percent. If you exclude years where unemployment dropped solely because of the draft, during the World Wars, the difference rises to 1.8 percent.
Figure 2: Unemployment During Years with Immigration Rates Above and Below the Average (1890–2014)
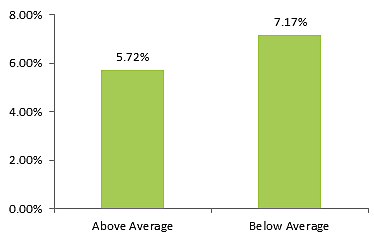
Sources: See figure 1.
This relationship is statistically significant, but its magnitude is obscured by non-market phenomena, such as the draft as well as immigration quotas that interfere with market forces. If we confine our focus to the pre-World War I period, we can see a much higher degree of coincidence between low unemployment and high immigration.
Figure 3: Immigration and Unemployment Rates (1890 to 1915)
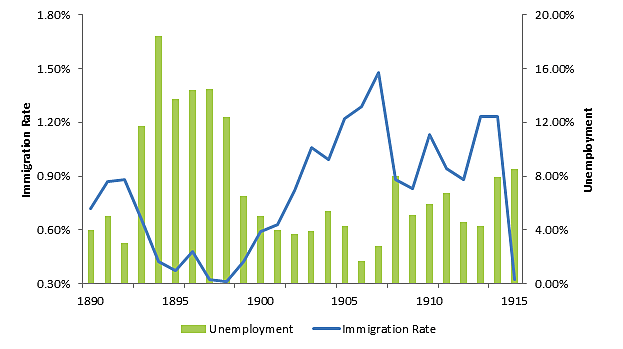
Sources: See figure 1.
The years in which the immigration rate exceeded the average for the period had an unemployment rate 5.5 percent lower than those below the average. The magnitude of the relationship is also quite large: roughly 20 percent of the variability in the immigration rate can be explained by the unemployment rate alone over this period.
The relationship becomes much stronger when you focus on economic migrants only. I’ve previously noted this phenomenon in H‑1B temporary work visa applications. When unemployment is high in the top H‑1B fields, employers submit dramatically fewer applications. Companies hire foreign workers when they are making general increases in employment, not when they are laying off workers.
To be clear, immigrants are not causing the unemployment rate to move up or down. The economic literature on this point is quite unambiguous: immigrants cause essentially no effect on the unemployment rate one way or another. Rather, the causation is the other direction. Immigrants come during periods of economic growth when companies are hiring new workers, both immigrants and natives.
Trump is mistaken to associate unemployment with immigrants. They are a sign of good times, not bad.
*Unemployment did not begin in 1890, but that is the first year in which comparable numbers are available. Note that pre-1948 numbers refer to individuals over the age of 14, all others over 16
