Harvey. Irma. Maria. Michael. Four strong (category 3 or higher) hurricanes in 14 months. Something is happening, right?
When category 4 hurricane Harvey banged into Rockport, Texas, and then decided to hang around for five days visiting the fine folks of Houston and vicinity, it broke the 11.8 year “hurricane drought”, by far the longest period in the record without a major (category 3 or higher) landfall.[1],[2] Because of its unfortunate stall, Harvey also broke the record for a single-storm rainfall in the U.S., with 60.58 inches at Nederland, Texas.
What about a human influence from dreaded carbon dioxide? The National Oceanic and Atmospheric Administrations (NOAA) Geophysical Fluid Dynamics Laboratory (GFDL) dryly stated on September 20:
In the Atlantic, it is premature to conclude that human activities–and particularly greenhouse gas emissions that cause global warming–have already had a detectable impact on hurricane activity.
This was from a GFDL publication “Global Warming and Hurricanes”. This is a frequently revised publication designed to keep readers current with the evolving scientific literature on the subject, but the statement about prematurity has been in the document for many years.
But wait. Everything else being equal,[3] (“EEBE”) hurricanes—and their generic name, tropical cyclones—acquire their energy from warm water, and, globally, sea surface temperatures (SSTs) are around 0.5°C warmer than they were when the data become reliable around 1880. There was a decline of around 0.3°C from then to the low point in the record, around 1910, which means from bottom to top (1910 to 2016) there’s a change of around 0.8°C for the past 100 years or so.
There’s usually not enough energy to fuel a tropical cyclone if the ocean’s upper layer temperature is less than 26.5°C which limits their “seasons” to the late summer and early fall in each hemisphere, with the exception of the western Pacific, where there’s enough warm water to spin up storms year-round, although the maximum occurs at nearly the same time as it does in the North Atlantic. Owing to climatologically cooler temperatures, there are very few tropical cyclones in the South Atlantic.
Beyond the threshold, increasing the oceanic heat content (i.e. the vertically integrated temperature) should, EEBE, increase either the number of storms (holding their power constant), or their power (holding the number constant).
Meteorology wizard (and Cato adjunct scholar) Ryan Maue’s relatively recent PhD from Florida State was squarely over the bridge between tropical and temperate-zone storm climatology. Ryan knows hurricanes, and, beginning in grad school, has generated the comprehensive history of global tropical cyclone power. Although some tropical cyclones occur in pretty remote places, the onset of global weather satellite coverage in 1970 means his record is largely complete
Obviously EE is not E. Despite an SST rise of nearly 0.5°C since 1970 and a global surface temperature rise of around 0.65°C[4], there’s simply no warming-related trend in tropical cyclone power:
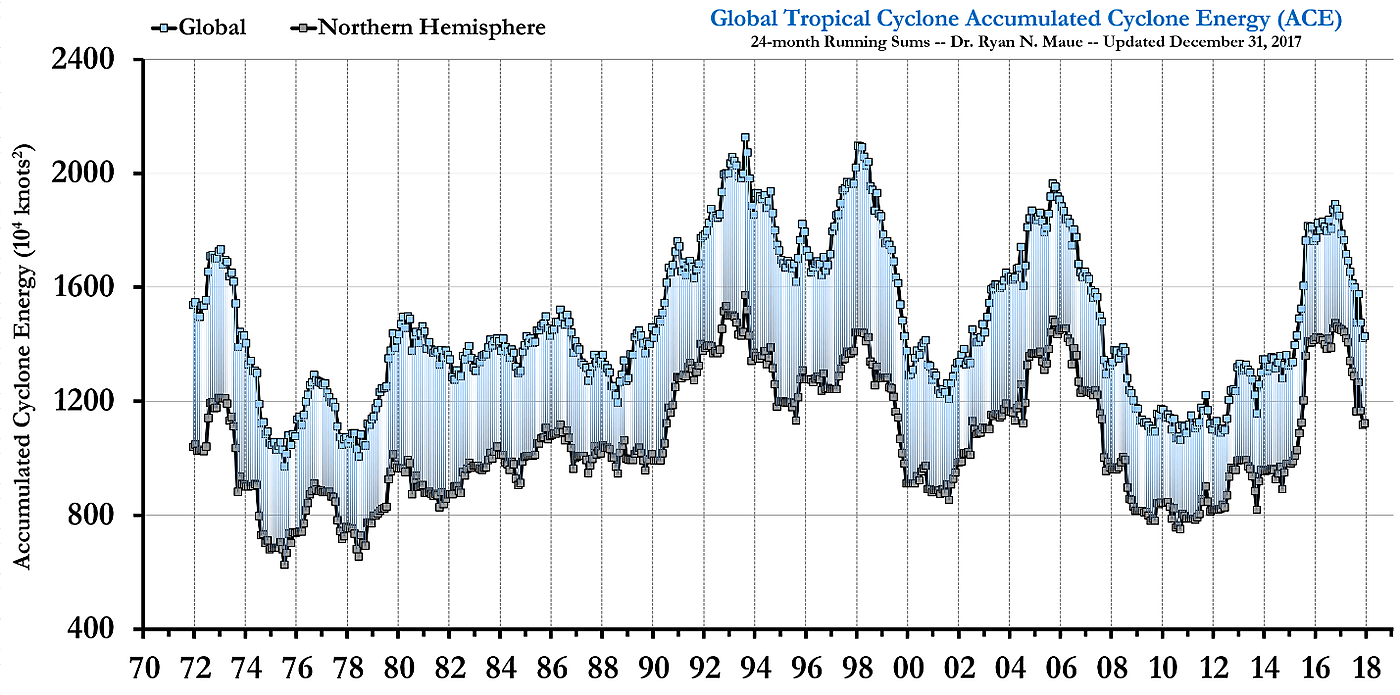
Figure 1. Maue’s Accumulated Cyclone Energy (ACE) Index shows no changes that can be related to overall temperature trends since 1970. Figures are 24-month moving averages. The top circles are for the globe, and the bottom ones for the Northern Hemisphere. If you’re paying attention, the space between the two gives the ACE index for the Southern Hemisphere.
As Roy Spencer (www.drroyspencer.com) recently has shown, there’s been a decline in the number of category 3 or higher storms hitting the coterminous US.
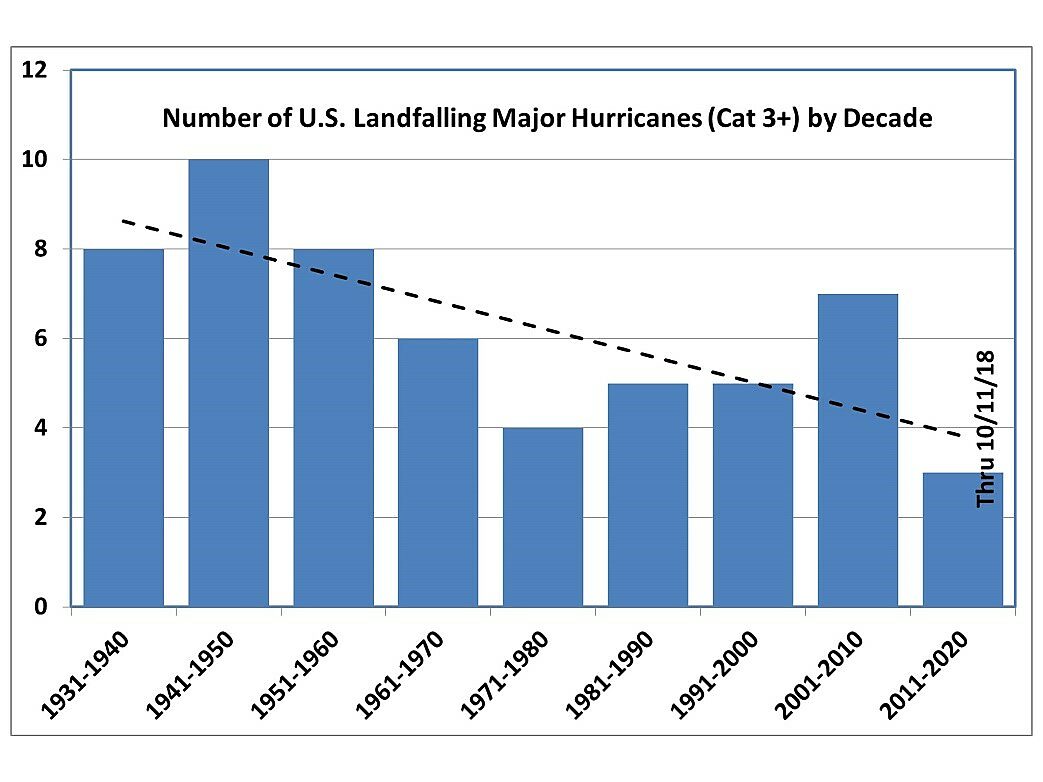
Figure 2. Roy Spencer’s plot of major (category 3 or higher) hurricanes hitting the lower-48 states. Note that there’s still two years to go for the decade beginning in 2011. There certainly could be more by 2020; if we take the historical average frequency of major hurricane hits and add that in, there’s nearly a 50–50 chance that the actual number will be four instead of three. Does not include two strikes in Puerto Rico (Cat 4 Maria last year and Cat 3 Hugo in 1989).
Historical Perspectives
The 2014 “National Assessment of Climate Change Impacts on the United States” made a big deal out of a seemingly large increase in the hurricane Power Dissipation Index. The principal difference between it and Maue’s Accumulated Cyclone Energy index is the PDI uses the cube of the wind speed while the ACE index uses the square. The National Assessment highlighted a rise from 1980 through 2009. But the authors certainly had data through 2013 at their disposal.
There is also is another record of Atlantic hurricanes back to 1851, called HURDAT and put together by the National Oceanic and Atmospheric Administration’s Hurricane Research Division. Prior to satellites (pre-1970) and aircraft reconnaissance (beginning in World War II), it would likely to have missed some storms, but HURDAT is about a complete a record as can be generated. Further, any errors in it are likely to be omissions of storms rather than calling ones that actually didn’t exist.
Ryan Maue used HURDAT and calculated the PDI back to 1920, and his analysis shows that the 2014 National Assessment picked a rather prominent cherry when it decided to emphasize the 1980–2009 rise.
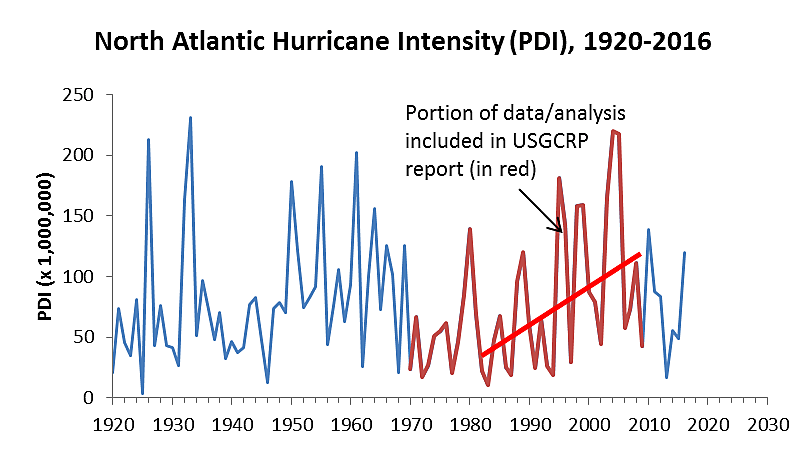
Figure 3. North Atlantic hurricane Power Dissipation Index (PDI). Despite being published in 2014, the most recent National Assessment emphasized the period 1980–2009, displaying an upward trend line during that time. It’s quite clear that the increase from the 40s to the early 60s is quite similar to what was displayed in the Assessment.
Roy Spencer recently looked at the frequency and windspeed of landfalling Category 3 or higher storms striking Florida. There’s obviously no trend, either in intensity or in frequency.
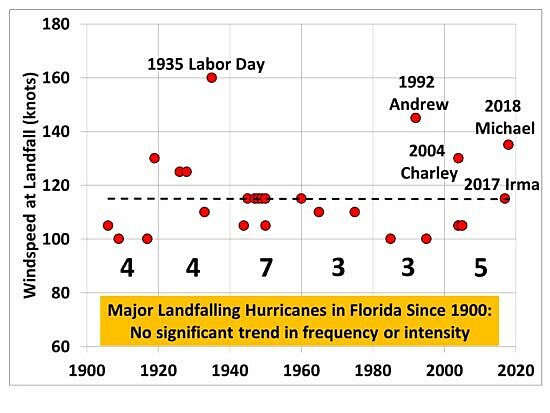
Figure 4. Category 3 strikes in Florida since 1900, along with highest sustained winds. Maximum gust speeds are higher. Category 3 hurricane Matthew in 2016 is not listed as the center never crossed the coast—but the Cape Canaveral area was very close to the western eyewall, and experienced considerable damage.
Hurricane Damages
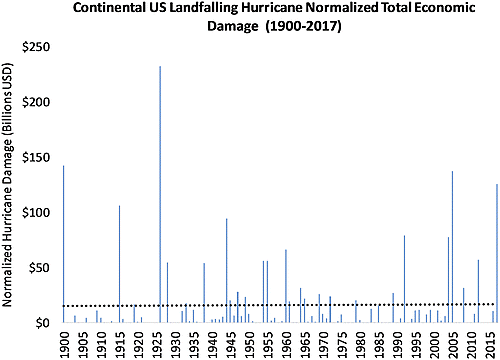
Colorado State’s Phil Klotzbach and three co-authors recently published what should be the last word on U.S. hurricane frequency and damages. One of the co-authors was University of Colorado’s Roger Pielke, Jr., who contributed a plot of what he calls “normalized hurricane damage”, which essentially projects current property values onto past hurricanes.
Again, there is no significant trend. 2017 had the third-highest normalized damage total in the continental US (note that does not include Puerto Rico), around $130 billion. That pales, compared to 1926, when total damages would have been around $230 billion for today’s property values.
All in all, recent hurricane activity isn’t particularly remarkable. Following a record 11.8‑year major hurricane drought, recent activity is surely impressive, but imparts no overall trend when viewed in terms of the entire record since 1900. Further, Maue’s global accumulated cyclone energy, going back to 1970 (the start of global weather satellite coverage), shows no relationship to global surface temperature. 2018 appears to be a record for activity (not number) in one basin—the Eastern North Pacific, but, again, that isn’t going to impart a trend.
[1] Adjusting the damage costs for inflation, and property values, Harvey was the third most costly hurricane, at $125 billion. The Great Miami Hurricane of 1926 takes the prize, at $210 billion, with 2005 Katrina at $168 billion. Data from Klotzbach et al. (cited below) and NOAA. Reliable estimates for damages extend back to 1900.
[2] The record goes back to 1851. The second-longest period was nine years and one month, from 1860 to 1869. That may be a bit suspect because contained within is the only three consecutive-year period without any landfall of even a Category 1 storm. That was 1862 through 1864, when the nation may have had a bit more to do than count hurricanes.
[3] Perhaps the most dangerous words to use when speaking climatically. The atmosphere is an integrated fluid over a rotating, highly heterogenous surface composed of liquid water, land, ice and snow. Everything else is never equal, and the atmosphere is never at rest.
[4] Data from the Climate Research Unit at the University of East Anglia. There’s a low point in the record that occurs in the mid-1970s, thanks to a slight cooling from 1945–75.
