In an interesting new Peterson Institute blog, Jason Furman and Willie Powell write, “Real wages and compensation increased dramatically in the first six months of the pandemic, as prices fell while wages and compensation continued to grow. Since then, however, price growth has been more rapid than wage and compensation growth, and so real wages and compensation have been falling.”
The facts are clear, yet they scream out for clarification. First, even nominal average hourly earnings “increased dramatically in the first six months of the pandemic (March-August 2020)” while the economy collapsed under COVID-19 fears and lockdowns. But the rise in “average” wages was a statistical anomaly.
Millions of low-wage workers were prohibited from working and fell out of the average leaving only an average of mostly upper-wage people working at home on Zoom. Unlike the illusory rise in average nominal wages, the 2020 gain in real wages was indeed helped by falling prices of goods and services liquidated at distress sale prices when stores and services were locked down. That included bargain prices of goods like gasoline and used cars which later rebounded at a furious pace as economies were reopened after February 2021.
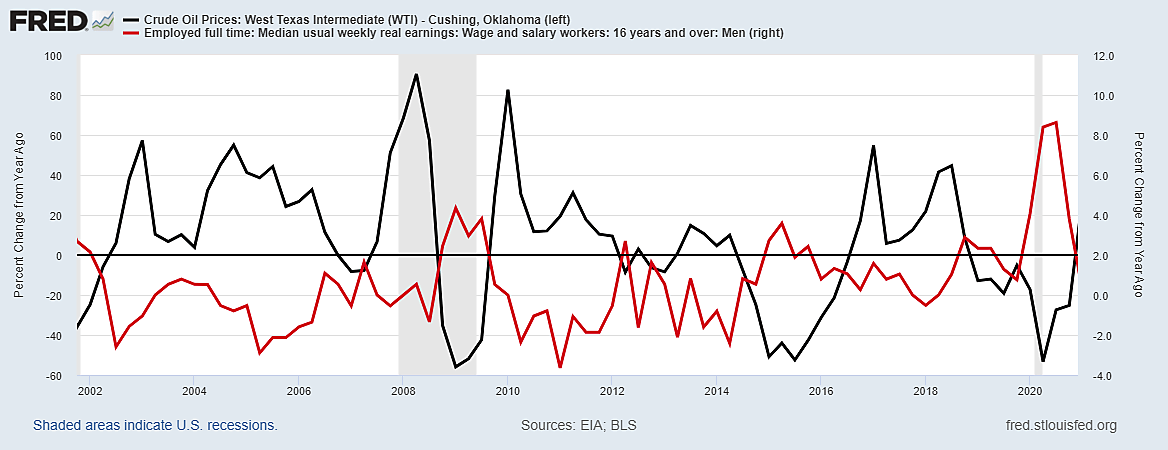
The graph shows year-to-year changes in median wages for full-time workers, which might be less distorted than the mean average except that excluding part-time workers means millions of low-wage workers who were locked out of work are not counted among the bottom 50%.
The red line illustrates my second point, which is that year-to-year changes in median real wages typically fall when oil prices surge (such as 2021 or 2003–2008) and rise when oil prices collapse (such as 2009 and early 2020).
So, year-to-year changes in real earnings in the year ahead will partly depend on what happens to oil prices, on that conventional year-to-year basis. That is because even “core inflation” is affected by changes in the energy cost involved in many services (like transportation), foods, and industrial products such as aluminum.
After easing last November and December, global natural gas and oil prices soared in January due to British and European overreliance on undependable wind power during a frigid winter, unrest in Kazakhstan and outages in Libya, and futures market hedging against risks of oil and gas shortages resulting from war demands and trade sanctions if Russia invades Ukraine. Aside from a possible Eastern European land war, the economic effects of which are unknowable, other recent disturbances and speculations may well prove as ephemeral as winter snow.
Since monthly changes in the graph are the percentage change from a year earlier, the year-to-year change in the price of crude oil would be negligible by October even if WTI and crude oil is still as high as $81 a barrel because it was $81 last October and $71 last June.
A few Wall Street bank analysts grabbed headlines by prognosticating $100 oil this summer or fall, though not all bank analysts agree. Neither does the Energy Information Agency which, on January 12, “forecast that the price of Brent will average $75/b in 2022 and $68/b in 2023. Brent crude is pricier than WTI crude, so that $75 estimate means a lower price for Texas crude. If WTI crude was $71 by June (the same as June 2021) the year-to-year increase would be zero and other oil-related prices in the CPI and PPI would likewise look flat.
Wall Street bank economists could be right (and EIA wrong) about $100 oil prices this summer. But bank extrapolators made another $100 oil prediction in 2018 shortly before oil dropped to $45 by year end. Last June, there were more headlines about U.S. banks expecting $100 oil by year end. If the world economy was not strong enough to sustain $100 oil in 2018 or 2021, however, it seems to me even less likely to do so in 2022.

