In my last post I pointed out that Bill Niskanen, writing in the most recent edition of the Cato Handbook for Policymakers, suggested that the Fed should focus on keeping the economy growing at a nominal rate of around 5 percent per year. This allows for an average annual growth rate of around 3 percent and an annual inflation rate of around 2 percent.
He illustrated the idea with this chart:
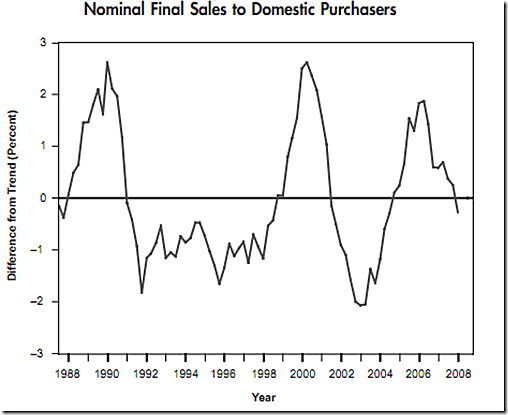
This shows how far nominal sales has deviated from the trend of 5.5 percent per year over the last two decades. It ends in early 2008, which was the most recent data available at the time he was writing. According to Niskanen’s theory, values above the line are a sign that monetary policy is too loose, while values below the line are a sign that monetary policy is too tight.
In his analysis, Niskanen focused on the three positive deviations in the chart, which started around 1988, 1999, and 2005, respectively. He argues that too-loose monetary policy during these periods created bubbles, which then popped and sparked recessions.
Karl Smith has helpfully reproduced and extended the chart to the present day. The results are striking:
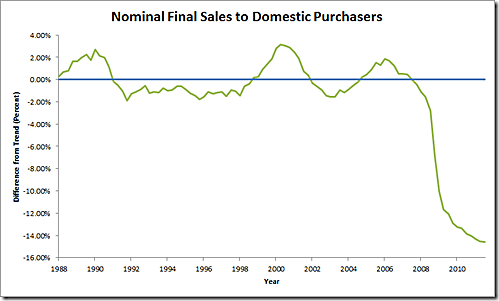
Here we can see that nominal final sales to domestic purchasers fell way, way below trend starting in late 2008. And not only has it not recovered, it’s actually been falling further behind! Which suggests that according to Niskanen’s rule, monetary policy started to be too tight in mid-2008, and has been too tight ever since.
