This is the first in a series of posts on global temperature records. The problems with surface thermometric records are manifold. Are there more reliable methods for measuring the temperature of the surface and the lower atmosphere?
Let’s face it, global surface temperature histories measured by thermometers are a mess. Recording stations come on- and offline seemingly at random. The time of day when the high and low temperatures for the previous 24 hours are recorded varies, often changing at the same station. This has a demonstrable biasing effect on high or low readings. Local conditions can further bias temperatures. What is the effect of a free-standing tree 100 feet away from a station growing into maturity? And the “urban heat island,” often very crudely accounted for, can artificially warm readings from population centers with as few as 2,500 residents. Neighboring reporting stations can diverge significantly from each other for no known reason.
The list goes on. Historically, temperatures have been recorded by mercury-in-glass thermometers housed in a ventilated white box. But, especially in poorer countries, there’s little financial incentive to keep these boxes the right white, so they may darken over time. That’s guaranteed to make the thermometers read hotter than it actually is. And the transition from glass to electronic thermometers (which read different high temperatures) has hardly been uniform.
Some of these problems are accounted for, and they produce dramatic alterations of original climate records (see here for the oft-noted New York Central Park adjustments) via a process called homogenization. Others, like the problem of station darkening, are not accounted for, even though there’s pretty good evidence that it is artificially warming temperatures in poor tropical nations.
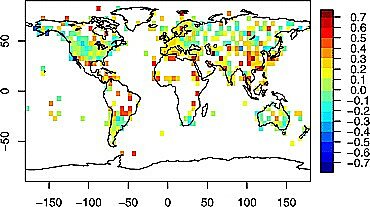
Figure 1. Difference between satellite-measured and ground-measured trends. Artificial warming is largest in the poor regions of Africa and South America. (Source: Figure 4 in McKitrick and Michaels, 2007).
There are multiple “global” temperature histories out there, but they all look pretty much the same because they all run into the problems noted above, and while the applied solutions may be slightly different, they aren’t enough themselves to make the records look very different. The most recent one, from Berkeley Earth (originally called the Berkeley Earth Science Team (BEST) record) is noteworthy because it was generated from scratch (the raw data), but like all the others (all using the same data) it has a warming since 1979 (the dawn of the satellite-sensed temperature era) of around 0.18⁰C/decade. (Computer models, on average, say it should have been warming at around 0.25⁰C/decade.)
They all have a problem with temperatures over the Arctic Ocean as there’s not much data. A recent fad has been to extend the land-based data out over the ocean, but that’s very problematic as a mixed ice-water ocean should have a boundary temperature of around freezing, while the land stations can heat up way above that. This extension is in no small part responsible for a recent jump in the global surface average.
It would sure be desirable to have a global surface temperature record that suffered from none of the systematic problems noted above, and—to boot—would be measured by electronic thermometers precisely calibrated every time they were read.
Such a dream exists, in the JRA-55 dataset. The acronym refers to the Japan Meteorological Office’s (originally) 55-year “reanalysis” data, and it updates to yesterday.
Here’s how it works. Meteorologists around the world need a simultaneous three-dimensional “snapshot” of the earth’s physical atmosphere upon which to base the forecast for the next ten to sixteen days. So, twice a day, at 0000 and 1200 Greenwich Mean Time (0700 and 1900 EST) weather balloons are released, sensing temperature, pressure, and moisture, and tracked to determine the wind. There’s also satellite “profile” data in the mix, but obviously that wasn’t the case when JRA-55 began in 1958. These are then chucked into national (or private) computers that run the various weather forecast models, and the initial “analysis,” which is a three-dimensional map based upon the balloon data, provides a starting point for the weather forecast models.
Once the analyzed data had served its forecasting purpose, it was largely forgotten, until it dawned upon people that this was really good data. And so there have been a number of what are now called “reanalysis” datasets. The most recent, and the most scientifically complete one is JRA-55. In a recent paper describing, in incredible detail, how it works, the authors conclude that it is more reliable than any of the previous versions, either designed by the Japan Office or elsewhere.
Remember: the thermistors are calibrated at the release point, they are all launched at the same time, there’s no white box to get dirty, and the launch sites are largely in the same place. They aren’t subject to hokey homogenizations. And the reanalysis data has no gaps, using the laws of physics and a high-resolution numerical weather prediction model that generates physically realistic Arctic temperatures, rather than the statistical machinations used in the land-based histories that inflate warming over the Arctic Ocean.
There is one possible confounding factor in that some of the launch sites are pretty close to built-up areas, or are in locations (airports) that tend to attract new infrastructure. That should mean that any warming in those places is likely to be a (very slight) overestimate.
And so here is JRA-55 surface temperature departures from the 1981–2010 average:
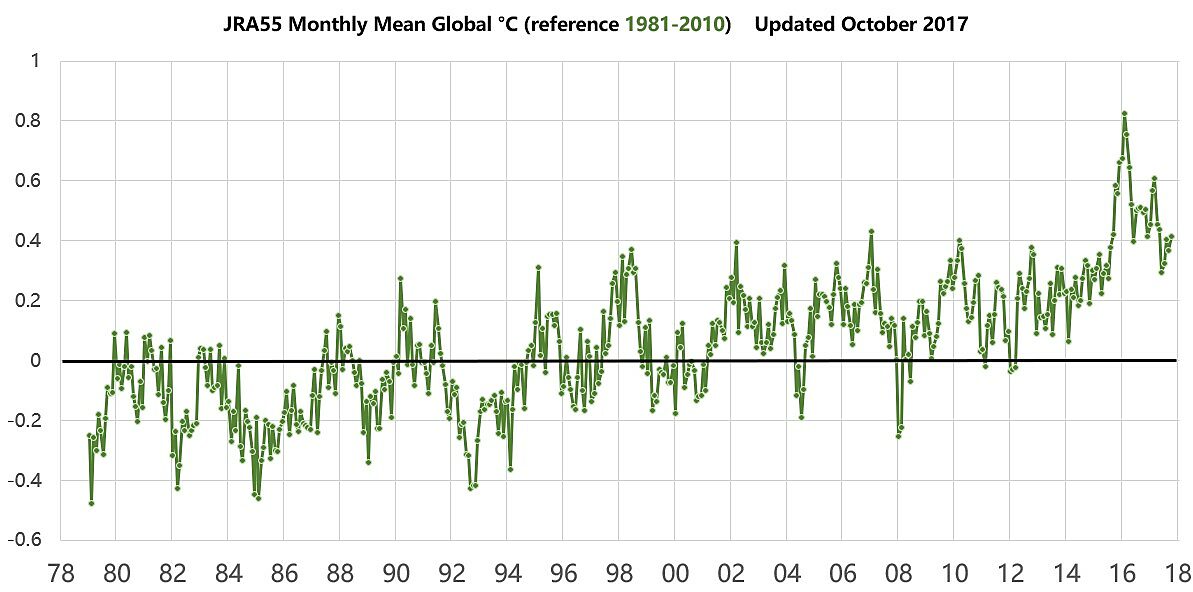
Figure 2. Monthly JRA-55 data beginning in January, 1979, which marks the beginning of the satellite-sensed temperature record.
The warming rate in JRA-55 until the 2015–16 El Niño is 0.10⁰C/decade, or about 40% of what has been forecast for the era by the average of the UN’s 106 climate model realizations. There’s no reason to think this is going to change much in coming decades, so it’s time to scale back the forecast warming for this century from the UN’s models—which is around 2.2⁰C using an emissions scenario reflecting the natural gas revolution. Using straight math, that would cut 21st century warming to around 0.9⁰C. Based upon a literature detailed elsewhere, that seems a bit low (and it also depends upon widespread substitution of natural gas for coal-based electricity).
JRA-55 also has a rather obvious “pause” between the late 1990s and 2014, contrary to recent reports.
The fact of the matter is that what should be the most physically realistic measure of global average surface temperature is also our coolest.
