In July 2017, the Department of Health and Human Services (HHS) produced the first rigorous accounting of the fiscal effects of refugees and asylees to the United States. The study gives the best insight so far into the economic assimilation of U.S. refugees into their adopted country. While the White House prohibited the official release of the report for political reasons, the New York Times in September 2017 obtained a copy of the draft. This post summarizes the report’s main findings:
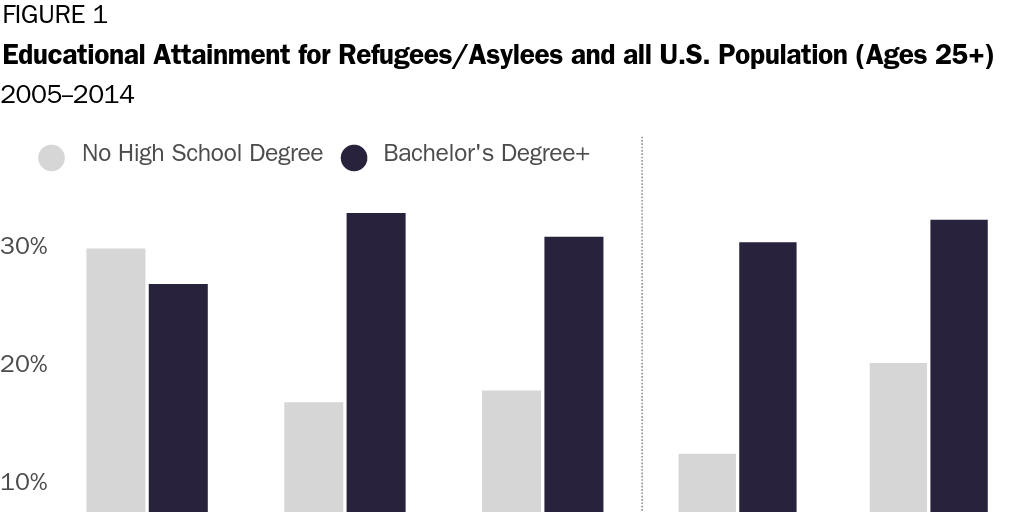
- While refugee and asylee high school graduation rates are lower than all U.S. adults, refugee and asylee college graduation rates are slightly higher.
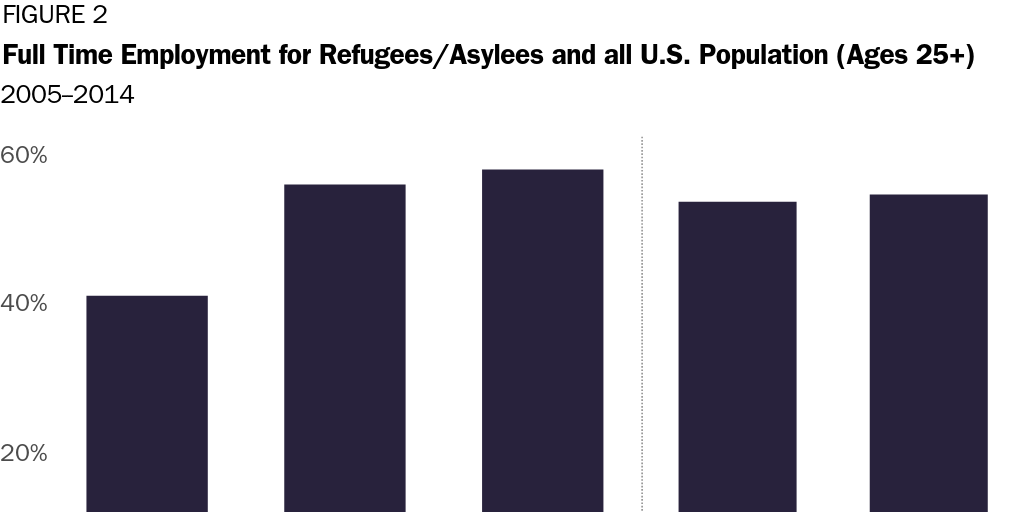
- Adult refugee and asylee full-time employment grows over time to be slightly higher than all U.S. adults.
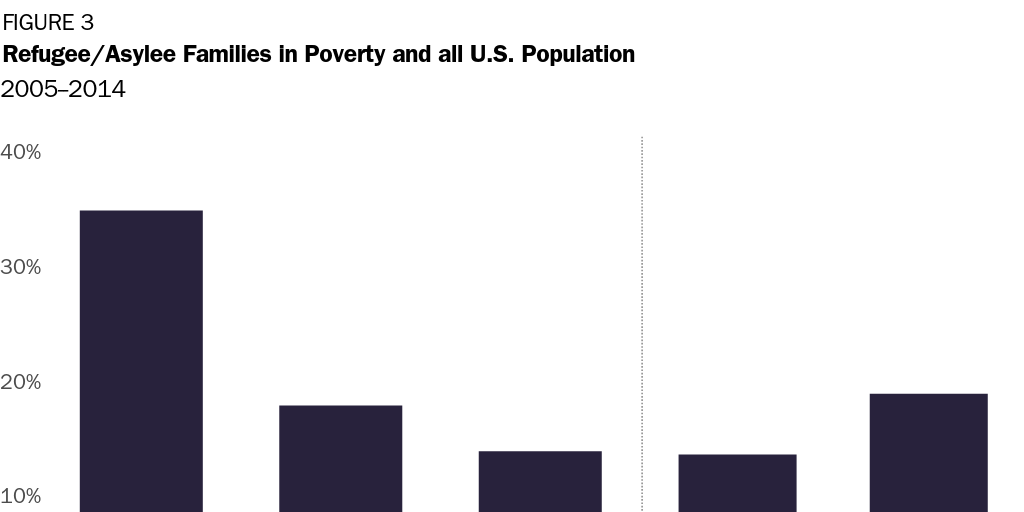
- Refugee and asylee poverty declines over time to be only 1 percentage point higher than all U.S. families.
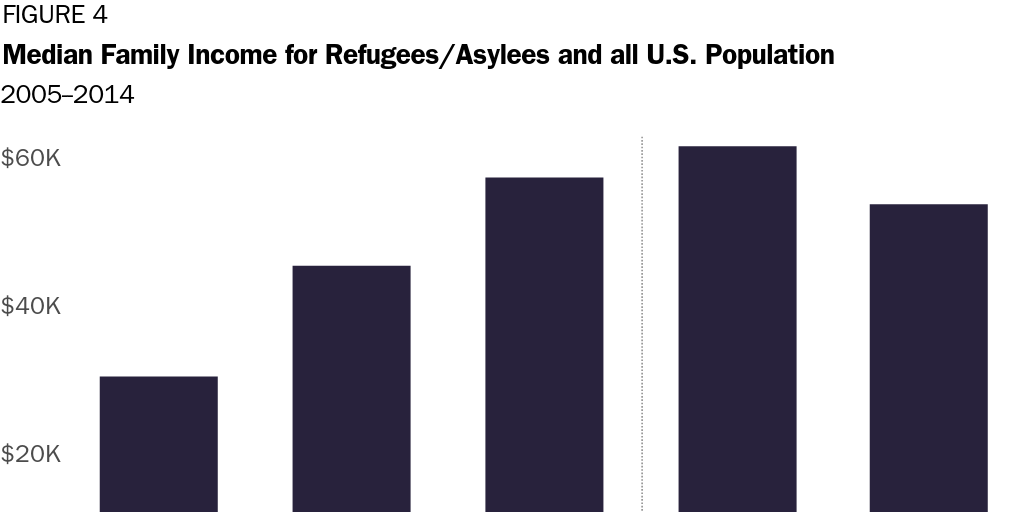
- Refugee and asylee median family income almost doubles over time from $32,539 to $59,433, virtually identical to the U.S. average.
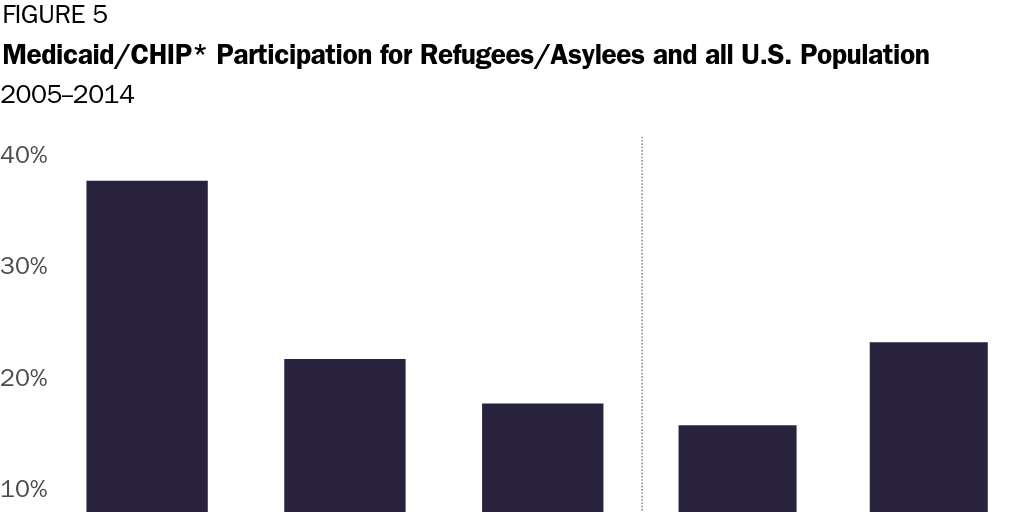
- Refugee and asylee Medicaid-CHIP participation rate halves over time to be only 1 percentage point higher than the U.S. population.
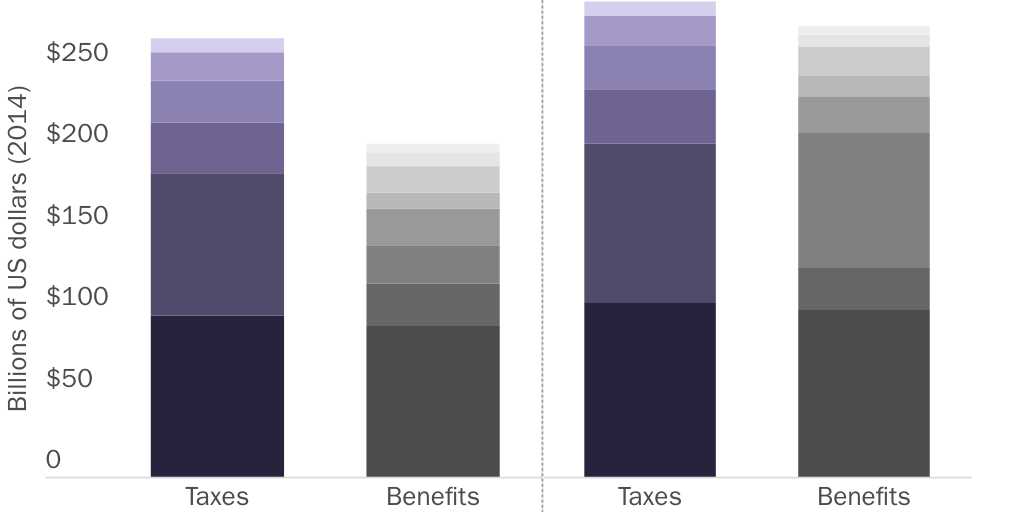
- The U.S. refugee and asylee population paid $63 billion more in taxes than they received in benefits to all levels of government from 2005 to 2014.
- The per capita annual net fiscal effect of each refugee or asylee was positive $2,205 compared to a national average of $1,848 from 2005 to 2014.
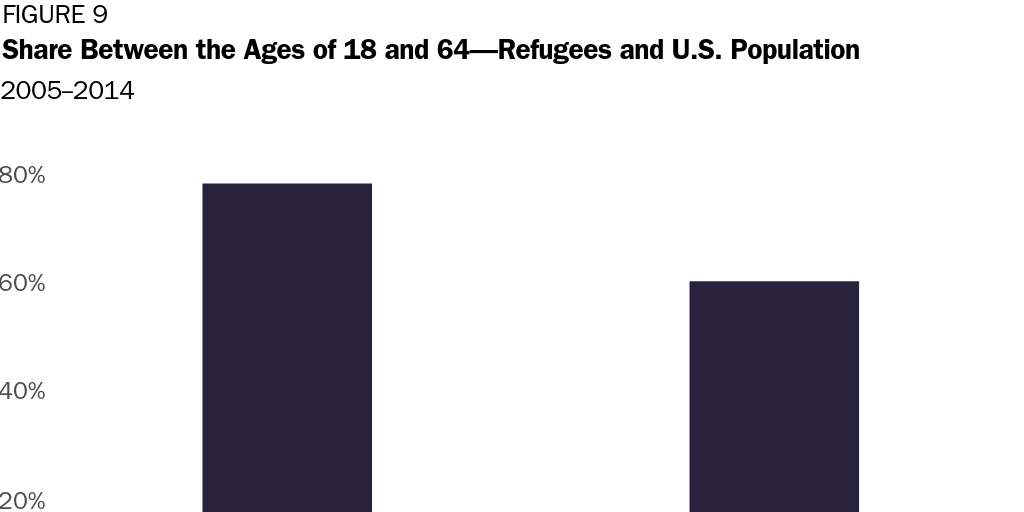
- Refugees and asylees had a more positive fiscal effect because 81 percent were in their prime working years compared to just 63 percent of the U.S. population overall.
- Refugee fiscal benefits were more than twice as great during years when the economy was growing quickly compared to the recession years.
Report Methodology: The report covers the period from 2005 to 2014 and reviews the economic effects of all refugees and asylees in the United States if they entered since 1980, when the modern refugee and asylum systems were created. This includes those refugees who later became legal permanent residents or U.S. citizens. The study includes an exhaustive list of expenditures, including entitlements, means-tested welfare, public education, corrections, refundable tax credits, health care, housing, school lunches, and much else (see. p. 15 for the full list). It excluded the cost of public goods—mainly, defense and interest payments on existing debt—since an additional beneficiary does not generally require an increase in spending on these items.
HHS relied on data from the Census Bureau’s Current Population Survey’s Annual Social and Economic Supplement (CPS-ASEC)—which asks survey respondents about their demographic characteristics, incomes, benefit use, etc.—but increased the reported amounts to account for known underreporting of benefits. Because CPS-ASEC fails to ask respondents if they entered as refugees, HHS classified respondents as refugees if they entered in a year during which most immigrants from their birth country were either refugees or asylees (who are refugees who apply in the United States).
While the White House stopped the public release of the report, immigration researchers across the spectrum—including for the anti-legal immigration think tank Center for Immigration Studies—are relying on it.
Findings of the Trump Administration’s Refugee and Asylee Study
HHS found that refugees have higher educational attainment than many people would expect given the fact that these immigrants are not entering based on skills. Of refugees and asylees who are adults (ages 25 and over) who entered from 2010 to 2014, 28 percent had at least a college degree (Figure 1). Overall, 32 percent of all adult refugees living in the United States from 2005 to 2014 had a least a college degree, compared to 30 percent of all U.S. adults. Of course, many refugees fall on the opposite end of the skills spectrum as well, with 20 percent of all refugee adults lacking a high school degree compared to 13 percent of the overall U.S. adult population.
This bifurcation between those with more education and those with less education allow refugees to fill niches at both ends of the labor market. According to HHS’s analysis, refugees are, in fact, contributing to the U.S. economy. HHS found that adult refugee full-time employment rates increase over time to eventually exceed the national average (Figure 2)—60 percent v. 57 percent. The entire population of adult refugees had about the same full-time employment rate (58 percent) as all U.S. adults during the 2005 to 2014 period.
Increased employment translates into fewer refugee/asylee families living in poverty. The share of refugee and asylees living below the poverty nosedives after the first five years, and among those who entered 10 years or more ago, the poverty rate is almost the same as the national average. Overall, all refugee families still had a higher poverty rate (19 percent) than the entire U.S. population (14 percent) during this period.
The effect of more employment experience also shows up in the strong increases in median family income for refugees and asylees in the United States. Their median family income almost doubles over time and after 10 years in the United States is virtually the same as the national average (Figure 4).
Higher incomes translate into lower rates of means-tested benefits use. The rate of Medicaid or Child Health Insurance Program (CHIP) participation among refugees and asylees, for example, halves over time (Figure 5). Among those with at least 10 years in the United States, the rate during the 2005 to 2014 period was just 3 percentage points higher than the national average.
Higher incomes and greater employment results in refugees and asylees paying more taxes and receiving fewer benefits. From 2005 to 2014, refugees and asylees received $206 billion in benefits and paid $269 billion in taxes to all levels of government—a net gain of $63 billion (Figure 6). HHS also looked at the net fiscal effect of refugee families, which include U.S. citizen spouses and minor children. Once again, it concluded that over the course of the decade, refugee families contributed more in taxes ($343 billion) than they received in benefits ($326 billion)—a net of $17 billion.
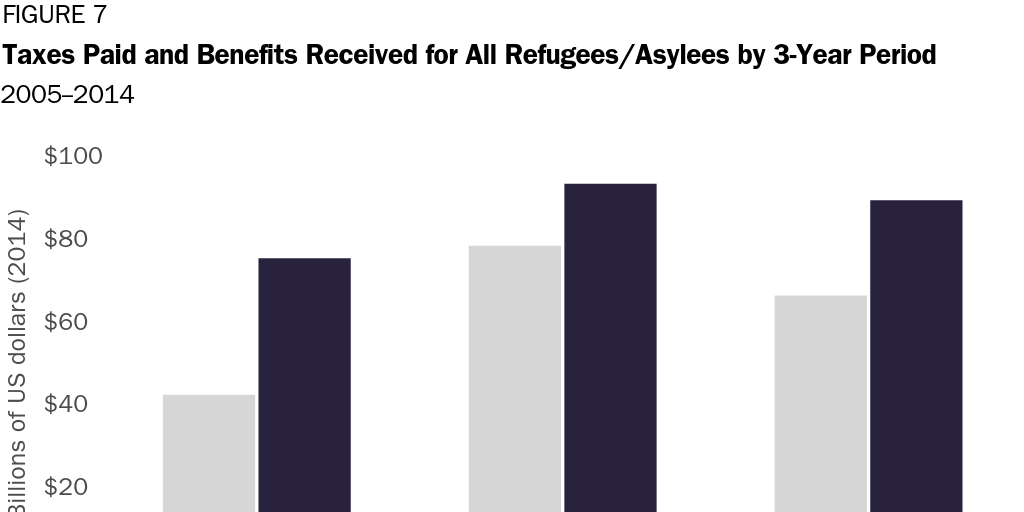
While the report’s period of study ended in 2014, the fiscal benefits of refugees and asylees have likely increased since then. From 2005 to 2007—when the U.S. employment situation was most comparable to today—refugees and asylees paid nearly twice as much in taxes as they received in benefits (Figure 7). The annual surplus during those years was $11 billion compared to $7 billion overall.
Refugees and asylees paid slightly less taxes per capita than other Americans, but they received fewer benefits per capita from 2005 to 2014 (Figure 8). The annual net fiscal effect from 2005 to 2014 was slightly higher for refugees and asylees (+$2,182) than for the national average (+$1,848).
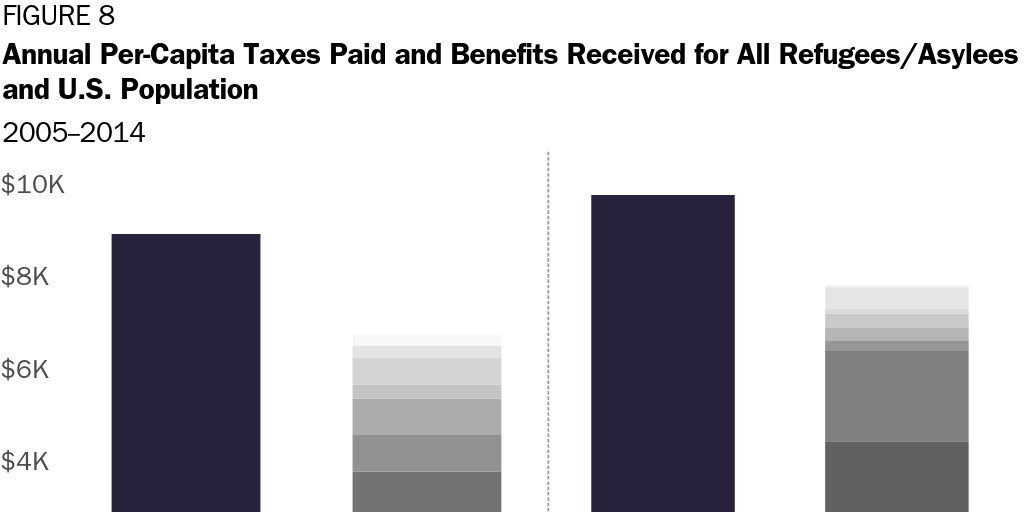
The better fiscal effect for refugees is driven by the fact that more refugees and asylees are in their prime working years and are not children and elderly. HHS finds that 81 percent of refugees and asylees are between the ages of 18 and 64-years-old compared to just 63 percent for all U.S. residents (Figure 9). As a result, governments spent far less on K‑12 public education and Social Security benefits for refugees and asylees, on a per capita basis, than the national average (see Figure 8).
While the federal government runs a considerable deficit—nearly $1 trillion—public goods like defense spending and interest on the debt are greater than this deficit. Each new person generally requires no increase in spending on public goods (while they do require an increase on other items like Social Security or food stamps). This means that it is possible for the government to spend more than it takes in, but the marginal effect of each additional person to remain positive.
Conclusion
The Trump administration’s analysis is the most detailed accounting of the cost and benefits of refugees and asylees in the United States so far. While it has several important limitations driven by the availability of the data, the results are positive. Refugees and asylees not only contribute to the economic health of their new country but increase their economic contributions considerably over time. The Trump administration should permit its authors to finalize the report and publish it.
