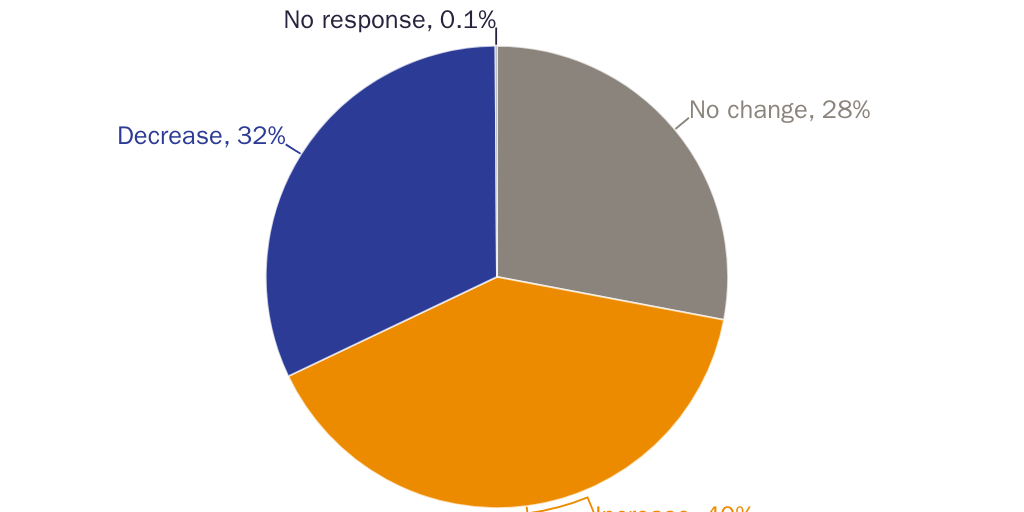
More than four years after public schools reopened from pandemic-related closures, private schools continued to see their enrollments rise. Of all the schools that responded to the Cato Institute’s 2024 Private School Enrollment Survey, 40% reported enrollment increases between the 2023–2024 and 2024–2025 school years, 32% saw decreases, and 28% reported no change. Meanwhile, 53% reported experiencing an increase in enrollment during the COVID-19 pandemic, while 47% did not. Of the schools that saw an increase, 65% reported maintaining their increase in enrollment as COVID-19 subsided, while 35% said they saw a decline after the initial increase. Many schools reported that a primary reason for increased enrollment at their school was that the values of the school and parents were aligned. Other commonly cited drivers of increasing enrollment were academic concerns and religion. Many schools whose enrollment declined reported that tuition affordability, often linked to competition from district and charter public schools as well as other private schools, was a top factor.
Introduction
When COVID-19 looked like it might significantly affect American private schooling, Cato’s Center for Educational Freedom began tracking the sector’s enrollment trends. Though private school enrollment shrank early on, as the pandemic continued we started to see evidence that it was rebounding. This is likely because private schools tended to resume full academic operations faster than public schools, including reopening to in-person instruction. Since then, we have also seen a major expansion of private school choice programs, with enrollment through such programs now exceeding one million students. Our fifth annual private school survey looks at enrollment trends between the 2023–2024 and 2024–2025 school years. It finds increasing public demand for private schooling, but pandemic-driven momentum appears to have significantly slowed.
Most Schools See Enrollment Rise
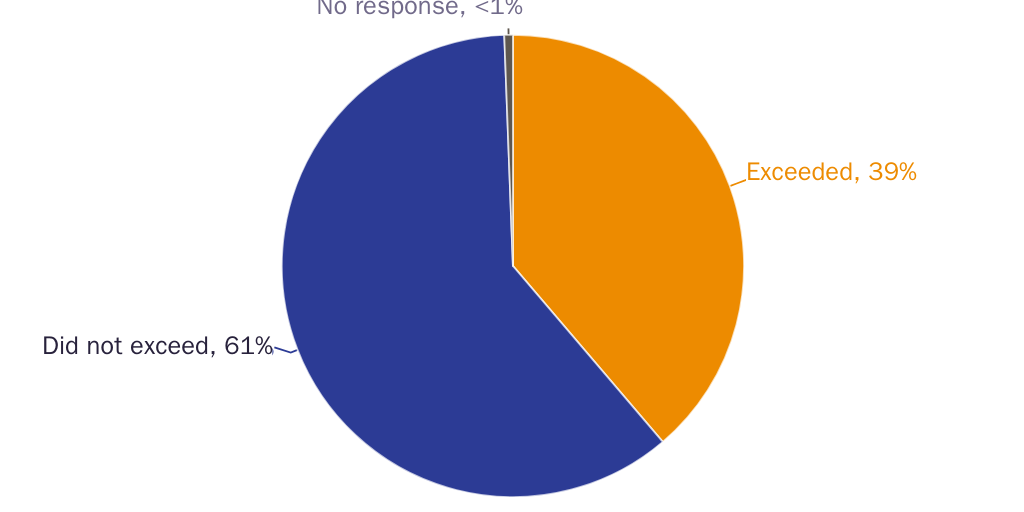
Our latest results are from a survey sent electronically to all schools in the Private School Review database as of September 2023 serving at least one grade in the K–12 span. The results indicate that private education continued to grow, as has been the case in all but our first survey in 2020. The first year saw widespread declines amid the COVID-19 lockdowns. As shown in Figure 1, among the 883 schools that responded to at least one question on our survey, 40% reported enrollment increases between the end of the 2023–2024 school year and the start of the 2024–2025 school year, 28% reported no change, and 32% reported declining enrollment. One did not report any gains or losses.
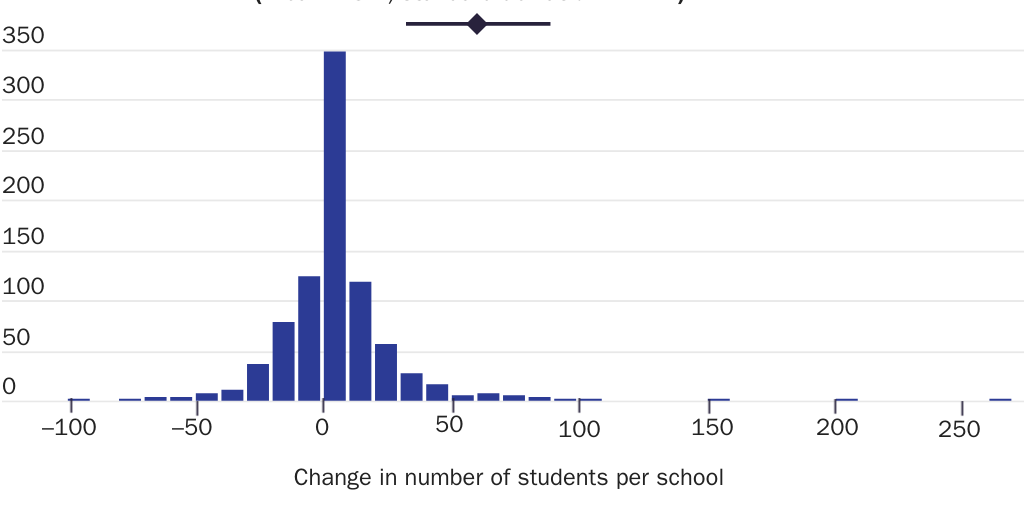
The mean change in enrollment per school was a gain of 3 students, which, when compared with the recent mean enrollment in US private schools of 184 students, represents a 1.6% increase. Figure 2 shows the distribution of gains and losses, with responses clustered between a loss of 10 students and a gain of 20.
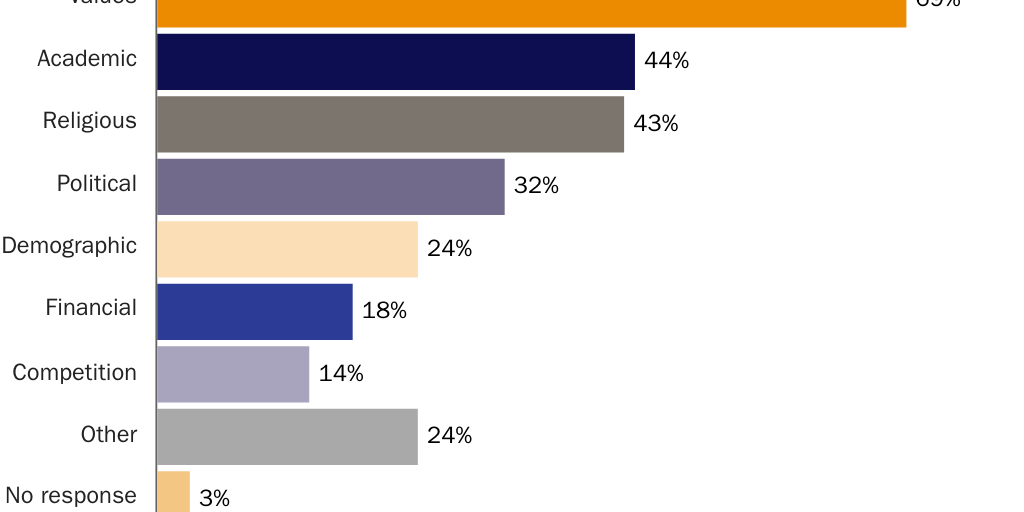
Schools that experienced an enrollment increase attributed it to a values alignment between the school and parents (69%), a better academic experience (44%), religious alignment with parents (43%), political issues (32%), demographics (24%), affordability and financial reasons (18%), or competition with other schools (14%). The callout box below provides examples of detailed responses from particular schools for each growth reason. The word cloud for schools that gained enrollment (Figure 4), created from free responses, helps illustrate the numerous reasons parents chose to enroll their children in private schools after the COVID-19 pandemic. Note that the words “public” and “private” were most frequently cited but were omitted to showcase a broader array of responses.
Sample of Free Responses on Reasons for Enrollment Growth
One school that cited values wrote, “Demographically, we focus on diversity in all aspects of the program and describe these aspects, our financial tailoring, and our development of core values in our marketing more clearly to improve the mission-appropriate student attraction.”
A school that pointed to academics said, “We are constantly improving in our four cornerstones of educating spiritually, academically, physically, and socially.”
Among schools citing religious reasons, one wrote, “Many parents saw our Graduation Ceremony and how our Early Childhood Students recited Qur’an, Arabic terms and phrases, counted and recited the Alphabet in Arabic.”
When it came to the influence of politics, a school wrote, “Feedback from parents indicates that the public schools [sic] focus on education has declined.”
For schools that selected demographic reasons, one school wrote, “The geographical area from which we draw has a large percentage of high income professionals who value education.”
Financial reasons were also frequent. A school wrote, “The Educational Choice law, the Hope Scholarship, has made a private school tuition education affordable to families that desired it but previously could not afford it.”
Finally, competition has a significant effect on enrollment, with one school writing, “Several of our private school competitors have struggled with their school culture and enrollment.”
Note: Schools could select multiple reasons for enrollment changes, so responses may reflect overlapping factors.
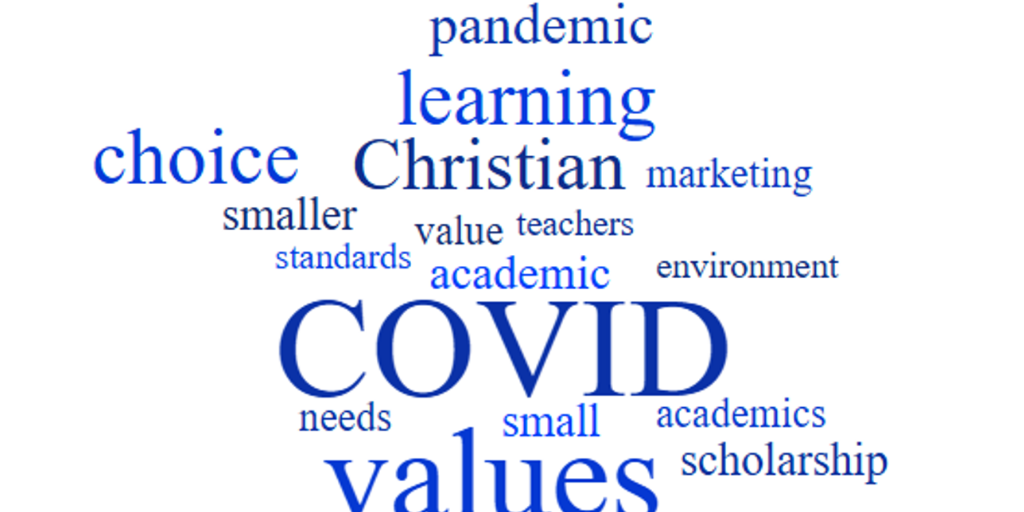
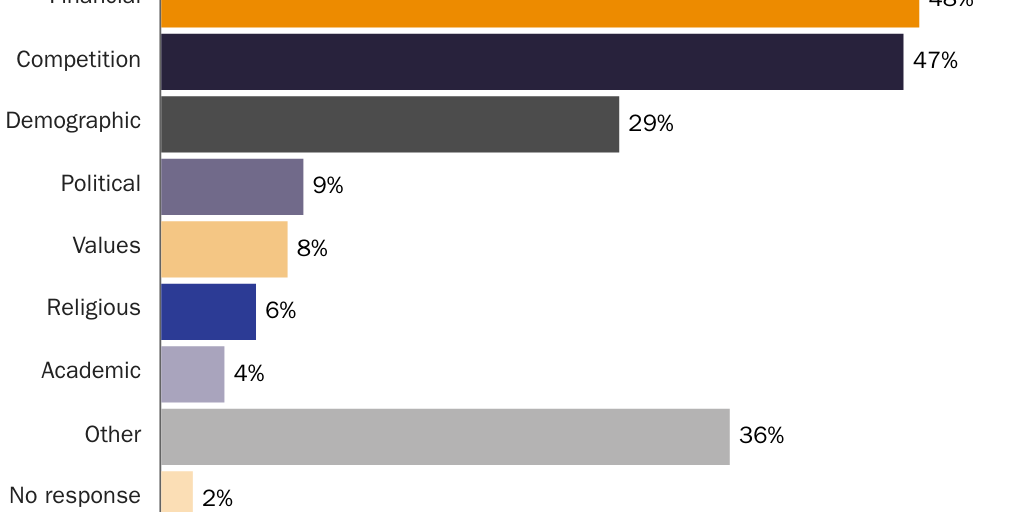
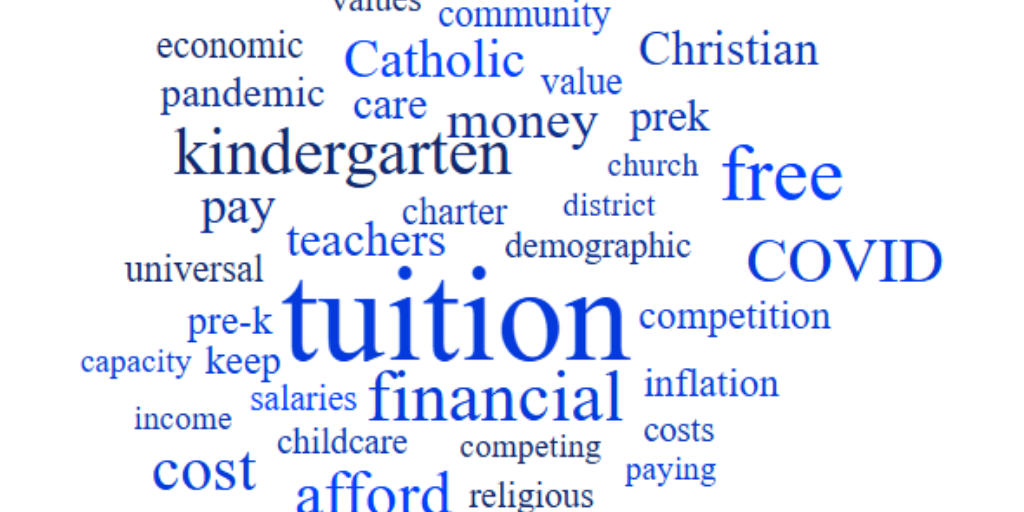
Figure 5 shows that among schools with decreased enrollment, financial reasons (48%) and competition with other schools (47%) were most frequently cited as the primary causes for losses. Other reasons included were demographic (29%), political (9%), values-related (8%), religious (6%), and academic (4%). More detailed examples can be found in the callout box below. As indicated in the word cloud (Figure 6), several schools cited the cost of tuition and free preschool being offered by public schools as reasons for decreasing enrollment. Once again, the words “public” and “private” were most frequently cited but omitted to showcase a broader array of responses.
Sample of Free Responses on Reasons for Enrollment Decline
A school that selected financial reasons wrote, “Tuition price keeps increasing while inflation, housing prices, groceries keep rising. The younger generation doesn’t see the value of paying for school when we have good public-school systems in our city.”
Competition also influenced enrollment, with one school writing, “We are competing with 11 preschools around the area. We had to close down 3 classrooms due to [the] Governor’s policies to have 3 year olds and 4 year olds in public schools. Pretty soon we will have to close down.”
For schools that selected demographic reasons, one school wrote, “Several families moved out of the area.”
When it came to the impact of politics, a school wrote, “Declining school age population, changes in tuition reimbursement with the DOE, the economy, politically charged opinions on diversity and inclusion.”
One school that selected values wrote, “We moved into a new facility, which did not have a completed gymnasium and outdoor space. This coupled with parents seeing elective advantages to government funded education and not caring about our values, we experienced more outflows than inflows.”
Among schools citing religious reasons, one wrote, “People don’t see the value anymore of Christian education or paying for it in our town. They see convenience of free public education and really value work over their religious values around here.”
A school that pointed to academics said, “Our school ended up closing. We lost students when we couldn’t find enough qualified teachers. Some families switch to schools in the school choice program for financial aid.”
Note: Schools could select multiple reasons for enrollment changes, so responses may reflect overlapping factors.
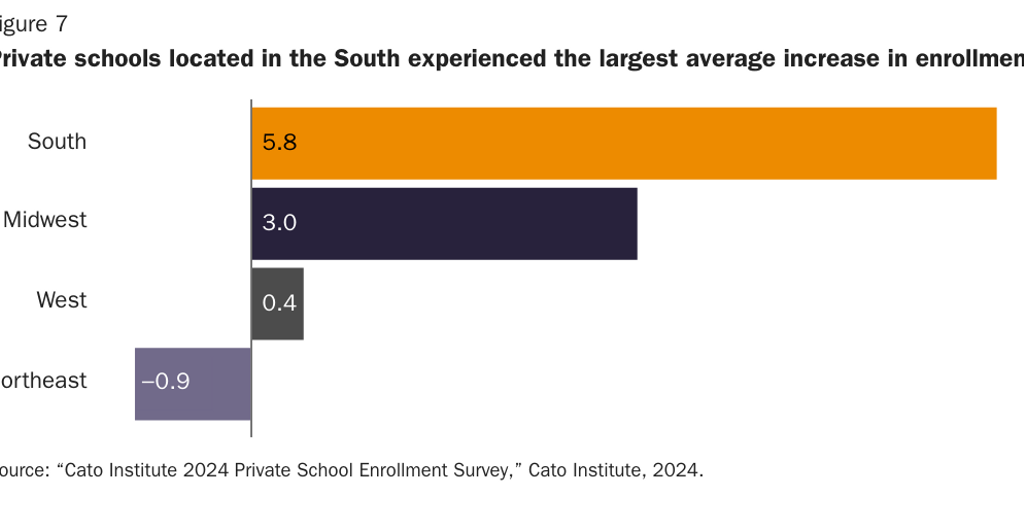
Looking at enrollment trends by region (Figure 7), we observed that the Midwest and South experienced average enrollment increases of three and nearly six students, respectively, while the West saw an increase of barely a third of a student. The Northeast saw an average decrease of about one student. These findings are somewhat consistent with research indicating that Americans have been moving away from the coasts and increasingly relocating to the South—but not Midwest—for lower living costs and housing affordability.
A Plurality of Schools Had Increased Applications, and 39% Had More Applicants than Spaces
The increase in private school enrollment might have been larger but for supply shortages, as indicated by applications outpacing available seats in many schools. As seen in Figure 8, application submissions did rise overall, with 42% of schools reporting increased submissions, 36% reporting no change, and 21% reporting a drop in submissions.
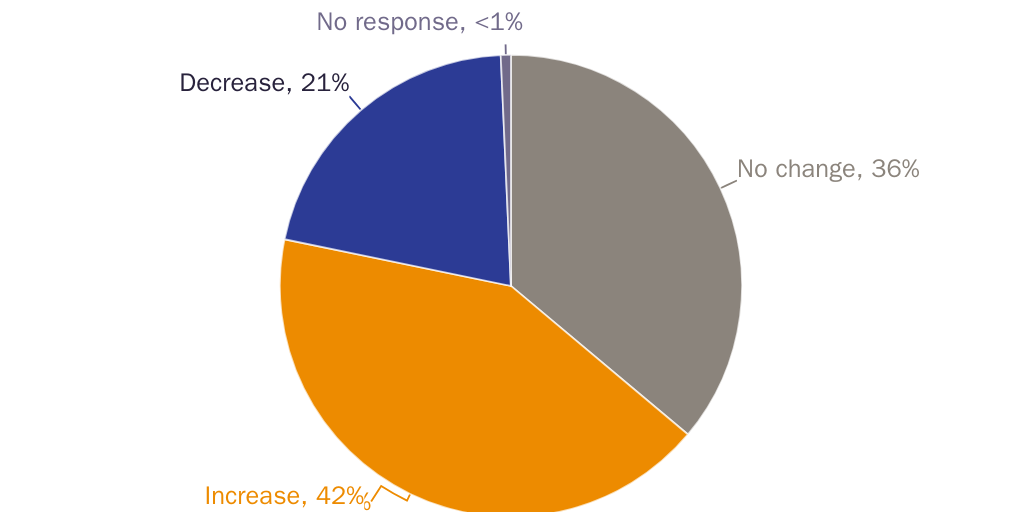
Figure 9 shows that many schools also had more students apply than they could accommodate, with 39% of respondents reporting receiving more applications than seats available.
Historical Enrollments
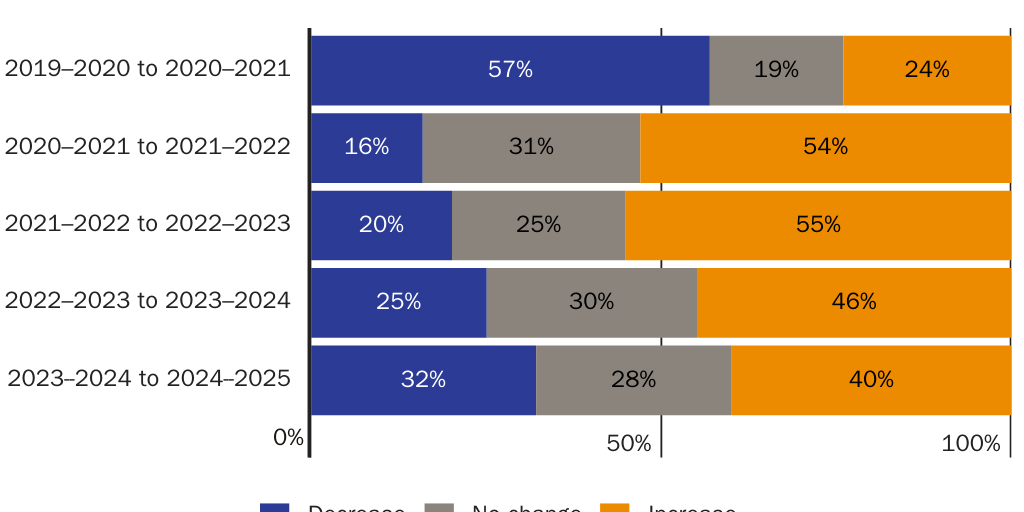
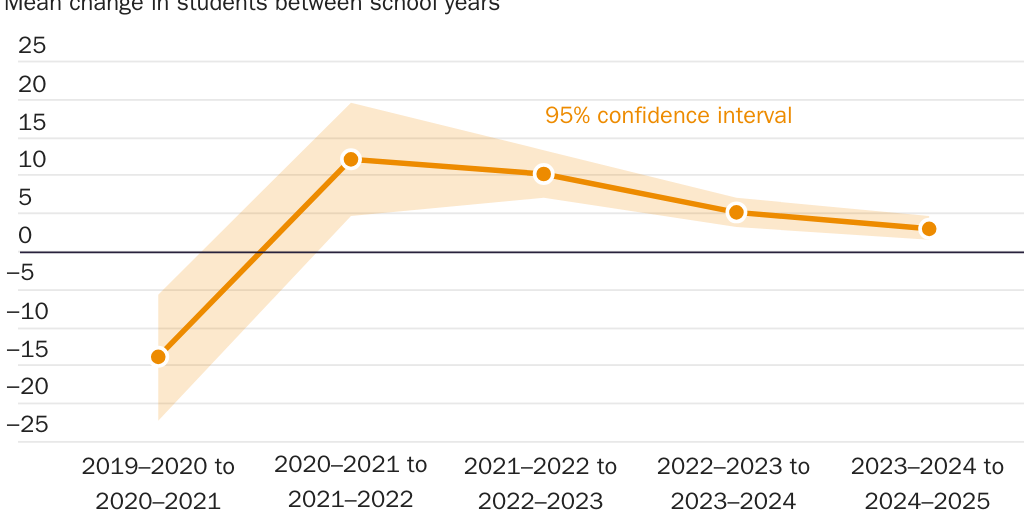
The trends in our five surveys indicate that after enrollment initially decreased at the outset of the COVID-19 pandemic, private schooling rebounded and has been growing while public schooling has been contracting. Figure 10 shows this trend: More schools are reporting enrollment increasing than decreasing or remaining unchanged. Figure 11 shows the average enrollment change trend. The four-year trend finds declining increases for private schools, suggesting that the COVID-19 increase is almost over or that other factors that might have been driving net private school enrollment increases are waning. (Note that our first two years of data were from small samples and hence had high margins of error. We also separately accounted for enrollment with and without pre‑K. In the most recent three years, we did not separate pre‑K from K–12. The numbers in Figures 10 and 11 are for schools with pre‑K and including those pre‑K numbers.)
Implications
It appears that private schooling enrollment continued to grow in the 2024–2025 school year. However, it grew at a slower pace than in previous years. As we get further from the time when public schools were largely closed to in-person education—the last school year with heavy hybrid or fully online schooling was 2020–2021—the pandemic seems less likely to be an explanation for growth, and non-COVID-19 factors seem more likely to be in play. Perhaps especially, disputes over values that have recently engulfed many states could be driving the enrollment increase. Additionally, pandemic frustrations and conflicts over values seem to have driven large expansions of school choice programs that make paying for private school more equitable, possibly also fueling growing private enrollment. Whatever the reasons, these findings indicate a continuing but decelerating movement away from public schooling.
Methodology
The Cato Institute 2024 Private School Enrollment Survey was conducted from October 17 to November 1, 2024, among 22,411 private schools. We used the Private School Review (PSR) database of all institutions and their contact information to reach as many private schools as possible. We began with a list of 26,704 schools with at least one grade in the K–12 span. We sent notifications about the survey to each of the schools on the list one day prior to entering the field. We then sent an invitation to participate in the survey to the first email address we had for each school. Of those, 3,255 bounced or failed to deliver, and 1,038 were duplicates. The email was delivered to 22,411 unique addresses. We sent two reminder emails to the schools during the survey period. Of these, 883 schools responded to at least some portion of the survey, giving us a response rate of about 4%. In total, 882 institutions provided data for the primary variable of interest: whether enrollment had increased, decreased, or stayed the same. Different variables reported here had slightly different numbers of responding schools, but all fell within a ±3.3 percentage point margin of error at the 95% confidence interval.
School Characteristics of the Sample
As seen in Figure 12, within our sample, 586 respondent schools were classified by the PSR as regular elementary and secondary schools, 93 were classified as early childhood and daycare centers, 83 were Montessori schools, 49 were special education schools, 44 were elementary and secondary schools with a special program emphasis, and 28 were alternative schools.
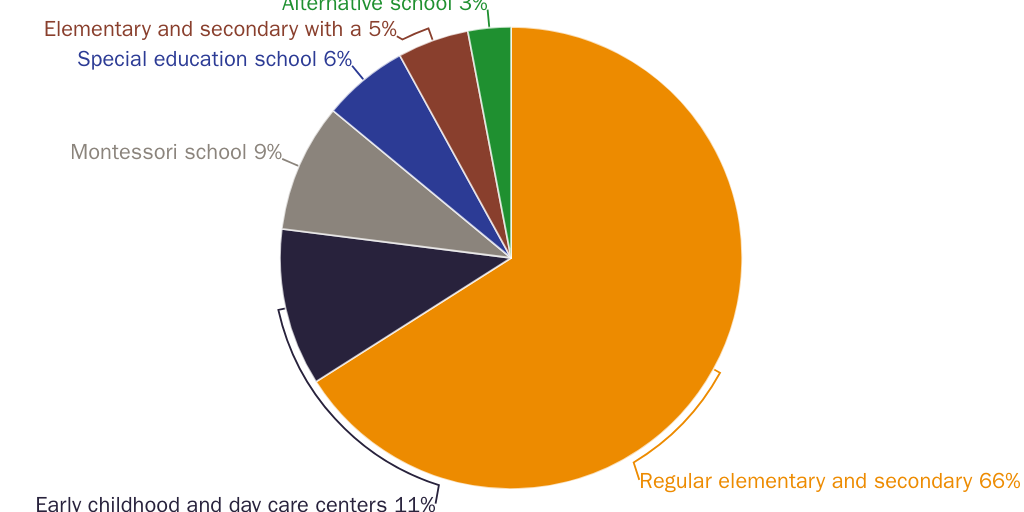
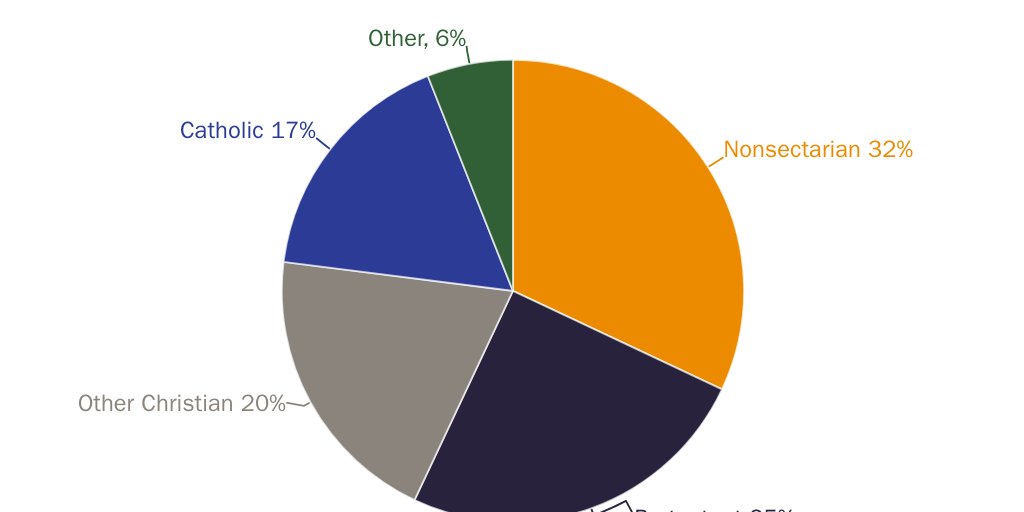
Figure 13 shows that in terms of religious affiliation, 32% of schools were nonsectarian, 25% were Protestant, 20% were other Christian (i.e., Christian, Episcopal, or Greek Orthodox), 17% were Catholic, and 6% were of other religions, including Jewish and Islamic.
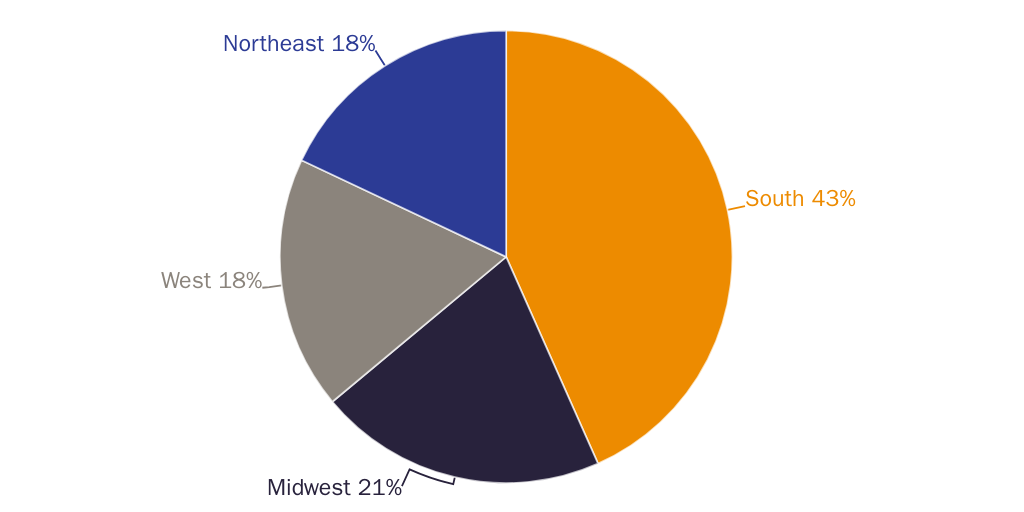
Looking at responses by region (Figure 14), 43% of schools were located in the South, 21% in the Midwest, 18% in the West, and 18% in the Northeast.
Limitations
It is possible that responding schools self-selected in a manner that correlated with enrollment, skewing our results. It is also unclear which way the bias would run. Schools losing students might be more likely to respond to bring attention to their plight, but schools gaining students might be more likely to respond if they wish to tout their success. Schools that lost students would probably have more reason to respond than schools that gained students—the need for help might create a sense of urgency that success would not. This would cause our results to understate enrollment gains. But more research is needed to be very confident about response bias. It should also be noted that the PSR contact list is large but not comprehensive; no school is required to submit data to the PSR, and if unlisted institutions were more or less likely than institutions on the list to have increasing or declining enrollment, it would bias our results. Nonetheless, we do not have reason to believe that this is the case. Unlisted schools could be especially important given the recent surge in the growth of microschools, which are very small and might not be known to the PSR. Regarding negative enrollment, respondents almost certainly exclude closures. Though we received emails from 11 people notifying us that their schools had closed, we do not know how many schools might have closed, which would constitute total enrollment losses. We also did not include schools without electronic contact available—email or telephone—which exist but likely serve communities such as the Amish that would tend to see changing enrollment due to changing numbers of school-age children, not parents sending their children to different schools. We can confidently conclude that we tended to see enrollment gains in schools on the 2023 PSR list, which, given its size, likely captures a representative sample of the private schooling market.
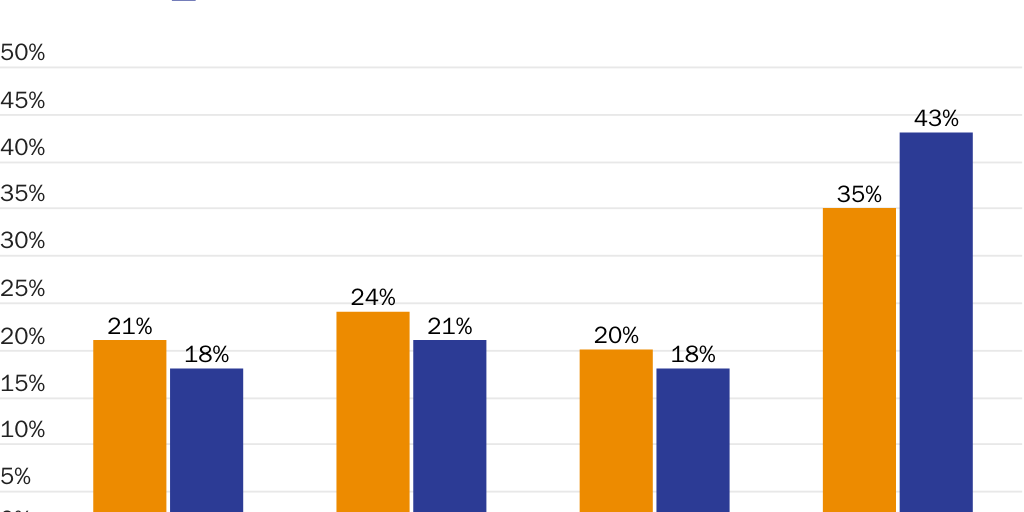
As a robustness check, we have an indication that our sample is roughly representative of the country. The weighted regional shares of schools in our sample and of private schools nationally are roughly the same. In 2021, Northeastern institutions accounted for 21% of all private schools and 18% of our survey respondents. Midwestern schools were 24% of schools and 21% of our survey. The South accounted for 35% of all private schools and 43% of our survey. Finally, schools in the West accounted for 20% of private institutions and 18% of our respondents.
Conclusion
Private school enrollment nationwide appeared to grow for the fourth consecutive year between the 2023–2024 and 2024–2025 school years, but the rate of growth appears to be decelerating. Several factors might be driving this trend, including individuals seeking education consistent with their values pushing enrollment upward, and concerns about the cost of private education holding it down.
Any questions about this report can be sent to Cato Center for Educational Freedom director Neal McCluskey.
About the Authors


This work is licensed under a Creative Commons Attribution-NonCommercial-ShareAlike 4.0 International License.