Study

2021 Arms Sales Risk Index

This year, the report includes a special section focused on the risks of small arms and light weapons sales.

January 18, 2022 • Study
Join the Conversation
Small arms and light weapons seized by the Syrian government

2021 Arms Sales Risk Index

This year, the report includes a special section focused on the risks of small arms and light weapons sales.

January 18, 2022 • Study
Join the Conversation

Introduction

To promote debate and help improve U.S. decisionmaking about arms sales, we created the Arms Sales Risk Index, now in its fourth year. By measuring the factors linked to negative outcomes of arms sales, such as dispersion, diversion, and the misuse of weapons by recipients, the index provides a way to assess the risk involved with selling arms to another nation. Though this sort of risk assessment is by no means an exact science, the Arms Sales Risk Index can help policymakers consider the risks more rigorously and make better decisions about which nations should and should not receive U.S. weapons. This index solely focuses on the risks of weapons sales, something that U.S. administrations routinely downplay.

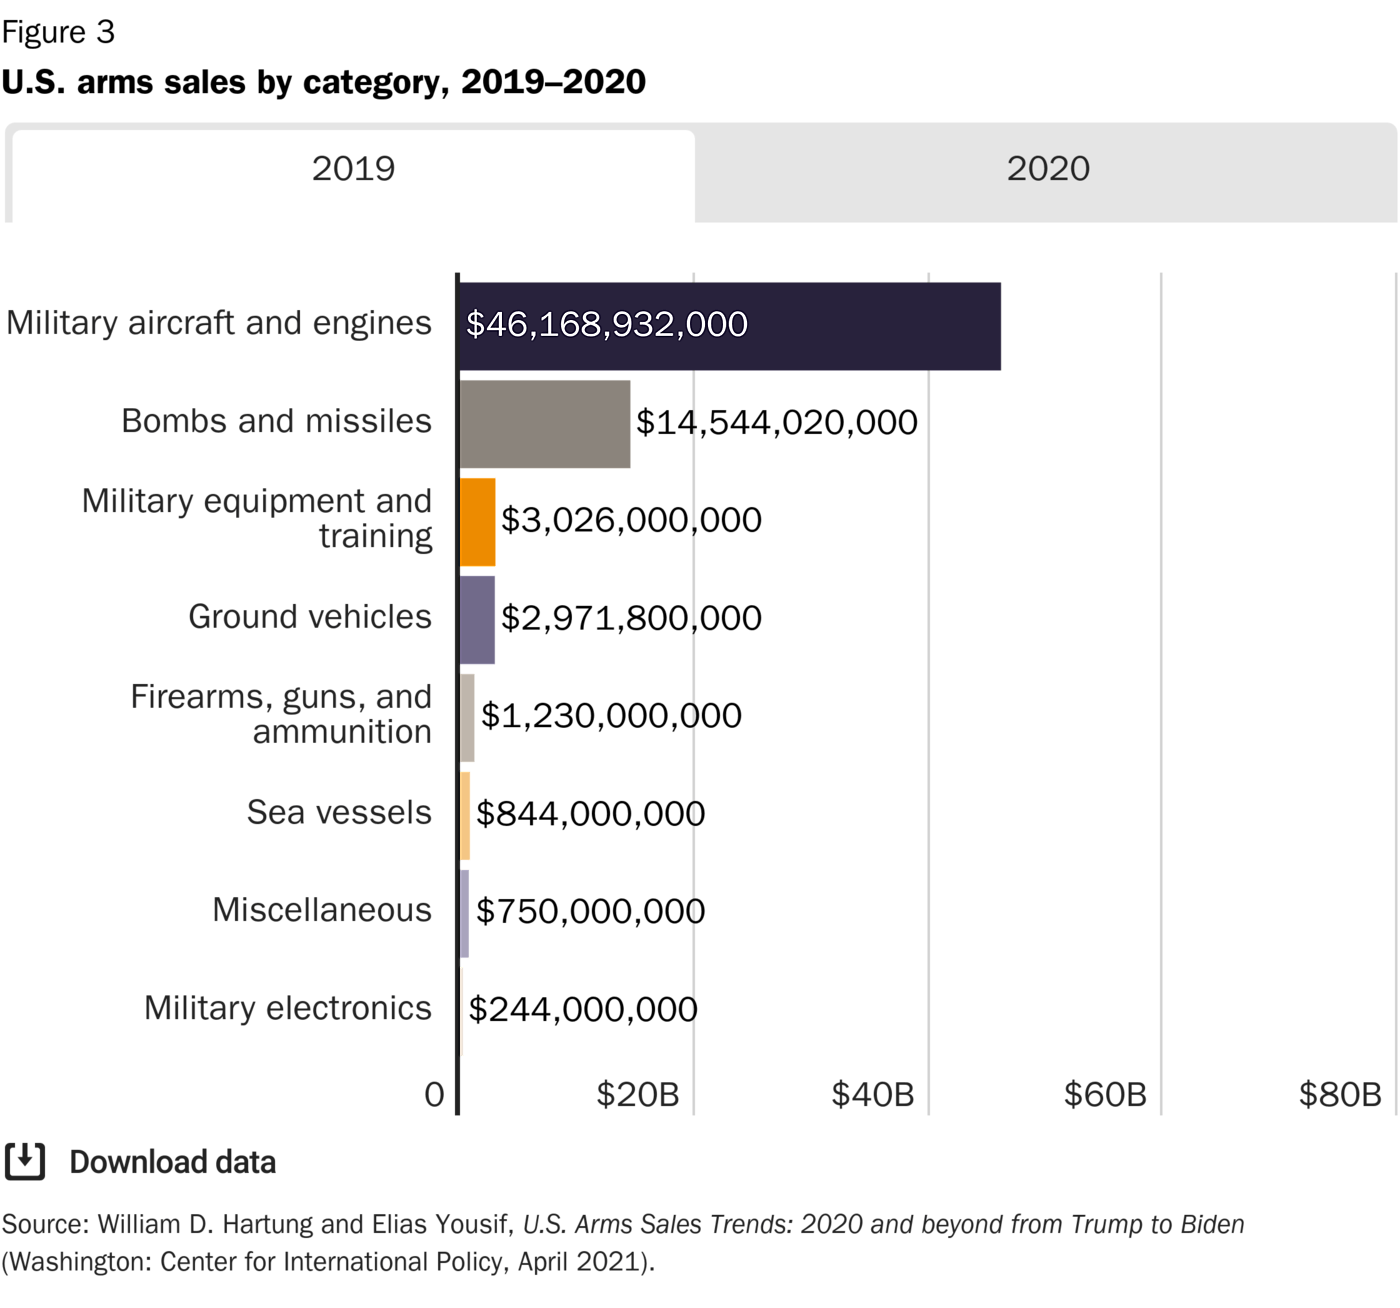
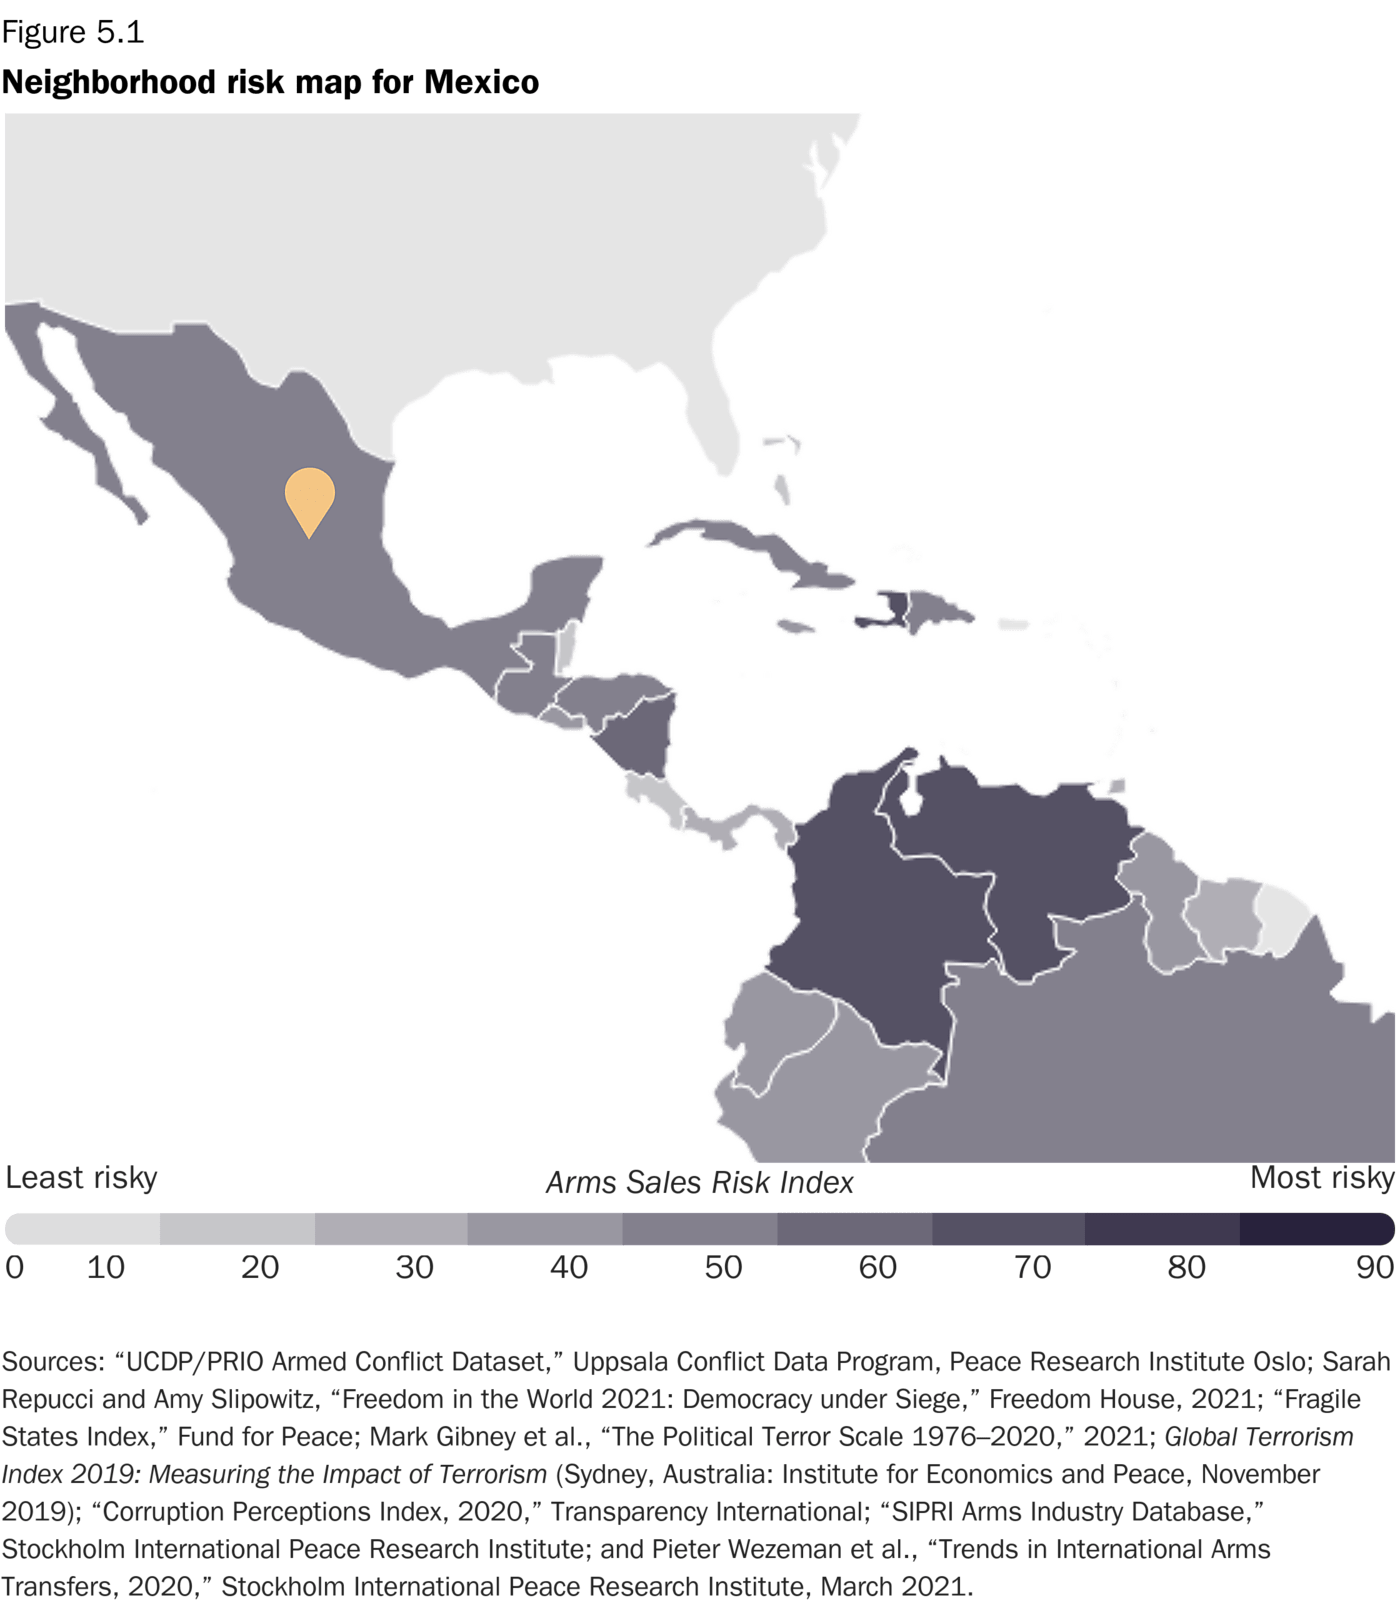
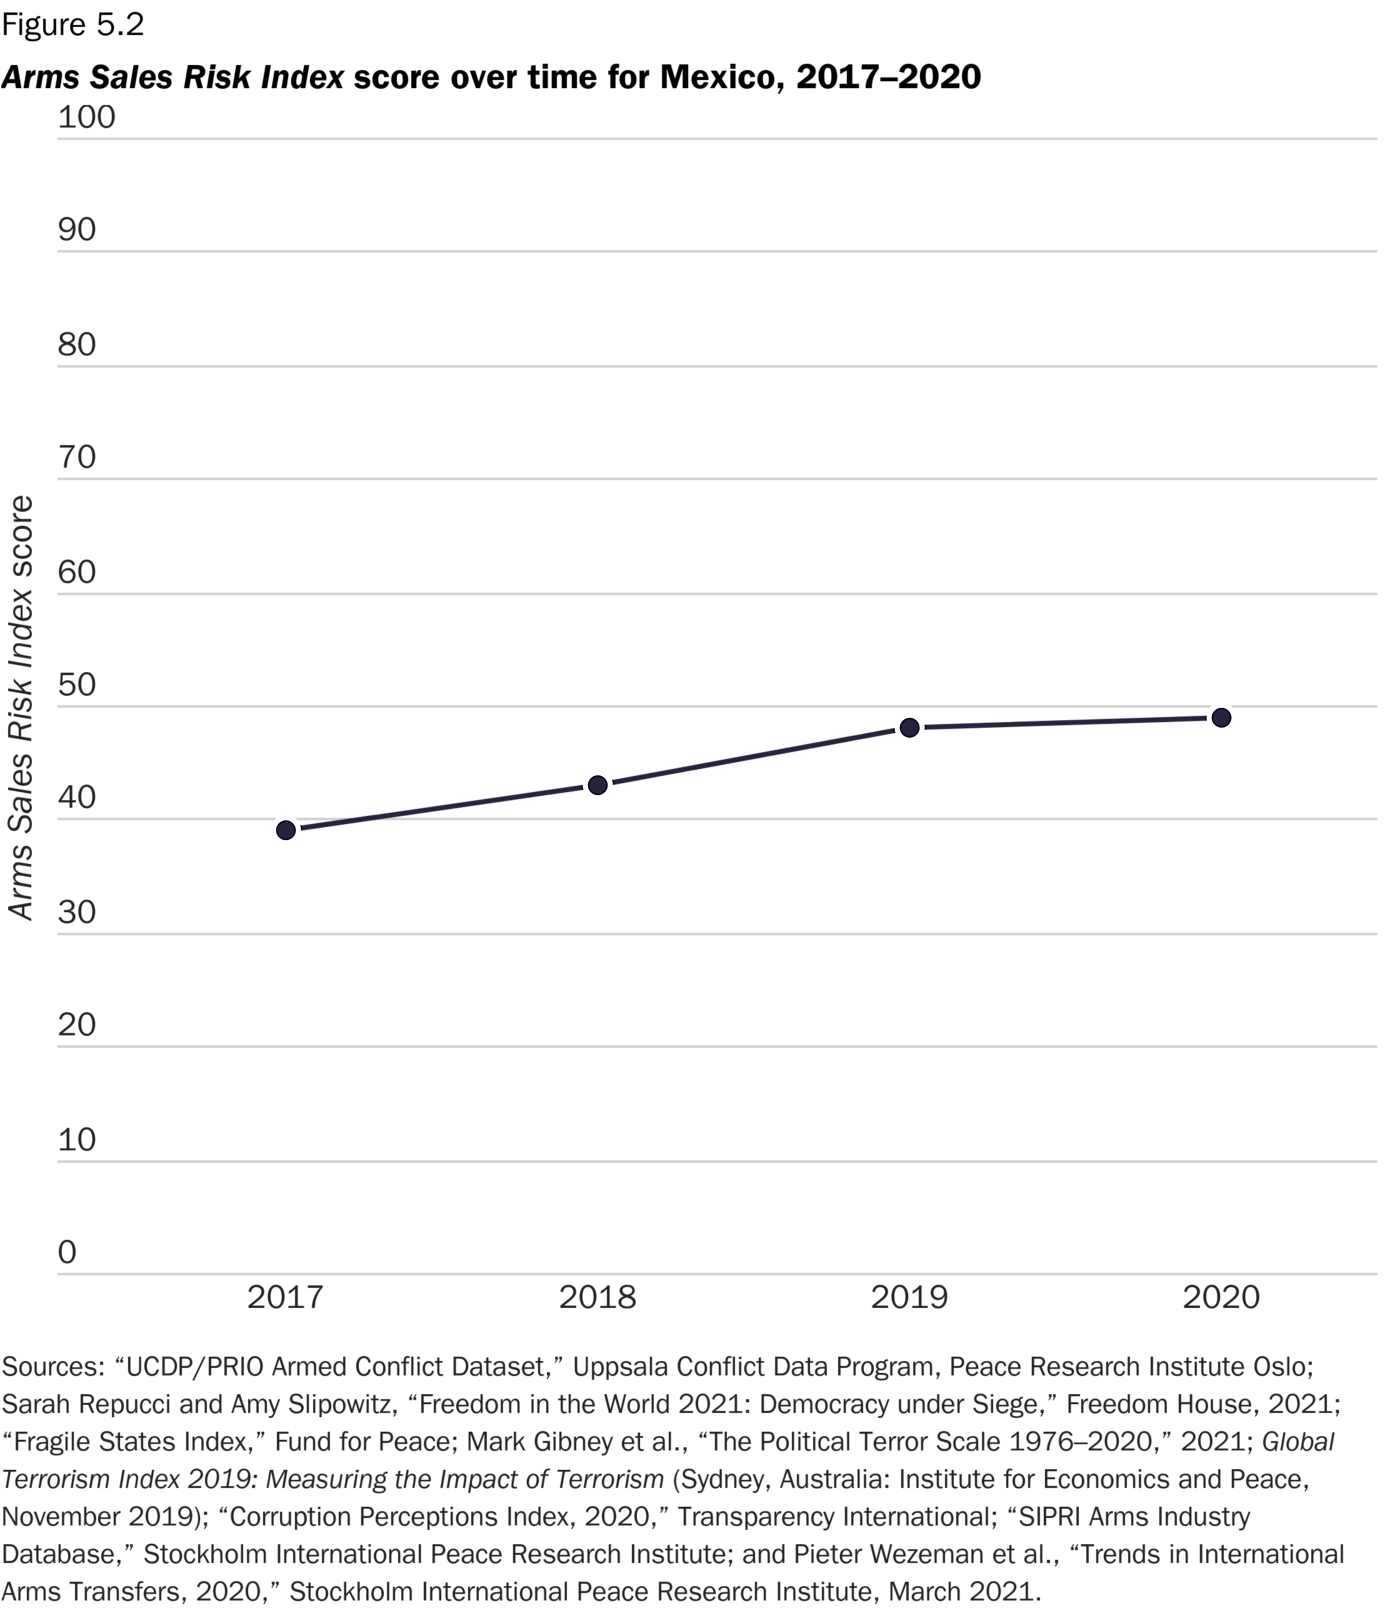
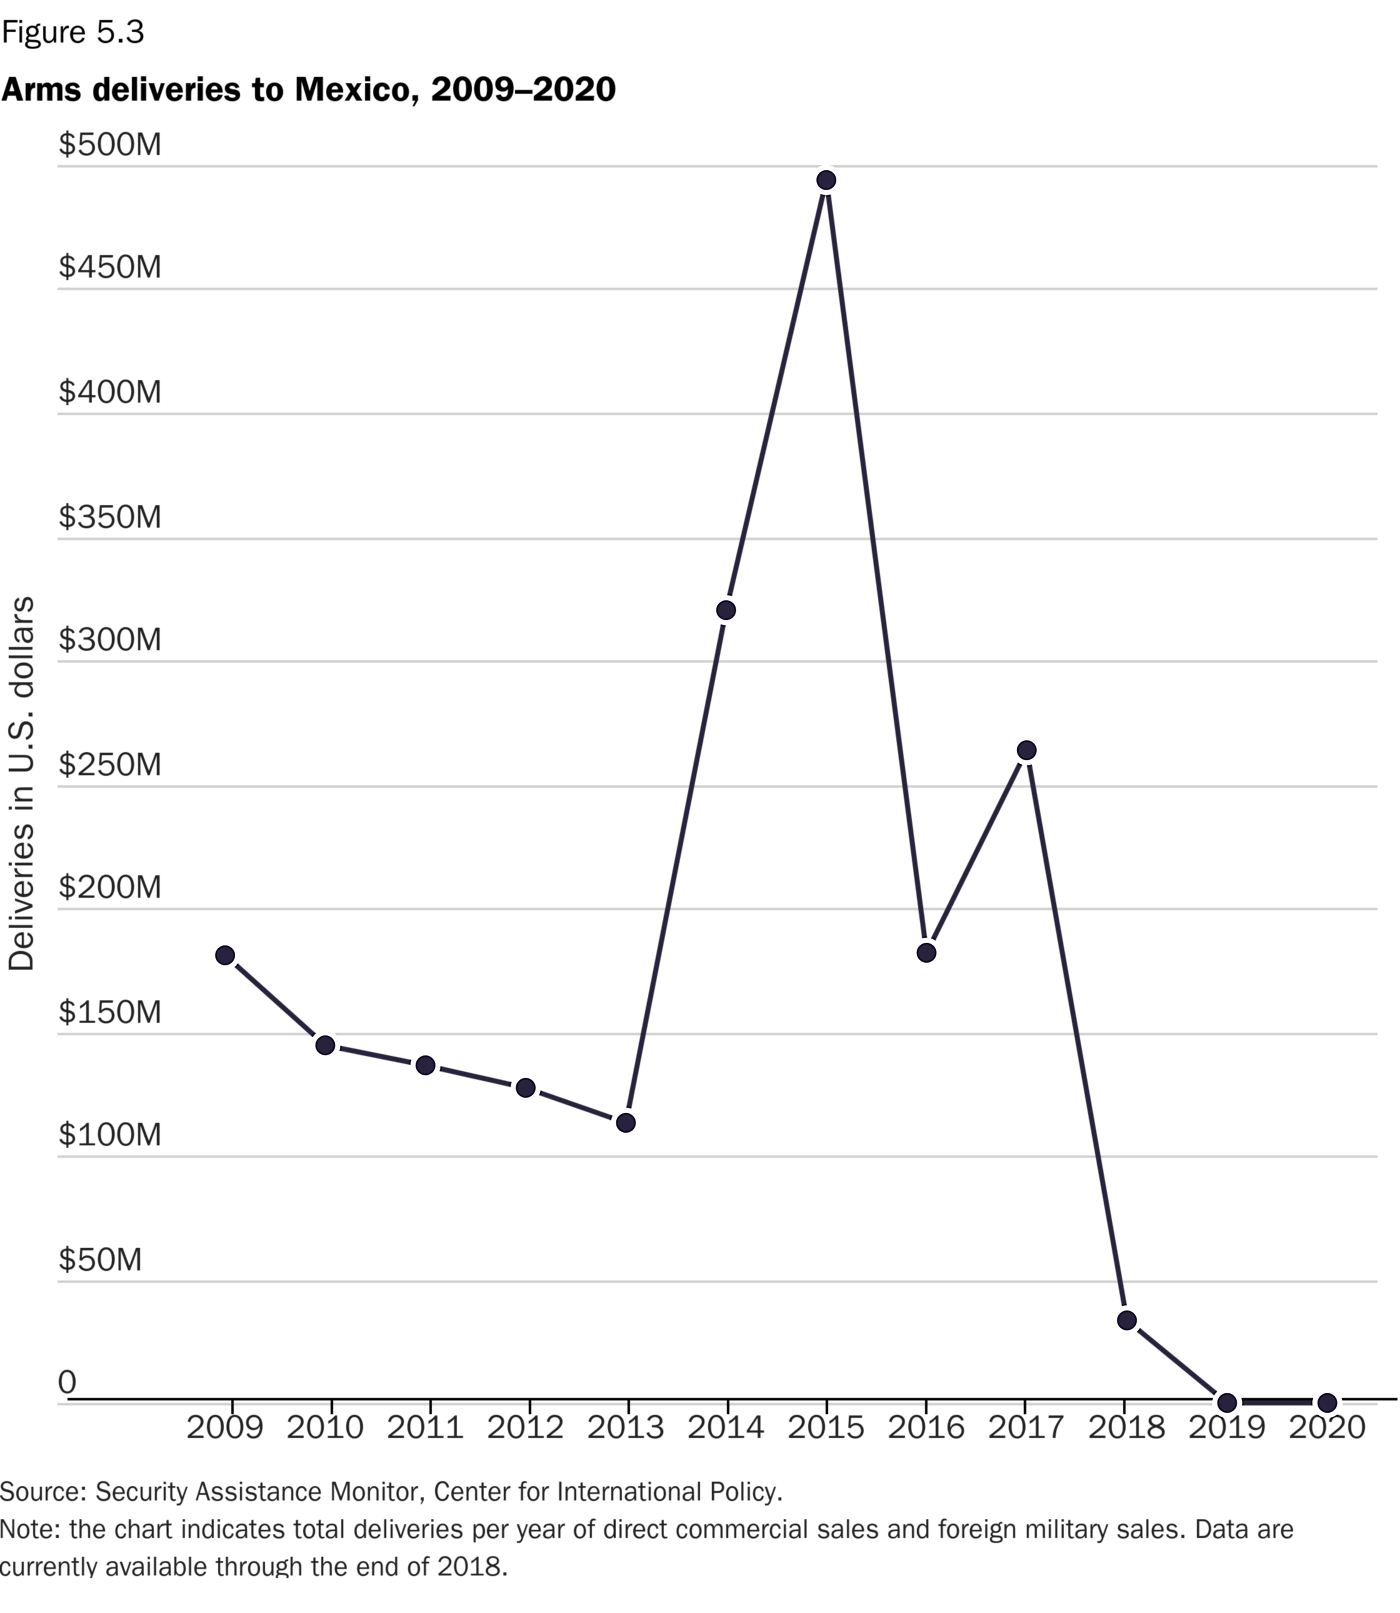
This year, our report includes a special section focused on the risks associated with the sale and transfer of small arms and light weapons (SALW). Though major conventional weapons like fighter jets, anti‐​aircraft missile systems, and tanks comprise most U.S. arms sales from a financial perspective, SALW are far more likely to wind up in the wrong hands and to be used in ways that the United States does not intend. Despite this, more work remains to document the connection between the sales of SALW and diversion, diffusion, human rights violations, civilian casualties, and other negative consequences. To stimulate more discussion about the dangers of SALW and to encourage further research, we have assembled three case studies to demonstrate the links between risk factors, the sales of small arms, and the negative outcomes of these sales. We illustrate these negative outcomes from the studies of Mexico, Ethiopia, and the Philippines.

We invite scholars and policymakers to read this report and download the data for further analysis.

Related Event

Reducing Risk from Arms Sales

April 1, 202212:00 - 1:00 PM EDT

Representative Sara Jacobs (D‑CA), Cato’s Jordan Cohen, and Jeff Abramson from the Arms Control Association will discuss the 2021 Arms Sales Risk Index and current efforts to weigh and mitigate risks that the sale of U.S. weapons can pose. The discussion will be moderated by Cato’s Eric Gomez.

The United States remains the world’s dominant exporter of weapons. The U.S. share of the global arms market in 2020 was 41 percent.1 Since 2009, the United States has approved over $1 trillion in weapons sales and delivered roughly $736 billion worth of weapons to 167 countries across the Obama, Trump, and Biden administrations.2 Our risk index solely focuses on the risks from sales. While there are possible counter considerations, risk from weapons sales is something that U.S. policymakers historically devalue.

President Donald Trump’s zeal for arms sales was well documented. Under his watch, the U.S. portfolio of clients grew significantly riskier on average compared to the two previous administrations. Trump took steps that portend to increasingly risky arms sales in the future.3 His revision of the Conventional Arms Transfer Policy, for example, emphasized the importance of the economic benefits of arms sales over other considerations.4 Also, his White House ordered the executive branch to streamline arms sales processes to speed up approval and delivery. Trump “unsigned” the (as yet unratified) Arms Trade Treaty, signaling U.S. disinterest in working with the United Nations (UN) to grapple with the dangers of small arms.5 In 2018, the Trump administration eased arms export rules, moving many “non‐​military” items from categories I–III on the United States Munitions List (USML) to the Commerce Control List, encompassing firearms, chemical and biological weapons, and ammunition/​ordnance, allowing them to be sold via the Direct Commercial Sales process with little government oversight.6 The USML contains 21 categories and determines what type of license each weapon category requires.

By easing export rules and moving these items to the Commerce Control List, there is less oversight in security risk for selling items in these categories. Items in categories I–III include semiautomatic firearms, small arms ammunition, shotguns, nonlethal grenades and projectiles, optical sighting devices, and firearm production equipment. Importantly, not all weapons were moved over. The ones that weren’t include those that are “inherently military and otherwise warrant control on the USML.” Additionally, weapons were not moved if they were “common to non‐​military firearms applications” that “provide critical military or intelligence advantage” to the United States and are almost exclusively available from the United States.7 The Trump administration also sought to loosen export policies for military drones, allowing their sale to various countries, including the United Arab Emirates, Jordan, and Saudi Arabia.8

The Biden administration, unfortunately, has picked up where the Trump administration left off.9 Though the new administration has evinced some concern about Saudi Arabia, it has shown little interest in a more cautious approach to arms sales. It is pushing ahead with F‑35 Lightning II aircraft sales to the United Arab Emirates, has approved the vast majority of weapons for Saudi Arabia agreed upon by the Trump administration, and has greenlit sales to Egypt, the Philippines, and Israel, all countries with troubling human rights records.10 Moreover, the Biden administration has still not signaled a recommitment to the Arms Trade Treaty and has not reversed the Trump administration’s policy on drone exports.

Looking specifically at SALW sales, we estimate that SALW have accounted for roughly $228 billion (17.5 percent) of the $1.3 trillion in U.S. arms sales authorizations since 2009.11 According to the UN, nearly half of all violent deaths between 2010 and 2015 involved small arms.12 The biggest customers for U.S. SALW include safer U.S. allies and partners such as Japan and South Korea but also riskier ones, including Turkey, Egypt, Singapore, and Colombia.

The export of SALW has become more troubling recently because more of these weapons are now being sold via the Direct Commercial Sales channel rather than through the Foreign Military Sales process. This is the result of moves by both the Obama and Trump administrations to expedite arms sales by moving additional weapons from the State Department–led U.S. Munitions List to the Commerce Department’s Commerce Control List. The sale of weapons on the Commerce Control List requires comparatively little oversight and is far less transparent than government‐​to‐​government sales that go through the Foreign Military Sales process. Unlike Foreign Military Sales transactions, which require review and approval by the Pentagon and State Department, Direct Commercial Sales deals run through the Department of Commerce and do not require notification of Congress. Once a company has an export license from the State Department, it can sell weapons to companies and governments around the world. The regulations require only that the end customer does not appear on a list of known criminals. As a result, weapons such as handguns, man‐​portable air defense systems, ammunition, light artillery weapons, rockets, grenades, grenade launchers, and mortars below 100 mm caliber can be sold from contractor to country with little oversight.

Since 2016, Congress has made considerable, though ultimately ineffective, efforts to exert more influence over arms sales. These began during the Obama administration with legislative efforts sponsored by Sen. Rand Paul (R‑KY) and the Senate Foreign Relations Committee and Rep. Ted Lieu (D‑CA) and the House Foreign Affairs Committee to stop sales to Pakistan and Saudi Arabia.13 During Biden’s first year in the White House, two potentially important pieces of legislation have emerged. Sens. Chris Murphy (D‑CT), Mike Lee (R‑UT), and Bernie Sanders (I‑VT) introduced the Safeguarding Human Rights in Arms Exports Act of 2021 in the Senate in May 2021,14 and Rep. Gregory Meeks (D‑NY) put forth the Safeguarding Human Rights in Arms Exports Act of 2021 in the House of Representatives. Rep. Ilhan Omar (D‑MN) also proposed the Stop Arming Human Rights Abusers Act, which would increase bureaucratic oversight over the arms sales process.15 Omar’s legislation would expand on existing policies such as the Leahy Law to prevent U.S. assistance to human rights abusers, amplify the importance of human rights abuses in the sales approval process, and potentially prevent the sales of weapons to dozens of nations that currently buy U.S. arms.

Mapping Risk

We constructed the Arms Sales Risk Index by identifying four different causal pathways by which arms sales might lead to negative outcomes. These four “risk vectors” include a country’s level of corruption, its stability, its treatment of its people, and the level of conflict, both internal and external, in which it is engaged. To measure these and to calculate the overall risk score for each nation, presented in Table 1, we average their scores on six independent indices. The result is a score for every nation that can range from 1 (lowest risk) to 100 (highest risk). (See Appendix A for a complete methodology.)

Corruption: Corruption makes it more likely that weapons will be stolen or sold to unintended customers. To assess this factor, we rely on Transparency International’s Corruption Perceptions Index, which ranks 180 countries and territories by their perceived levels of corruption.

Instability: Instability also correlates with a much higher likelihood of weapons being stolen or misused by governments and other groups. We assess instability using the Fragile States Index, produced by the Fund for Peace.

Domestic human rights: States that have a poor record of human rights and/​or regularly use violence against their own citizens pose a greater risk of misusing weapons. We rely on two indices to measure these factors: Freedom House’s Freedom in the World index and the U.S. Department of State’s Country Reports on Human Rights Practices, as reported by the Political Terror Scale.

Conflict: States engaged in conflict are inherently riskier when it comes to factors such as dispersion, blowback, entanglement, and human rights abuses. To assess these risks, we rely on the Global Terrorism Index and the Uppsala Conflict Data Program/​Peace Research Institute Oslo Armed Conflict Dataset.

Figure 1 shows the level of risk throughout the world; high‐​risk zones are somewhat predictable year to year. Table 1 provides a global view of risk index scores. In 2020, the average risk score was 40.

Figure World Arms Sales
Arms Sales Risk Index Score

According to the Security Assistance Monitor, the United States brokered weapons sales through the Foreign Military Sales process worth over $143 billion in 2020, a 59 percent increase over 2019.16 Since 2009, the United States has authorized over $1 trillion in sales to foreign countries (though historically the actual dollar figure of weapons delivered has been significantly less than what was initially authorized).17 As Table 2 shows, the United States’ five biggest customers have purchased an average of $14 billion in major conventional weapons since 2009. Figure 2 demonstrates that the United States sells to a variety of clients who are incredibly risky, notably Saudi Arabia.

Biggest customers of U.S. weapons, 2002–2019
Top U.S. customers in arms sales vs. Arms Sales Risk Index

From a total dollar value perspective, military aircraft and their associated parts make up most U.S. exports over the past two years, with bombs and missiles coming in second and ground vehicles third. Figure 3 provides a detailed breakdown of arms sales categories for 2019 and 2020.

The total dollar value of an arms sale, however, is not necessarily the best metric by which to measure either its risks or benefits. The balance of military power is tricky to measure, and different weapons systems carry different risks. Though military aircraft could be used to engage in an interstate war, a civil war, or an air campaign against terrorist groups, for example, aircraft are also at the lowest risk for consequences such as diversion. On the other hand, the “firearms, guns, and ammunition” category, which acts as a catchall for SALW, includes equipment that is frequently at high risk of diversion and often used to carry out human rights abuses. Thus, although the overall dollar figures involved with SALW sales are often orders of magnitude lower, the risks with respect to increased violence and black marketeering are likely to be higher.

U.S. arms sales by category, 2019–2020
U.S. arms sales by category, 2019
U.S. arms sales by category, 2020

Top 10 Arms Exporters: Comparing Responsibility and Risk

The United States is not the only nation engaged in the international arms trade. Nor does it have the riskiest customer base when compared with other leading arms exporting nations. For each of the top 10 arms exporters, we used arms sales data from the Stockholm International Peace Research Institute and our index to calculate the risk score of the typical recipient nation (see Appendix A for details). As Figure 4 shows, China sells to the riskiest customer base; its average customer has a risk score of 75. Moreover, Figure 4 shows that, apart from Spain, South Korea, and Russia, the major arms exporting nations all sold to a riskier portfolio of clients in 2020 than in 2019. At the low end of the chart is Spain, whose more responsible approach to arms sales is reflected in an average customer risk score of 13. The United States falls in the middle with a score of 47 during 2020. Though it sells plenty of weapons to very risky clients, including Iraq, Saudi Arabia, and Afghanistan, it also sells its most expensive weapons platforms (like the F‑35) to less risky countries, including allies such as the United Kingdom, Japan, and South Korea.

Average customer risk scores for leading arms exporting nations, 2019–2020

The Risks of SALW Sales

Advanced weapons platforms like the F‑35 grab the headlines and account for the bulk of the revenues from U.S. arms sales (nearly 75 percent of foreign military sales by dollar value are sales of advanced platforms), but SALW account for the bulk of the problems.18 Though the weapons may be small, the numbers involved are very large: the Small Arms Survey estimates that there are roughly a billion firearms in circulation and 683 million unregistered handguns in the world today.19 Technologies with the potential for devastating misuse, such as facial recognition software, geospatial reasoning technology, and man‐​portable air defense systems all fall into the SALW category and are sold through the Direct Commercial Sales program rather than the more heavily regulated Foreign Military Sales program. Moreover, unlike the F‑35, which will be sold only to close U.S. allies, the United States sells SALW to almost any country that wants to buy; 167 different countries have purchased SALW from U.S. companies since 2009.20 As a result, the potential negative effects of the sale of SALW are significant and far reaching. We highlight three of the most deleterious risks that arise.

SALW Sales Risk Empowering Authoritarian Governments

First, selling SALW risks empowering oppressive and authoritarian governments, enabling them to harm their citizens with the appearance of the United States’ blessing. Providing weapons to governments that treat their citizens poorly increases the power of the state at the expense of its citizens, allowing them to respond to unrest and political challenges with violence. The fact that the United States has blessed the purchase of the weapons, even implicitly, makes life that much harder for oppressed groups. For example, in 2019, the United States completed a $72 million sale of automatic rifles and parts to India despite Indian and U.S. activists’ criticism of President Modi’s support for discriminatory policies against Muslim minorities.21 Though the United States does not endorse Modi’s treatment of Muslim minorities, the lack of restrictions over arms sales to India signals that Washington believes that other issues are more important. Alternatively, it could mean that the United States does not think suspending weapons sales provides it leverage, which begs questions about what these sales are actually for.

This risk of empowering bad government actors persists even when the United States takes an active interest in the recipient nation’s use of the weapons. After the 9/11 terrorist attacks, the United States made concerted efforts to work with countries around the world, many with poor human rights track records, on counterterrorism campaigns targeting local franchises of al‐​Qaeda and other extremist groups. To encourage cooperation, the United States provided many of the countries with security assistance and sold many of them a wide range of SALW. In some cases, partner nations conducted operations against established terrorist organizations. In other cases, however, the “partner” nation used the weapons to conduct its own campaigns against political opponents.22 For example, during the war on terror, the United States sold the Nigerian government hundreds of millions of dollars’ worth of weapons to combat the terrorist group Boko Haram. Though the Nigerian government has waged an aggressive campaign against the group, the Nigerian military has also routinely harassed political opponents and carried out unlawful killings of civilians.23 Given its inability to effectively monitor how customers use the weapons it exports, there is no way for the United States to prevent recipients from using the weapons in ways that violate human rights.

An easy first step toward mitigating this risk would be to stop selling SALW to countries with authoritarian governments and poor human rights track records. This is precisely the step that the Safeguarding Human Rights Act of 2021 envisions. Since 2009, the United States has sold SALW to 40 of the 53 countries that Freedom House has rated as “Not Free.” The list includes Thailand, for example, which human rights organizations report has protected internal security forces from accountability for abuses, including extrajudicial killings and disappearances.24 More pointedly, our data set also contains 41 countries in which the governments routinely engage in political violence against their citizens, according to the U.S. State Department, 15 of which have been U.S. weapons customers in the past 10 years, including the Philippines and Turkey.25

SALW Sales Risk Empowering Criminal Organizations

Second, selling SALW can empower criminal gangs, unregulated militias, and terrorist organizations, contributing to increased violence, the erosion of law and order, and economic disruption. Unfortunately, SALW are particularly attractive to groups that use violence, and the diversion of the weapons from their intended recipients to bad actors of various kinds is common. As a UN Secretary General report noted in 2015:

In particular, the diversion of weaponry is a colossal problem in many parts of the world. It allows rebels, gangs, criminal organizations, pirates, terrorist groups and other perpetrators to exponentially bolster their power. Diversion may occur as a result of a transfer without proper controls, unauthorized retransfer, thefts from poorly secured stockpiles, hand‐​outs to armed groups or barter involving natural resources.26

In Papua New Guinea, for example, which has received over $1.4 million in U.S. firearm sales since 2009, thousands of small arms, including American M‑16 rifles, have found their way to illegal mobs and militias, amplifying intertribal violence and causing thousands to flee their homes.27

Corruption, state fragility, and terrorism all heighten the prospects for weapons getting into the wrong hands and being misused. Nonetheless, the United States rarely halts arms sales to countries that score high on these factors.28 Twenty‐​nine countries in our data set fall into the Fragile States Index “Alert” category of the most fragile states, but the United States has sold $15 billion worth of weapons, including SALW, to them since 2009. As a result, countries that fight wars are logically among the biggest customers of these weapons. Of the 33 countries engaged in active military conflict, the United States has sold weapons worth $16 billion to 28 of them in the past decade. Likewise, over the past 10 years, the United States has sold $88 billion in arms to the 45 countries in which the effects of terrorism are greatest, according to the Global Terrorism Index.

SALW Sales Risk Amplifying Violence and Conflict

Finally, U.S. SALW can amplify violence and conflict in the countries that buy them. Though the news tends to focus on nuclear weapons, missiles, or other high‐​tech systems, SALW are used much more frequently in the vast majority of conflicts around the world and thus generate most casualties.29 Research has found that increasing flows of small arms into a country lead to increased homicide rates, with the effect most pronounced in nations with low state capacity.30 Where guns are plentiful, cheap, and easy to get, it becomes easier for people to use guns to commit crimes and other violent acts. And when a state is already dealing with corruption, internal conflict, or terrorism, the chances are very good that adding guns via arms sales would exacerbate the violence.31

In Papua New Guinea, the influx of light weapons has militarized long‐​standing communal conflicts. In other countries struggling with criminal or terrorist groups, like the Philippines or Colombia, the governments have encouraged private citizens and militias to arm themselves, leading to thousands of civilian deaths and widespread violence.32 In an extreme case, as Rwanda illustrated in the early 1990s, the proliferation of small arms can enable genocide.33 As the UN High Commissioner of Human Rights Zeid Ra’ad Al Hussein noted in 2015, “Small arms do not only make easy the taking and maiming of lives, but also kill economies and the social bonds on which every kind of collective institution and progress rely.”34

In the case studies that follow, we illustrate how SALW sales may ultimately undermine U.S. goals and principles by empowering authoritarian governments and criminal organizations while amplifying violence and conflict abroad.

Case Study 1: SALW and the Murder Rate in Mexico

As Figures 5.1 and 5.2 show, Mexico’s 2020 risk index score is 49, well above the global average score of 40. In Figure 5.4, the presence of three key risk vectors—corruption, domestic human rights abuses, and instability—suggest that SALW transfers present a unique challenge for the country. In Figure 5.3, since 2009, the United States has authorized over $18 billion in weapons sales to Mexico and, according to Security Assistance Monitor’s available data, between 2009 and 2013, over 32 percent of those sales were SALW.35 Assuming that the proportion has stayed the same, the United States has authorized almost $6 billion in SALW sales to Mexico since 2009. The proliferation of criminal organizations within Mexico, coupled with an ineffective security sector response, has resulted in destabilizing levels of violence, which disproportionately affect Mexican civilians. The circulation of U.S.-sourced small arms has contributed directly to this dynamic, suggesting that continued SALW transfers may risk contributing to further increases in violence and state fragility.

Neighborhood risk map for Mexico
Arms Sales Risk Index score over time for Mexico, 2017–2020
Arms deliveries to Mexico, 2009–2020
Arms Sales Risk Index vector component scores for Mexico

Vector 1: Corruption Leads to SALW Dispersion to Illicit Actors

In Mexico, corruption affects the performance of security forces across all levels of the security sector. The 2020 Corruption Perceptions Index scores Mexico a 31, a number that translates to 75 in the 2021 Arms Sales Risk Index (indicating that Mexico scores worse than 75 percent of other nations with respect to corruption). High levels of corruption both degrade security forces’ capacity to respond to threats and raise the likelihood that legally sold arms will be transferred to illicit actors.

Across the country, police and military actors have routinely been implicated in corrupt activity. A 2020 International Crisis Group report found that 80 percent of Mexican police officers believe that “their fellow officers engage in ‘illegal’ behavior.”36 A 2018 report by the same organization argued that widespread corruption within the police and armed forces resulted in ineffective response to criminal activity as “commanders … reportedly violate the law in policing operations, commit crimes themselves, and coerce subordinates into complicity.”37

Beyond degrading security forces’ responsiveness, widespread corruption is associated with dispersion of small arms to illicit actors. In 2016, research by the American Friends Service Committee suggested that corruption within Mexico’s police and military meant that “legal arms sales frequently end up arming criminal gangs and criminal conduct directly.”38

Despite these reports, accountability for individual police and military units implicated in criminal activity is rare. While there are some cases of accountability, such as when the city of Acapulco disarmed its police force “due to criminal infiltration” in 2018, overall reporting suggests that there is widespread impunity for security force involvement in criminal activity.39

Police and the court system in Mexico are ineffective at ensuring justice. On one hand, despite consistent allegations of police brutality and torture of civilians, only six Mexican police officers were convicted for torture offenses between 2007 and 2015.40 On the other hand, police in Mexico are also limited in their ability to ensure justice. The Congressional Research Service reported that within the past five years, “judges have had to let many defendants go free, even if they may have been guilty, due to police misconduct in gathering evidence.”41

The challenge of widespread corruption and impunity for rank‐​and‐​file security forces has been mirrored at higher levels. U.S. prosecutors arrested a former public security minister in 2019 and a former defense minister in 2020 on charges of corruption and money laundering. While the latter charges were ultimately dropped following pressure from the Mexican government, analysts suggested that the arrests were indicative of pervasive corruption at senior levels of government. As of 2021, a reported 20 former Mexican state governors were under investigation for corruption.42

Overall, evidence of corruption and widespread impunity at all levels of Mexico’s security forces suggests that there are few checks against security force misconduct. The risk of arms dispersion remains high with few reliable mitigation measures.

Vector 2: SALW Used in Police and Military Human Rights Abuses

Impunity stemming from corruption is closely linked to a second risk vector: state behavior toward its citizens. In Mexico, the implication of security forces in human rights abuses suggests that the risk of small arms misuse against civilians remains high.

Mexico has a troubled history of security force involvement in human rights violations. A Congressional Research Service report found that state actors regularly collude with criminal organizations “to commit serious human rights violations against civilians in Mexico.”43 According to a December 2020 Washington Post article, more than 79,000 people have disappeared in Mexico, with most of those disappearances occurring since 2006.44 In 2014, 43 student teachers from a college in Ayotzinapa “disappeared.” Like other incidents, the Mexican police coerced witnesses, marring the subsequent investigation.45

More prosaically, security forces are routinely accused of using excessive force against civilians in carrying out operations intended to target criminal activity. The American Friends Service Committee argues, “The militarization of Mexican police has been accompanied by a dramatic rise in reports of human rights violations by federal and state security forces, and the vast majority of these have not been judicially investigated.”46

These ongoing violations suggest that small arms transferred to Mexican security forces have a high likelihood of being used against civilian populations. For this reason, U.S. policymakers have sought to temper U.S. financing of arms sales for use by Mexican security forces.

Between fiscal year 2008 and 2015, 15 percent of all U.S. security assistance provided to Mexican military or police forces went through the Mérida Initiative, which is the United States’ primary security cooperation program with Mexico. This security assistance was made conditional on the State Department’s verification of Mexican compliance with human rights standards. Beginning in fiscal year 2015, human rights reporting switched from the Mérida Initiative to traditional Foreign Military Financing monitoring. As a result, legislation no longer requires U.S. human rights reporting in Mexico, and Congress often fails to receive monitoring information from the State Department.47

Vector 3: Instability Drives Demand for Illicit SALW Transfers

Although conditioning U.S. arms transfers to the Mexican government may help reduce risks stemming from state corruption and abuse against civilians, these efforts may not address the effects of a third risk vector: widespread instability stemming from organized crime and drug trafficking. The presence of this third risk vector drives demand for SALW with negative implications for civilian safety.

Over the past 20 years, Mexico has struggled with increasing violence stemming from organized crime and a heavy‐​handed government response. A 2020 Congressional Research Service report estimates that over 150,000 people had been killed since 2006 by criminal organizations or in conflict related to the response against drug trafficking.48

This rise in violence is attributable to increased fractionalization of criminal organizations. Since 2006, the decapitation of several large criminal organizations contributed to the proliferation of smaller groups and caused violence to spike as these breakaway organizations increasingly turned from drug trafficking to fights over territory and coercive rent‐​seeking.49

The International Crisis Group argues that this dynamic worsened in some states, such as Guerrero, as collusion between security forces and criminal organizations led civilians to develop self‐​defense groups. The groups ultimately came to resemble the criminal organizations they sought to counter in contributing to increasing violence against civilians.50

In part, this uptick in violence is sustained through significant transfers of SALW across the U.S.-Mexican border. In 2020, the Mexican government reported that roughly 2.5 million weapons had illicitly crossed the border since 2010.51 Similarly, the U.S. Bureau of Alcohol, Tobacco, Firearms and Explosives found that “70 percent of firearms reported to have been recovered in Mexico from 2014 through 2018 and submitted for tracing were U.S. sourced.”52

This challenge is not new. A 2015 study estimated that approximately 2 percent of all domestic U.S. arms sales between 2010 and 2012 were trafficked across the U.S.-Mexico border.53 Both Mexican and U.S. authorities have flagged the increased number of U.S.-originated .50‐​caliber rifles as a particular concern, noting that these weapons have in some cases allowed criminal organizations to achieve parity of firepower with Mexican security forces.54

The widespread availability of SALW arguably contributes to a cycle of increasing levels of violence and instability driven by criminal activity. Research by the American Friends Service Committee published in 2016 suggests that U.S.-originating small arms “contributed to some 65 percent of the nearly 15 million ‘common crimes’ committed in Mexico from 2011 to 2013, and roughly 56 percent of the 57,000 homicides committed since 2013.”55

U.S. Options to Reduce Negative Outcomes from SALW Trade in Mexico

U.S. policy options to counter the malign effects of corruption, state abuses against civilians, and increased instability in Mexico remain constrained. Despite the United States investing $3 billion since 2007 in security assistance and justice sector reform through the Mérida Initiative, Mexican government actors continue to be implicated in corrupt activity and abuse of civilians while overall violence attributed to criminal activity has increased.56

The continued prevalence of these risk vectors suggests that Washington should further scrutinize its policy toward arms transfers to the Mexican government. Despite congressional restrictions on foreign military financing because of human rights violations, between fiscal years 2015 and 2021, the United States appropriated an average of $5 million in foreign military financing to Mexico annually.57 The United States should consider further curtailment of these appropriations to reduce the risk of weapons misuse or contribution to internal insecurity.

Ultimately, the prevalence of illegal trafficking in domestically purchased U.S. small arms suggests that reductions in foreign military financing, while positive, are not sufficient to resolve the larger challenges stemming from the SALW trade. By publicly curtailing arms transfers to the Mexican government, however, the United States can signal the necessity to improve governance outcomes to address challenges related to criminal activity and be assured that U.S.-granted arms transfers are not misused. Doing so may encourage nascent Mexican government–led reforms to address the factors underlying SALW misuse.

Case Study 2: SALW and State Violence in the Philippines

The Philippines exhibits several factors that suggest it is particularly vulnerable to negative outcomes from SALW sales. With an Arms Sales Risk Index score of 72, as shown in Figures 6.1 and 6.2, the Philippines scores similarly to Iran, Pakistan, and Saudi Arabia, reflecting significant challenges across risk vectors. Shown in Figure 6.4, key risks include pervasive human rights violations committed by security forces, internal conflict stemming from the continued presence of criminal and terrorist organizations, and corruption within the security and justice sectors. Despite these risks, the Philippines is a significant customer of U.S. arms, with over $3.17 billion authorized through Foreign Military Sales and Direct Commercial Sales since 2009, as shown in Figure 6.3. From 2009 to 2013, over 79 percent of the $1.14 billion in arms sales were SALW.58 Holding that proportion constant would mean that the United States has authorized over $2.5 billion in SALW to the Philippines since 2009. While overall sales to the Philippines are unlikely to decline given the nation’s strategic importance to the United States, U.S. policymakers should consider limiting transfers of SALW given the likelihood that these weapons will be misused or diverted and thereby contribute to human rights violations.

Neighborhood risk map for Philippines
Arms Sales Risk Index score over time for Philippines, 2017–2020
Arms deliveries to Philippines, 2009–2020
Arms Sales Risk Index vector component scores for Philippines

Risk Vector 1: SALW Enable Ongoing Violence against Civilians

Since 2016, increased security force abuses against civilians suggest SALW are particularly likely to enable human rights violations in the Philippines. President Rodrigo Duterte’s aggressively prosecuted anti‐​drug campaign has generated widespread allegations of security force complicity in civilian deaths. Recently, the government’s tolerance of excessive force by police to enforce COVID-19 regulations suggests that SALW provided to security forces remain likely to be used against civilians.

Under Duterte, the government has pursued anti‐​drug operations that have resulted in numerous violations of human rights. In the first year of his presidency, 2016–2017, Human Rights Watch estimated that police and unidentified gunmen “killed more than 7,000 suspected drug users and drug dealers.” Critics argue that the scale of violence reflects the government’s disregard for due process and outright encouragement of excessively violent tactics by internal security forces.59 Throughout his time in office, Duterte has issued flamboyant public statements in support of aggressive security force action against criminal organizations. For example, in September 2020, he publicly told his commissioner of the customs bureau, “Drugs are still flowing in. I’d like you to kill there.… Anyway, I’ll back you up and you won’t get jailed. If it’s drugs, you shoot and kill. That’s the arrangement.”60

With the onset of the COVID-19 pandemic, state violence in the Philippines has continued to evolve. The police and armed services, tasked with enforcing the National Action Plan against COVID-19, have faced multiple allegations of excessive force.61 For example, to enforce community quarantine measures, the government destroyed informal housing settlements in the capital of Manila, leaving hundreds homeless.62 Days after the destruction of this housing settlement, the government instituted a full lockdown on the island of Luzon, where Manila is located, making the newly homeless Filipinos de jure lockdown violators.

In a press conference days before the housing settlements were destroyed, Duterte justified violence against quarantine violators, saying: “I will not hesitate. My orders are to the police and military, also the barangay [local administrative units], that if there is trouble or the situation arises that people fight and your lives are on the line, shoot them dead. Do you understand? Dead. Instead of causing trouble, I’ll send you to the grave.”63

A few days after Duterte made these comments, police shot a farmer for violating lockdown orders, creating backlash from activists.64 Police locked other alleged curfew violators in dog cages and forced the violators to sit in the midday sun. The increase in arrests has resulted in an increase of in‐​prison deaths, which activists allege the government underreports.65

Risk Vector 2: Conflict Exacerbates Risks of SALW Dispersion and Regional Violence

In addition to the risks stemming from police misconduct, the Philippines also faces risks from internal conflict. Over the past 60 years, the Philippines has struggled to quell violence from a series of separatist and terrorist organizations active within the country. Continued counterinsurgency operations, exacerbated by security forces’ reliance on civilian self‐​defense organizations, suggest that SALW provided to security forces may be especially at risk of dispersion to nonstate actors, including criminal and terrorist organizations.

The Philippines has a long legacy of conducting counterinsurgency operations against a series of separatist organizations.66 Over the past 20 years, this has included efforts to control and reduce the influence of Islamic terrorist organizations, such as the homegrown Moro Islamic Liberation Front and the Abu Sayyaf Group as well as international groups such as ISIS. Analysts suggest that the Armed Forces of the Philippines and their partners, including the United States, have been relatively successful in securing tactical gains against those organizations, yet overall levels of violence have remained high.67

In an attempt to resolve this problem, the Filipino government has armed local militias despite their propensity toward excessive force.68 Cooperation between security forces and these local organizations raises the risk that U.S. arms transferred to government forces may be dispersed to these militias, many of which have a track record of carrying out extralegal killings and other violence.

Risk Vector 3: Corruption Contributes to Domestic Tension, Worsening Conflicts

The risks of SALW misuse by police and armed forces are exacerbated by the presence of a third risk vector: corruption. The prevalence of corruption within the defense and justice sectors directly affects the capacity of the armed forces and challenges efforts to hold both police and military units accountable for violations. In this context, SALW transfers may be especially risky as governance structures to limit dispersion and misuse are weakened.

At a national level, the Philippines struggles with corruption, ranking among the 25 percent most corrupt nations, according to Transparency International. The 2020 Global Corruption Barometer survey found that 86 percent of Filipino citizens believe that corruption is a problem and that 19 percent have paid a bribe for a public service, 22 percent used personal connections for public services, and 28 percent were offered bribes in exchange for votes.69 This reaffirms a 2011 poll of Filipino citizens suggesting that the defense sector was particularly troubling, with 48.9 percent of respondents indicating their belief that “the military is the most corrupt government agency in the country.”70

Corruption has arguably contributed to negative military outcomes as individual commanders allegedly have received kickbacks from the terrorist organization Abu Sayyaf in exchange for transferring military equipment to the organization. A U.S. analyst has argued that Abu Sayyaf bribed field commanders to allow the group greater freedom of movement and participation in hostage taking.71

In addition to degrading the effectiveness of ongoing counterinsurgency operations, endemic corruption reduces accountability for state actors who engage in violence against civilians. A 2014 Amnesty International report found evidence that police in the Philippines both extracted bribes from civilians and intimidated witnesses of police misconduct into dropping allegations, thus undercutting broader accountability efforts.72 While there are signs that the Philippine National Police’s newly appointed chief may take a more active role in addressing misconduct, continued corruption within the justice sector will be an obstacle to large‐​scale reform.73

The pervasive corruption within the defense and justice sectors suggests SALW transfers to both the police and military may continue to lead to negative outcomes. There is a high risk of SALW dispersion to terrorist organizations during counterinsurgency operations. For police, weak accountability mechanisms against misconduct suggest SALW will continue to be used in abuse of civilians.

U.S. Options for Reducing Negative Outcomes from SALW Trade in the Philippines

Violence in the Philippines is at one of the highest levels in the world. The steady flow of SALW has unintentionally amplified the violence and enabled the Duterte regime to commit grievous human rights violations. Despite those abuses, the U.S. government shows no sign of changing course. Despite growing resistance from Democrats in Congress, the Biden administration confirmed in February 2021 that there are “no restrictions” on arms sales to the Philippines.74

While the Philippines may have access to similar weapons from other potential sellers, that should not stop the United States from pushing for increased respect for human rights and condemning state violence when it does occur. Though the United States may not be able to prevent the Philippine government from carrying out abuses of its own people, the United States can act to limit its role in supporting that violence. By taking independent action and working with international partners, there might be an opportunity to de‐​escalate ongoing conflicts.

Case Study 3: SALW and State Violence in Ethiopia

Ethiopia presents multiple risk vectors, including political instability, human rights violations, and conflict, reflected in its risk index score of 76, as Figures 7.1, 7.2, and 7.4 indicate. This score suggests that Ethiopia is especially susceptible to negative outcomes from SALW transfers. Since 2009, the United States has authorized $67 million in arms sales to Ethiopia, though small arms sales to the country have been minimal to date, with just $322,000 publicly reported since 2009. Ethiopia also receives SALW from Eastern Europe, from the Middle East, and through illicit trade across its borders. As the central government struggles to manage an increasingly fractious political environment, SALW transfers risk accelerating conflict dynamics and contributing to cross‐​border dispersion.

Neighborhood risk map for Ethiopia
Arms Sales Risk Index score over time for Ethiopia, 2017–2020
Arms deliveries to Ethiopia, 2009–2020
Arms Sales Risk Index vector component scores for Ethiopia

Risk Vector 1: Political Instability Increases SALW Influence on Intercommunal Violence

Over the past decade, Ethiopia’s political fragility has increased as the government has struggled to balance competing regional and ethnic interests. As the country contends with rising intercommunal violence linked to increased fragility, SALW transfers have intensified the magnitude of violence and hindered conflict resolution efforts.

Since the 1991 overthrow of the military junta Derg regime in a civil war, Ethiopia has been governed through a federated system with 10 regional states delineated by ethnicity. Following the overthrow, significant power devolved to regional governments, including the right to maintain regional militaries, yet a coalition of four political parties dominated by the minority Tigray People’s Liberation Front (TPLF) controlled national politics.75

This arrangement grew increasingly untenable throughout the 2000s as regional groups advocated for greater political freedom and influence at the national level. While the election of Abiy Ahmed, a member of Ethiopia’s largest ethnic group, the Oromo, as prime minister in 2018 marked the end of long‐​standing TPLF control of the ruling government coalition, the challenge of managing the ethnic balance of power within the country became more complex. When he took office, Ahmed faced opposition both from minority groups, including Tigrayans threatened by reduced TPLF influence, and from parties representing larger ethnic groups that agitated against their perceived continued marginalization.76

Over the past five years, an escalating cycle of protest and repression produced an increase in political violence. Much of the violence can be attributed to nonstate actors, many tied to Ethiopia’s ethnic coalitions. According to the government‐​managed Ethiopian Human Rights Commission, political violence killed more than 900 people between late 2015 and April 2017.77 More recently, the Armed Conflict Location and Event Data Project data set shows that nonstate groups were the primary actors in 1,501 violent incidents between 2018 and 2020.78

Access to SALW intensifies this dynamic. In 2018, the Small Arms Survey estimated that there were close to a million small arms in circulation in Ethiopia.79 This number has likely increased as the threat of ethnic violence has reportedly encouraged both regional militaries and civilians to increase purchases of small arms.80 In January 2021, Ethiopia’s parliament passed a new law limiting private gun ownership to one gun per individual and banning private weapons trading, among other measures, in response to the use of small arms in an increasing number of incidents of intercommunal violence.81

Risk Vector 2: Ongoing Human Rights Abuses Show SALW Enable Violence against Civilians

While violence by nonstate actors is concerning, state repression may generate greater internal instability in Ethiopia. Disproportionate response to protest may foment further unrest, which drives up overall levels of violence. As a long‐​standing security cooperation partner, U.S. and allies’ arms sales risk increasing the central government’s capacity and exacerbating its willingness to act repressively.

Between 2010 and 2019, the United States reported delivery of $21 million in arms and excess defense articles sales to Ethiopia, though SALW comprised only a small portion of this total. The United States reported only one delivery of firearms, valued at $312,603, through the Direct Commercial Sales process in 2011.82 Separately, UN Commodities Trade data show the United States exported $322,000 worth of ammunition to Ethiopia between 2016 and 2018.83

Although the United States sells relatively few small arms to Ethiopia, the country reports larger imports from other sources, including U.S. allies. UN Commodities Trade data show that Ethiopia received approximately $4.8 million in small arms and ammunition between 2011 and 2017, with early sales primarily coming from Slovakia, a NATO member state, and more recent sales from the United Arab Emirates.84

The international community’s support for arms sales to Ethiopia contributes to the Ethiopian armed forces’ capacity to pursue aggressive internal operations. Small arms and ammunition sales are particularly pernicious because their use by internal security forces increases the ability of these forces to pursue disproportionately violent responses to civil unrest.

Human Rights Watch has documented multiple incidents in which security forces have used small arms to respond with disproportionate force to protesters, resulting in hundreds of civilian deaths since 2015.85 Most recently, security forces killed 76 civilians responding to widespread protests triggered by the murder of a popular Oromo singer in 2020.86

Risk Vector 3: Conflict Exacerbates Risks of SALW Dispersion and Regional Violence

In November 2020, escalating political disputes resulted in the outbreak of armed conflict between the Ethiopian national government and the regional TPLF. In line with broader findings on the intersection of conflict and SALW, this ongoing conflict threatens regional stability in part by increasing the likelihood of cross‐​border SALW transfers.

The current conflict began when Ethiopia’s prime minister ordered central government forces to take control of the northern region of Tigray following a TPLF attack on a federal army base on November 4, 2020. While the central government claimed control over the region’s capital within a month, low‐​intensity conflict remained prevalent through early 2021.87

The conflict quickly drew in Ethiopia’s neighbors. Eritrean military forces, invited to intervene on behalf of the Ethiopian government, were allegedly responsible for the most egregious targeting of civilians.88 Additionally, as civilians fled to refugee camps across the border in Sudan, analysts raised concerns that the proximity of Sudanese, Ethiopian, and Eritrean militias could be destabilizing.89

Illicit SALW transfers may be exacerbating regional instability. The borders between Ethiopia and its neighbors were relatively insecure before violence increased in Ethiopia. Pastoralist groups near the Ethiopia, Kenya, and South Sudan border areas reportedly transfer SALWs that they use to protect their cattle herds from escalating cycles of raiding.90 Weapons also reportedly reach nonstate actors in Ethiopia through smuggling routes running from Yemen to Eritrea and, more recently, to Djibouti.91

An uptick in cross‐​border movement in response to continued conflict presents expanded opportunities for SALW dispersion. If not quickly corrected, this trend has negative implications for a broader region that already struggles to control small arms violence.

U.S. Options for Reducing Negative Outcomes from SALW Trade in Ethiopia

The prevalence of these heightened risk vectors for Ethiopia and the broader region suggests that the international community’s response could have both practical and symbolic effect in reducing the likelihood of further SALW dispersion. By committing to stop selling small arms to Ethiopia and encouraging its allies to do the same, the United States could amplify diplomatic messaging from the broader international community. A reduced flow of small arms could also reduce the likelihood of additional SALW transfers and encourage the Ethiopian government to de‐​escalate the conflict.

The United States has already taken steps in this direction. In September 2020, the United States paused delivery of several foreign assistance programs, including foreign military sales, over dissatisfaction with progress in resolving the Grand Ethiopian Renaissance Dam (GERD) dispute between Ethiopia, Sudan, and Egypt.92 Though the United States announced in February 2021 that it would delink the freeze on foreign assistance from the GERD issue, it did not commit to restarting foreign assistance programming and remains concerned with the Ethiopian government’s role in conflict in the Tigray region.93

Recent events suggest that the United States is unlikely to be a significant source of arms transfers to Ethiopia, but it is unclear whether Washington will encourage its allies to withhold deliveries. Doing so is important as continued transfers from a U.S. ally could increase the risk of negative outcomes across all risk vectors by ensuring internal security forces can access arms and ammunition and by signaling international legitimacy.

Though efforts to limit arms transfers to Ethiopia cannot resolve the underlying factors driving internal instability, by publicly signaling concern with the state’s capacity for violence through restrictions on arms sales, the international community can put pressure on the Ethiopian government to take necessary steps to de‐​escalate tension and thereby reduce the likelihood of widespread conflict.

Conclusion

To date, the Biden administration has continued Trump administration policies that increase the risks from arms sales in general and from SALW in particular. By endorsing the shift of authority over an expanding portfolio of deadly weapons from the State Department to the Commerce Department, the administration is ensuring that human rights concerns will get less consideration than they had previously. In addition, the shift of many sales to the Direct Commercial Sales category means that there will be a reduction in government oversight and end‐​use monitoring. Though such oversight is not always effective, without any oversight, the likelihood of SALW diversion, dispersion, and misuse will increase.

By neither rejoining the Arms Trade Treaty nor supporting congressional efforts to increase human rights monitoring, the Biden administration is signaling that it discounts the risks involved with arms sales. By continuing to sell weapons to extremely fragile states and countries with authoritarian governments, the United States contributes to rising levels of violence and oppression around the world.

Moving forward, the United States should incorporate the risks of arms sales more fully in the arms sales review process. An obvious first step is to halt sales to the riskiest nations: those with the highest overall risk scores as well as those scoring at the bottom of any of the risk index metrics. Extreme problems on any one of the risk vectors should be seen as red flags. Arms sales to governments that are serial violators of human rights, nations at war, and extremely fragile or corrupt states generate the most predictable negative consequences.

A second useful step would be to adjust existing laws so that congressional approval is required for all arms sales rather than the current model in which Congress has an opportunity to vote down proposed Foreign Military Sales transactions. Then‐​senator Joe Biden introduced a bill to Congress in 1986 that would have done just that.94

Third, the United States should reconsider sales of SALW through the Direct Commercial Sales mechanism and bring most of it back under State Department management. Given the serious negative effects of SALW in many countries, SALW sales are first and foremost a matter of foreign policy, not commerce.

Finally, the United States should improve end‐​use monitoring of these sales via the Safeguarding Human Rights in Arms Exports Act of 2021 or similar legislation, thus empowering its agencies to focus on human rights in the arms sales process. Arms sales can be an important U.S. foreign policy tool, but history shows that the benefits do not automatically outweigh the costs.

While the United States must account for other considerations, history shows that the risks involved with weapons sales must be taken more seriously.

Appendix A: Arms Sales Risk Index Methodology

For a more detailed discussion of the risks from arms sales, please see A. Trevor Thrall and Caroline Dorminey, “Risky Business: The Role of Arms Sales in U.S. Foreign Policy,” Cato Institute Policy Analysis no. 836, March 13, 2018.

Constructing the Index

The Arms Sales Risk Index (ASRI) contains four risk vectors. Each vector, in essence, represents a causal mechanism or an explanation of how arms sales can lead to negative consequences. We take what we believe to be a conservative approach based on straightforward assumptions, using available data, about the correlations between risk factors and negative outcomes. We do not claim to make precise predictions about the probability of specific outcomes based on the ASRI. The ASRI’s immediate usefulness lies in helping policymakers incorporate the consideration of risks in decisions about selling and transferring U.S. weapons abroad. In the longer run, the ASRI is an important step in developing a more empirically grounded assessment of the consequences, both positive and negative, of arms transfers.

We measure the strength of the four risk vectors by assessing six different indices. The risk vectors include a state’s level of corruption, the state’s stability, the state’s treatment of its people, and the level of conflict, both internal and external, in which the state is engaged.

To be included in the ASRI, a risk factor must meet the following criteria:

  • It must be mentioned in the literature, or logic must strongly suggest its inclusion.
  • It must be something people can measure in a reliable fashion.
  • The data source it came from must be one that is regularly updated.
  • The data source must be a credible one that uses a transparent methodology.
  • The component must complement and not overlap too much with other components already in the index.

The first risk vector we consider is the corruption of the recipient nation’s regime. We assume that states that prevent their citizens from gaining income, have fake elections, and have questionable business practices pose a greater risk of misusing weapons, weapon dispersion, and human rights abuses. To assess this vector, we rely on Transparency International’s Corruption Perceptions Index, which ranks 180 countries and territories by their perceived levels of corruption. It includes 16 different surveys from 12 different institutions to create a composite “corruption perception score.”

The second risk vector we consider is the fragility of the recipient nation. We assume that fragile states with tenuous legitimacy that also lack the ability to deliver services and cannot manage conflict within their own border pose a greater risk for dispersion and misuse of weapons. The Fragile States Index, produced by the Fund for Peace, examines international conditions that lead to state fragility. It works by examining when these pressures outweigh a state’s capability to maintain stability. It uses 12 indicators (security apparatus, factionalized elites, group grievance, economic decline and poverty, uneven development, human flight, state legitimacy, public services, human rights, demographic pressures, refugees, and external intervention) to create a composite score for “state fragility.”

The third risk vector we examine is a state’s violence toward its citizens. States that have a poor record of human rights and/​or regularly use violence against their own citizens pose a greater risk of misusing weapons. We rely on two indices to measure these factors: Freedom House’s Freedom in the World index and the U.S. Department of State’s Country Reports on Human Rights Practices, as reported by the Political Terror Scale. The Freedom House index includes measurements for electoral process, political pluralism and participation, functioning of government, freedom of expression, associational rights, rule of law, and personal autonomy.

The State Department’s Country Reports on Human Rights Practices, as reported by the Political Terror Scale, is a yearly report measuring physical integrity rights violations worldwide. It looks at political violence and terror that a country experiences in a particular year based on a five‐​level terror scale.

Finally, we also consider conflict as a critical vector for negative consequences. States currently engaged in conflict are inherently riskier when it comes to factors such as dispersion, blowback, entanglement, and human rights abuses. To assess these risks, we rely on the Global Terrorism Index and the Uppsala Conflict Data Program/​Peace Research Institute Oslo (UCDP/PRIO) Armed Conflict Dataset. The Institute for Economics and Peace annually publishes the Global Terrorism Index, which provides a comprehensive summary of global trends and patterns in terrorism since 2000. It looks at the total number of terrorist incidents in a given year, the total number of fatalities caused by terrorism in a given year, the total number of injuries caused by terrorism in a given year, and the approximate level of total property damage caused by terrorism in a given year. It combines these factors to create a composite score that ranks the amount of terrorism facing 163 countries. The UCDP/PRIO Armed Conflict Dataset is used to track the severity of armed conflict. It uses three measures (high‐​level, low‐​level, and no conflict) to assess the strength of a conflict in a given location. Larger conflicts are inherently riskier because of the longer duration and greater damage.

There is some overlap across indices as demonstrated in Table 3. For example, the Fragile State Index includes variables that measure the presence of conflict, as do the Global Terrorism Index and UDCDP/PRIO Armed Conflict Dataset. But as the correlation matrix below indicates, even though the variables are positively correlated with one another, all of them appear to bring something different to the index.

Risk Index Factors Correlation Matrix

Arms Sales Risk Index factors correlation matrix

To combine each of the risk factors, themselves constructed using a variety of different scales, we normalize the scores for each risk factor using min‐​max methods. This means that we adjust the data to the rest of the data by placing all six indices on one scale. This helps us avoid weighting one index more than another. Unless otherwise noted, normalization follows the following formula: . In the equation, s′k represents the normalized score of the measurement variable s for observation k.

After normalization, for each measure, every country has a score of between 1 (the lowest risk) and 100 (the highest risk). We then weight each of the six components equally, averaging them to find the composite risk score for each country. We weight the six components equally rather than the four vectors because we do not yet have an empirical reason to consider different weighting systems and because although they are similar, the pairs of factors that measure state behavior and conflicts measure very different types of specific data. While two countries may have the same overall score, they may be risky for different reasons. Thus, it is important to pay attention to the individual components as well as their risk index scores.

The alternative method would be to weight based on year‐​to‐​year data or create a base year rather than weighting on the data sets. The benefit of either option is the same. Currently, because the minimum and maximum value for each interval index (everything but the State’s Country Reports on Human Rights Practices and PRIO data sets) differs every year, there is some degree of error when comparing scores by year. Rather than normalizing using a min‐​max method, the alternative would make every index 1–100, allowing researchers to compare with perfect accuracy year to year.

We do not use this method for three reasons. First, because we use both ordinal and interval data, the State’s Country Reports on Human Rights Practices and PRIO data sets both would have a set of 100s if we normalize by year. For example, the highest value in the PRIO data set is 3. Normalizing by year means that every 3 becomes 100, 2 becomes 50, and 1 becomes 1. Comparatively, the Fragile State Index is interval data and on a scale between 0 and 120. In no year of collecting data has either the minimum or maximum value emerged as a final score. What that means is that if we weight the risk scores by year, the indexes would be weighted unevenly. The ordinal data sets would have the highest maximum scores, the Fragile State Index would follow because it goes up through 120, and then the other data sets that are all 0–100 or 1–100 would see the lowest maximum scores. This means that the risk factors we use, with a year‐​to‐​year weight, would be unevenly distributed.

Additionally, because the scale is 1–100 where 1 is always the lowest and 100 is always the highest, it provides an easy reference point for policymakers to start evaluating risk profiles of countries where the United States sells weapons. As noted previously, we are interested at looking at broad trends. If the highest score on the Fragile State Index goes from a 112.4 to a 111.7 and the lowest from a 14.6 to a 16.2, that would make a miniscule difference in the overall score. Alternatively, if we used the year‐​to‐​year method, the highest Fragile State Index score in our 2021 ASRI would be a 93.15. That would introduce a biased weight when compared to ordinal indices such as the State’s Country Reports on Human Rights Practices and PRIO conflict category.

With these methods, we would need to be able to justify to policymakers why corruption is less important than state terrorism and political violence for our riskiest and least risky customers—something we do not feel comfortable doing.

The result of this process is a common‐​sense index that provides a starting point for policymakers to rethink the risk assessment process, although it unavoidably sacrifices the year‐​to‐​year nuance of the individual components. But because our approach measures only significant differences in state freedom, stability, and so forth rather than attempting to claim undue precision, there is good reason to believe that nations scoring higher on this index are indeed riskier customers even though we cannot be certain about the precise weighting of different components (an area for future research).

Calculating Neighborhood Risk Scores

Neighborhood risk uses the Correlates of War Direct Contiguity data set that codes a state as a “neighbor if it shares a land border or if they are separated by 400 miles of water” (the maximum distance at which two 200‐​mile exclusive economic zones can intersect).

We then compile the total risk of every country’s neighbor to create a “neighborhood risk score.” This allows us to check the risk of countries that are in very risky neighborhoods but otherwise domestically stable. Examples of this include India (42nd most risky, 8th riskiest neighborhood, over $3.1 billion in arms sales since 2009), Greece (122nd most risky, 30th riskiest neighborhood, over $6.6 billion in arms sales since 2009), Qatar (125th most risky, 39th riskiest neighborhood, over $3.1 billion in arms sales since 2009), Oman (106th most risky, 13th riskiest neighborhood, over $1.5 billion in arms sales since 2009), and Indonesia (55th most risky, 19th riskiest neighborhood, over $944 million in arms sales since 2009).

Additionally, the neighborhood risk metric allows us to track what neighborhoods are the riskiest. Countries in the Persian Gulf and Middle East tend to receive a lot of government‐​to‐​government weapons sales, but the neighborhood itself amplifies the risk of these sales. In Central America, while the individual countries see significant individual risk, they also see equal neighborhood risk—an unfortunate trend given that the region receives a substantial amount of direct commercial sales.

Calculating the Average Customer Risk Score

As its name suggests, the average customer risk score is a common‐​sense measure of how risky the average arms sales customer of any given arms exporting nation is in a given year. The more weapons a nation sells to riskier nations, the higher the score will be. If a nation mostly sells weapons to low‐​risk clients, the average customer risk score will also be low. We calculate the score by multiplying each recipient country’s risk score by the dollar amount of sales they purchased and then dividing by the total sales in dollar amounts made that year.

For example, if the United States sold $1 million worth of weapons to a nation with a risk score of 100, the U.S. average customer risk score would be (100 × 1,000,000) ÷ 1,000,000 = 100. If the United States sold $1 million worth of weapons to a nation with a risk score of 100 and $1 million to a nation with a risk score of 0, the average customer’s risk score would be ((100 × 1,000,000) + (0 × 1,000,000)) ÷ (1,000,000 + 1,000,000) = 50. Where it gets more interesting is when the dollar amounts vary, as they do in the real world. For example, if the United States sells $2.5 million worth of weapons to a nation with a risk score of 0 but sells $7.5 million to a nation with a risk score of 100, the average customer risk score would be ((100 × 7,500,000) + (0 × 2,500,000)) ÷ (7,500,000 + 2,500,000) = 75.

Appendix B: Data, Data Sources, and References

Data

Data Sources for Arms Sales and the Risk Index

Arms Sales

Security Assistance Monitor, https://​secu​rityas​sis​tance​.org

Risk Index Factors

Acknowledgments

The authors thank Cato Institute intern Peter Scaturro for his help drafting the Philippines case study.

About the Authors
Notes

1. See “SIPRI Arms Industry Database,” Stockholm International Peace Research Institute, https://​www​.sipri​.org/​d​a​t​a​b​a​s​e​s​/​a​r​m​s​i​n​d​ustry.

2. Unless otherwise explicitly noted, all arms sales data in this report come from “Arms Sales,” Security Assistance Monitor, Center for International Policy, https://​secu​rityas​sis​tance​.org/​a​r​m​-​s​ales/. See William D. Hartung and Elias Yousif, U.S. Arms Sales Trends: 2020 and beyond from Trump to Biden (Washington: Center for International Policy, April 2021).

3. Hartung and Yousif, U.S. Arms Sales Trends.

4. Caroline Dorminey, “Your Taxes at Work: Some Foreign Arsenal Assembly Required,” Inkstick, May 2, 2018.

5. Bill Chappell, “Trump Moves to Withdraw U.S. from U.N. Arms Trade Treaty,” NPR, April 26, 2019.

6. Mike Stone and Matt Spetalnick, “Exclusive: Trump Administration Prepares to Ease Export Rules for U.S. Guns,” Reuters, October 2, 2017.

7. For more information on this change, see “Transfer of Arms and Ammunition (U.S. Munitions List Category I–III) to Commerce,” Forum on the Arms Trade; and Steven Clagett, Jeff Bond, and Timothy Mooney, “USML Categories I–III: Firearms and Related Items—Transitioned to the EAR,” August 18, 2020.

8. Rachel Stohl and Shannon Dick, “It’s Time to Rethink US Drone Policy,” Responsible Statecraft, May 18, 2021; and A. Trevor Thrall and Jordan Cohen, “Trump’s Dismal Drone Policy,” Washington Examiner, June 23, 2020.

9. William Hartung, “Biden’s Pledge to Rein In Arms Deals Is Already Eroding,” The Nation, May 27, 2021.

10. Jeff Abramson et al., “At 100 Days, Grading Biden’s Progress toward a More Responsible US Arms Trade Policy,” Just Security, April 28, 2021.

11. Government data for small arms and light weapons (SALW) sales are very spotty and currently available only from 2009 through 2013. During that period, SALW accounted for 17.5 percent of all arms sales. We estimated total SALW sales through 2020 by calculating 17.5 percent of $1.3 trillion, which is $228 billion.

12. “Half of All Violent Deaths Involve Small Arms and Light Weapons,” UN News, United Nations, February 5, 2020.

13. Steven Nelson, “Senators Force Vote on Latest Saudi Arabia Arms Sale,” U.S. News & World Report, September 8, 2016.

14. Jeff Abramson, “Process Changes Offered as Arms Sales Rise,” Arms Control Today 50 (November 2020). See Safeguarding Human Rights in Arms Exports Act of 2021, S. 1473, 117th Cong. (2021).

15. Safeguarding Human Rights in Arms Exports Act of 2021, H.R. 5629, 117th Cong. (2021); and Rep. Ilhan Omar (D–MN), “Rep. Omar Introduces the Global Migration Agreement Act and Stop Arming Human Rights Abusers Act (SAHRAA),” press release, July 27, 2021.

16. See “Arms Sales,” Security Assistance Monitor, https://​secu​rityas​sis​tance​.org/​a​r​m​-​s​ales/; Hartung and Yousif, U.S. Arms Sales Trends; and William D. Hartung, Christina Arabia, and Elias Yousif, The Trump Effect: Trends in Major U.S. Arms Sales 2019 (Washington: Center for International Policy, May 2020), p. 2.

17. See “Arms Sales,” Security Assistance Monitor, https://​secu​rityas​sis​tance​.org/​a​r​m​-​s​ales/.

18. Admittedly, it would be nice to be able to weigh the risks of $1 of small arms more than $1 of F‑35 Lightning II aircraft sales. With that said, we currently lack the ability to include such a measurement.

19. See “Global Firearms Holdings,” Small Arms Survey, http://​www​.smal​l​armssur​vey​.org/​w​e​a​p​o​n​s​-​a​n​d​-​m​a​r​k​e​t​s​/​t​o​o​l​s​/​g​l​o​b​a​l​-​f​i​r​e​a​r​m​s​-​h​o​l​d​i​n​g​s​.html.

20. See “Arms Sales,” Security Assistance Monitor, https://​secu​rityas​sis​tance​.org/​a​r​m​-​s​ales/.

21. Kai Schultz, “Modi Defends Indian Citizenship Law amid Violent Protests,” New York Times, December 22, 2019; and Hartung, Arabia, and Yousif, The Trump Effect, p. 2.

22. Stephen Tankel, With Us and against Us: How America’s Partners Help and Hinder the War on Terror (New York: Columbia University Press, 2018).

23. “Nigeria: ‘My Heart Is in Pain’—Older People’s Experience of Conflict, Displacement, and Detention in Northeast Nigeria,” Amnesty International, December 8, 2020.

24. “Freedom in the World 2021: Thailand,” Freedom House, https://​free​dom​house​.org/​c​o​u​n​t​r​y​/​t​h​a​i​l​a​n​d​/​f​r​e​e​d​o​m​-​w​o​r​l​d​/2021.

25. Mark Gibney et al., “The Political Terror Scale, 1976–2019,” 2020, http://​polit​i​cal​ter​rorscale​.org.

26. “Small Arms and Light Weapons: Report of the Secretary General,” United Nations Security Council, S/2015/289, April 27, 2015, p. 2.

27. Rebecca Kuku, “Tribal Conflict Worsens in Papua New Guinea as Firearms Rewrite the Rules,” The Guardian, February 26, 2021. For numbers in sales, see “Arms Sales,” Security Assistance Monitor, https://​secu​rityas​sis​tance​.org/​a​r​m​-​s​ales/.

28. Research shows that neither the United States nor other major arms exporters tend to halt the flow of arms to countries mired in conflict or with poor human rights records. See David Kinsella, “The Arms Trade” in The Handbook on the Political Economy of War, eds. Christopher J. Coyne and Rachel L. Mathers (Cheltenham, PA: Edward‐​Elgar Publishing, 2011), pp. 217–42.

29. Debbie Hillier and Brian Wood, Shattered Lives: The Case for Tough International Arms Control (Oxford, UK: Oxfam, 2003).

30. Carla Martinez Machain and Jeffrey Pickering, “The Human Cost of the Weapons Trade: Small Arms Transfers and Recipient State Homicide,” Journal of Global Security Studies 5, no. 4 (October 2020): 578–97.

31. Christopher Louise, “The Social Impacts of Light Weapons Availability and Proliferation,” United Nations Research Institute for Social Development, March 1995.

32. Stewart Firth, “Security in Papua New Guinea: The Military and Diplomatic Dimensions,” Security Challenges 10, no. 2 (2014): 97–113; and Kuku, “Tribal Conflict Worsens in Papua New Guinea.”

33. Stephen D. Goose and Frank Smyth, “Arming Genocide in Rwanda: The High Cost of Small Arms Transfers,” Foreign Affairs, September/​October 1994.

34. Martinez Machain and Pickering, “Human Cost of the Weapons Trade,” p. 2.

35. For Mexico’s small arms and light weapons data, see “Arms Sales,” Security Assistance Monitor, https://​secu​rityas​sis​tance​.org/​a​r​m​-​s​ales/.

36. “Mexico’s Everyday War: Guerrero and the Trials of Peace,” International Crisis Group, updated May 4, 2020.

37. “Building Peace in Mexico: Dilemmas Facing the López Obrador Government,” International Crisis Group, October 11, 2018.

38. “Where the Guns Go: U.S. Arms and the Crisis of Violence in Mexico,” American Friends Service Committee, November 2016, p. 5.

39. “Mexico’s Everyday War,” International Crisis Group.

40. “Where the Guns Go,” American Friends Service Committee, pp. iii.

41. “Mexico: Background and U.S. Relations,” Congressional Research Service, January 7, 2021, p. 9.

42. “Mexico: Background and U.S. Relations,” Congressional Research Service, p. 7–8.

43. “Mexico: Background and U.S. Relations,” Congressional Research Service, p. 9.

44. Mary Beth Sheridan, “The Search for the Disappeared Points to Mexico’s Darkest Secrets,” Washington Post, December 3, 2020.

45. Marina Franco, “Five Years Ago, 43 Students Vanished. The Mystery, and the Pain, Remain,” New York Times, September 26, 2019.

46. “Where the Guns Go,” American Friends Service Committee, p. 4.

47. “Mexico: Background and U.S. Relations,” Congressional Research Service, p. 19.

48. “Mexico: Organized Crime and Drug Trafficking Organizations,” Congressional Research Service, updated July 28, 2020, p. 6.

49. “Building Peace in Mexico,” International Crisis Group.

50. “Mexico’s Everyday War,” International Crisis Group.

51. Kevin Sieff and Nick Miroff, “The Sniper Rifles Flowing to Mexican Cartels Show a Decade of U.S. Failure,” Washington Post, November 19, 2020.

52. “Firearms Trafficking: U.S. Efforts to Disrupt Gun Smuggling into Mexico Would Benefit from Additional Data and Analysis,” Government Accountability Office, February 2021, p. 1.

53. Topher L. McDougal et al., “The Way of the Gun: Estimating Firearms Trafficking across the US–Mexico Border,” Journal of Economic Geography 15, no. 2 (March 2015): 297–327, https://​doi​.org/​1​0​.​1​0​9​3​/​j​e​g​/​l​bu021.

54. “Firearms Trafficking,” Government Accountability Office, p. 3.

55. “Where the Guns Go,” American Friends Service Committee, p. 6; and “Security Assistance Database,” Security Sector Assistance, Security Assistance Monitor, Center for International Policy, https://​secu​rityas​sis​tance​.org/​s​e​c​u​r​i​t​y​-​s​e​c​t​o​r​-​a​s​s​i​s​t​ance/.

56. “Mexico: Evolution of the Mérida Initiative, FY2008–FY2022,” Congressional Research Service, updated November 1, 2021.

57. “Mexico: Background and U.S. Relations,” Congressional Research Service; and “Arms Sales,” Security Assistance Monitor, https://​secu​rityas​sis​tance​.org/​a​r​m​-​s​ales/.

58. See “Arms Sales,” Security Assistance Monitor, https://​secu​rityas​sis​tance​.org/​a​r​m​-​s​ales/.

59. Phelim Kine, “The Philippines’ Duterte Incites Vigilante Violence,” Human Rights Watch, April 19, 2017.

60. “If It’s Drugs, You Shoot and Kill,’ Duterte Orders Philippine Custom Chief,” The Guardian, September 1, 2020.

61. Sofia Tomacruz and J. C. Gotinga, “Gov’t to Implement ‘National Action Plan’ on Coronavirus, with DND on the Lead,” Rappler, updated March 25, 2020.

62. Nick Aspinwall, “The Philippines’ Coronavirus Lockdown Is Becoming a Crackdown,” The Diplomat, April 3, 2020.

63. Sofia Tomacruz, “‘Shoot Them Dead’: Duterte Orders Troops to Kill Quarantine Violators,” Rappler, April 1, 2020.

64. “Police Shoot Dead Farmer Who Attacks Them at Agusan Del Norte Checkpoint,” Rappler, April 6, 2020; and Gaby Baizas, “Netizens Slam Duterte’s ‘Shoot to Kill’ Order, Nat’l Gov’t Response to Outbreak,” Rappler, April 2, 2020.

65. “Philippines: Curfew Violator Abused,” Human Rights Watch, March 26, 2020; and Nick Aspinwall, “Police Abuse, Prison Deaths Draw Concern as Philippines Tightens Lockdown Measures,” The Diplomat, April 30, 2020.

66. Mike Fowler, “Philippine Counterinsurgency Strategy: Then and Now,” Small Wars Journal, January 18, 2011.

67. Peter Chalk, “U.S. Security Assistance to the Philippines,” CTC Sentinel 1, no. 3 (February 2008); and Zachary Abuza, “Where Did the U.S. Go Wrong in the Philippines? A Hard Look at a ‘Success’ Story,” War on the Rocks, June 14, 2018.

68. “Philippines: No Progress Disarming, Demobilizing Militias,” Human Rights Watch, November 21, 2012.

69. “Global Corruption Barometer: Asia 2020,” Transparency International, November 24, 2020.

70. “Military Is Most Corrupt Gov’t Agency: Survey,” ABS-CBN News, March 28, 2011.

71. Larry Niksch, “Abu Sayyaf: Target of Philippine–U.S. Anti‐​Terrorism Cooperation,” Congressional Research Service, updated January 24, 2007.

72. Above the Law: Police Torture in the Philippines (London: Amnesty International, 2014).

73. Carlos H. Conde, “New Philippines Police Chief Signals Change,” Human Rights Watch, May 25, 2021.

74. Nick Aspinwall, “US to Sell Philippines Arms despite No Human Rights Reforms,” Nikkei Asia, February 24, 2021.

75. “In Focus: Ethiopia,” Congressional Research Service, updated August 3, 2020, https://​crsre​ports​.con​gress​.gov/​p​r​o​d​u​c​t​/​p​d​f​/​I​F​/​I​F​10185.

76. “Keeping Ethiopia’s Transition on the Rails,” International Crisis Group, December 16, 2019.

77. “Report: 669 Killed in Ethiopia Violence since August: Report,” Al Jazeera, April 18, 2017.

78. “Data Export Tool,” Armed Conflict Location and Event Data Project, December 10, 2021, https://​acled​da​ta​.com/​d​a​t​a​-​e​x​p​o​r​t​-​tool/.

79. “Global Firearms Holdings,” Small Arms Survey.

80. Semir Yusuf, “What Is Driving Ethiopia’s Ethnic Conflicts?,” Institute for Security Studies, November 25, 2019.

81. “Ethiopia Passes Gun Control Law to Tackle Surge in Violence,” Reuters, January 9, 2020.

82. “Arms Sales,” Security Assistance Monitor.

83. UN Comtrade Database (object name Ethiopia 930621 and 930630), 2021, https://​com​trade​.un​.org/data.

84. UN Comtrade Database (object name Ethiopia 930621 and 930630).

85. “‘Such a Brutal Crackdown’: Killings and Arrests in Response to Ethiopia’s Oromo Protests,” Human Rights Watch, June 15, 2016; and “Ethiopia: Lethal Force Against Protesters,” Human Rights Watch, December 18, 2015.

86. “Ethiopian Rights Body Says Security Forces Killed at Least 76 in Summer Unrest after Musician’s Killing,” Reuters, January 1, 2021.

87. Declan Walsh and Abdi Latif Dahir, “Why Is Ethiopia at War With Itself?,” New York Times, November 5, 2020.

88. Cara Anna, “‘Horrible’: Witnesses Recall Massacre in Ethiopian Holy City,” Associated Press, February 18, 2021.

89. Michelle Gavin, “The Conflict in Ethiopia’s Tigray Region: What to Know,” Council on Foreign Relations, February 10, 2021.

90. Jonah Leff, “Pastoralists at War: Violence and Security in the Kenya‐​Sudan‐​Uganda Border Region,” International Journal of Conflict and Violence 3, no. 2 (December 2009): 188–203, https://​doi​.org/​1​0​.​4​1​1​9​/​i​j​c​v​-2785; and Toru Sagawa, “Automatic Rifles and Social Order amongst the Daasanach of Conflict‐​Ridden East Africa,” Nomadic Peoples 14, no. 1 (2010): 87–109, https://​doi​.org/​1​0​.​3​1​6​7​/​n​p​.​2​0​1​0​.​1​40106.

91. Zeenat Hansrod, “Djibouti Emerges as Arms Trafficking Hub for Horn of Africa,” RFI, September 16, 2018.

92. Cara Anna, “US Suspends Some Aid to Ethiopia over Dam Dispute with Egypt,” Associated Press, September 2, 2020.

93. “U.S. to De‐​Link Ethiopian Aid Pause from Dam Policy,” Reuters, February 20, 2021.

94. Arms Export Reform Act of 1986, S. 2834, 99th Cong. (1986).