• South Korea is often cited as proof that government targeting of economic activity produces an economic boom. Yet the country’s fastest growth occurred during periods when the government took a more neutral approach before and after the heavy and chemical industry (HCI) drive of the 1970s and early 1980s.

  • During the HCI drive, Seoul used government-controlled banks and loan guarantees, along with tax privileges and import protection, to steer capital toward selected firms, sectors, and regions.

  • For most favored private firms, the government directed credit rather than buying shares. The approach still resembled direct government investment because it lowered recipients’ cost of capital, diverted funds from other uses, and shifted part of the downside risk to the public.

  • The HCI drive produced excessive leverage, surplus capacity, inflation, and difficult restructuring. Gains among supported firms, by themselves, do not show that the policy improved economy-wide growth or welfare.

  • The central lesson for US policymakers is not that South Korea proves industrial policy works but that selective state-business interventions can create visible winners while hiding broader economic costs.

Why South Korea Is Back in the US Policy Debate

I have published multiple volumes dissecting the failures of half a century of state capitalism in India and am now dismayed to see the United States traveling down the same troubled path. Today, while India continues to slowly but surely shed state capitalism, US policymakers are increasingly embracing state direction, public equity stakes, targeted subsidies, national champions, and the forging of government-business partnerships as policy instruments.

The proponents of these instruments commonly cite the success of the four East Asian “tiger” economies—Hong Kong, Singapore, Taiwan, and South Korea. Yet these economies owe their success to an outward orientation, export growth, trade liberalization, currency adjustment, and market discipline, not to heavy-handed interventions. Similar to many developing countries, these countries’ governments did intervene in the market at times, but careful analysis shows that those interventions subtracted from, rather than added to, their economic successes.

Of the four tiger economies, Hong Kong and Singapore are city-states with economic histories that differ substantially from those of Taiwan and South Korea. The debate over selective government intervention has therefore focused more heavily on Taiwan and South Korea.

Between these two economies, South Korea has attracted the most attention, both because it explicitly pursued industrial targeting through its heavy and chemical industry (HCI) drive and because that process is better documented. Keeping that in mind, this essay critically examines the case of South Korea. If Seoul can be shown to have succeeded despite government intervention and not because of it, one can surmise that the same is true of the remaining three tiger economies.

South Korea’s Growth Story

South Korea emerged as an independent nation after the end of the Japanese occupation of undivided Korea in 1945 and the subsequent bifurcation of the country. In 1950, North and South Korea plunged into a war that lasted three years (1950–1953). During the war, South Korea lost a million civilians, and its industrial production in 1953 dropped to one-third of 1940 levels. In the 1950s, the situation was so sufficiently grim that some economists doubted that the country’s economy was viable without the large aid flows it had been receiving from the United Nations, the US, and some allied countries.

Defying all odds, however, by 1995, South Korea had joined the ranks of high-income countries. Within three short decades, spanning 1963 to 1995, South Korea transformed itself from a poor, rural, and agricultural economy to a prosperous, industrial, and urbanized nation.

How did South Korea accomplish this feat? The central force driving the transformation was sustained rapid growth, which begs the question of how that growth was achieved. As with most developing countries in the postcolonial era, the South Korean government had intervened in markets. The difference was that South Korea achieved high growth while most others did not. Notwithstanding, proponents of industrial targeting and state capitalism have often argued that South Korea’s high growth resulted from government interventionist policies.

Are these proponents right? Let us begin with the short answer first. As it happens, South Korea’s heavy interventions were concentrated to certain years during its three high-growth decades. Those years were preceded and followed by periods of much lighter government touch. Therefore, the primary consideration centers on whether the heavier hand of the government accelerated growth and whether the switch to a lighter hand led to a slowdown.

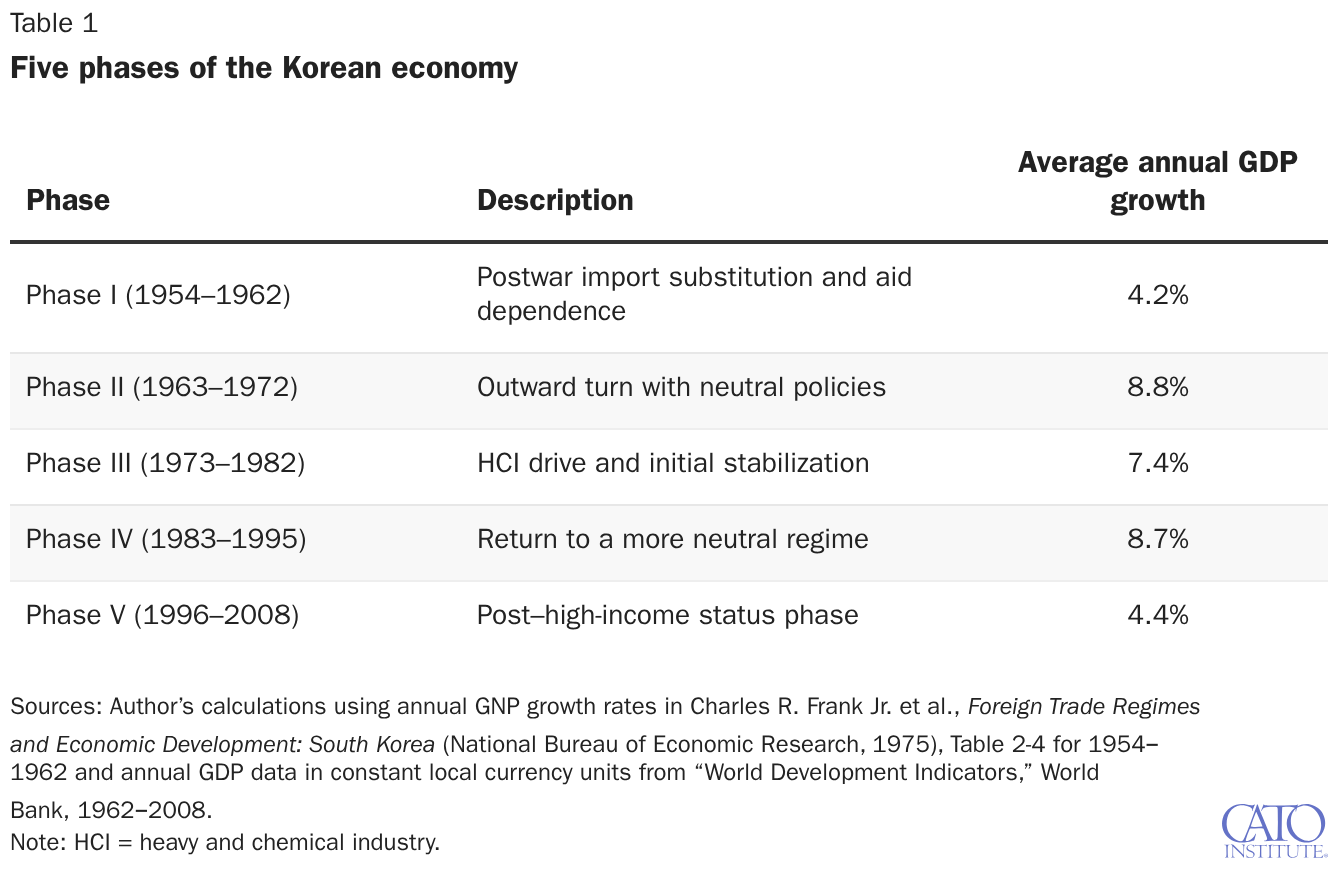
In fact, the story turns out to be exactly the opposite. South Korea’s postcolonial growth journey can be neatly divided into five phases (Table 1). Of these, phases II, III, and IV roughly cover the three high-growth, transformational decades (1963–1995). GDP per capita increased from $1,153 in 1963 to $13,924 in 1995, in constant 2015 dollars. As shown in Table 1, the average annual growth rates in phases II, III, and IV were 8.8 percent, 7.4 percent, and 8.7 percent, respectively. Among these three phases, it was only during phase III that the South Korean government officially adopted an activist and aggressive policy of industrial targeting and state-led development. This phase also exhibited the slowest growth among the three high-growth phases.

Five phases of the Korean economy

The government was not completely passive in phases II and IV. The difference is that in both phases, Seoul took action to create an environment in which entrepreneurs could operate freely in the global marketplace. In phase II, the government undertook a series of devaluations aimed at correcting the overvaluation of the domestic currency, liberalized some import restrictions, and expanded export incentives to neutralize the remaining anti-trade bias of import protection. In phase IV, the government once again proactively dismantled the industrial-targeting measures and import restrictions introduced during phase III, further liberalized imports, opened the economy to foreign investment, and introduced numerous measures to liberalize the financial sector.

The Five Phases in Detail

We may now consider the five phases listed in Table 1 in greater detail to reinforce South Korea’s growth story.

Phase I (1954–1962): Postwar Import Substitution and Aid Dependence

During the immediate postwar era, South Korea was heavily dependent on US aid and maintained a high level of protectionism. This was the import-substitution phase because policies were geared toward replacing imports with domestic production. These policies included significant overvaluation of the won, the domestic currency, and the regulation of imports through import licensing and tariffs. With the won highly overvalued (and the US dollar highly undervalued), domestic sales were more profitable than export sales. As a result, exports peaked at only 3.5 percent of GNP in 1962. Thanks to US aid, the import peak was significantly higher at 14.3 percent of GNP in 1957. The average GNP growth rate during the era was 4.2 percent. Much of this growth, low compared to later periods, was concentrated in the earlier years, perhaps reflecting the immediate postwar recovery.

Phase II (1963–1972): An Outward Turn with Neutral Policies

South Korea turned a corner during phase II, with GDP growth accelerating to 8.8 percent. This era was characterized by multiple devaluations of the won; the exchange rate changed from 65 won per dollar in 1960 to 130 won per dollar in February 1961 and 257 won per dollar in 1964. In 1965, South Korea adopted a floating exchange rate. On the import front, beginning in the mid-1960s, the list of freely importable products expanded steadily (with more items freely importable than not by 1967), and several export incentives were adopted.

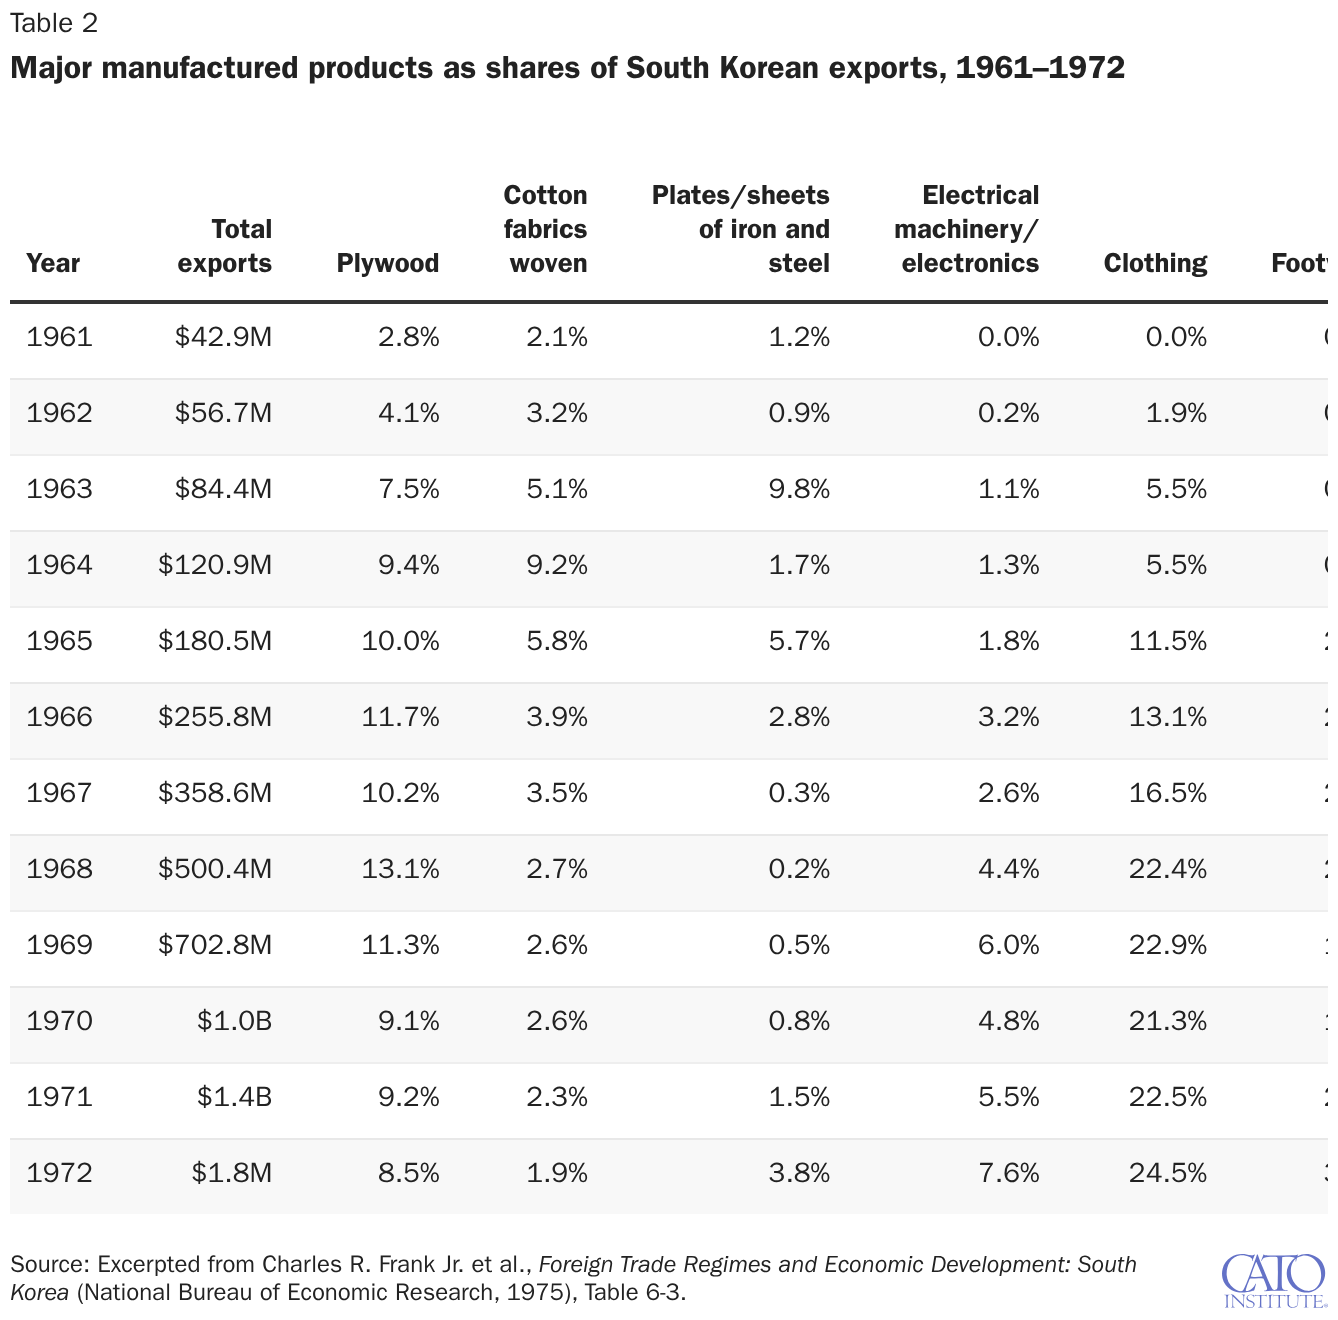
The 1961 devaluation of the won had an immediate, desired effect: Increased profitability led to 60.8 percent growth in manufacturing exports in 1961 alone. From 1961 to 1964, manufacturing exports grew at an average annual rate of 87.9 percent. The 1964 devaluation, subsequent floating of the won, and import liberalization reinforced this effect. The share of manufactured items in total exports grew rapidly from 22.0 percent in 1961 to 62.3 percent in 1965 and 87.7 percent in 1972. This expanded share occurred as exports themselves grew from 3.5 percent of GNP in 1963 to 21.3 percent in 1972. By 1963, GDP had shifted to a high-growth trajectory, with 9.5 percent growth recorded that year.

Exchange-rate adjustments, export incentives, and import liberalization offer the most direct explanation for the unprecedented export expansion and GDP growth during phase II. The proposition that government interventions engineered the export boom through domestic price manipulation, as proponents of state intervention contend, finds little support in the data.

Based on earlier joint work, economist Larry Westphal, himself a firm believer in infant-industry protection, summarized his findings on the role of interventions: “Did these selectively administered interventions have a non-neutral impact? The available evidence indicates that with one possible exception, they generally did not. The possible exception arises in the case of infant industries being promoted by additional means of selective interventions.” Westphal also noted that selective infant-industry promotion was limited during phase II, applying only to cement, fertilizer, and petroleum refining in the early 1960s and to steel and petrochemicals in the late 1960s and early 1970s. Leaving these sectors aside, Westphal stated that the net effect of the interventions on domestic prices was at most a small pro-export bias relative to free trade. That is, the overall impact of interventions was to make domestic prices slightly more favorable to exportable products than those prevailing in world markets. In effect, when we aggregate the effects of import-restricting and export-promoting policies on domestic prices, the two policies generally cancel one another out, leaving a slight bias in favor of exports.

Can infant-industry protection explain the export growth of phase II? The structure of exports compellingly militates against this possibility. As Table 2 shows, the products that saw rapid expansion were not those produced by sectors that Westphal identified as having received infant-industry protection. Rather, they were light manufactured items in which the labor-abundant South Korea of the 1960s had a comparative advantage. Plywood, cotton fabrics, clothing, footwear, and human hair, which dominated the export basket, were all labor-intensive products. The share of plates and sheets of iron and steel came down from their high levels in 1963 and 1965, and electrical machinery and electronics began gaining a significant share only in 1968, as South Korea became more capital-abundant with rising incomes and savings rates.

Major manufactured products as shares of South Korean exports, 1961–1972

Phase III (1973–1982): The Heavy and Chemical Industry Drive and Initial Stabilization

Three factors combined to persuade the South Korean government to launch the HCI drive in January 1973. First, the United States cut its military forces in South Korea by a third in 1971, sparking fears that it might withdraw entirely. This prompted Seoul to consider developing strategic industries to strengthen defense. Second, persistently large trade deficits led to a reduction in imports, possibly through import substitution. Finally, rising protectionist sentiment toward labor-intensive exports in developed countries made it harder to bridge the trade deficit by expanding light-industry exports and led to a shift toward more capital-intensive sectors.

The principal instrument of industrial targeting during this period was low-interest credit extended to selected enterprises in specified sectors and regions. A significant share came through government-approved and guaranteed foreign loans, which enabled selected firms to borrow at more favorable subsidized rates. Six sectors were targeted: iron and steel, petrochemicals, nonferrous metals, machine tools, shipbuilding, and electronics. Complementary measures included tax holidays, accelerated depreciation, temporary investment tax credits, and an expanded list of products that received increased protection. With the exchange rate, the government remained pragmatic, allowing the won to depreciate from 484 won per dollar to 660 won per dollar in 1974 and to 701, 796, 827, and 890 won per dollar in the four successive years, respectively.

Even at the height of the HCI drive, Seoul generally did not buy shares in the private family-owned conglomerates (chaebols) it favored. The government-controlled commercial banks and specialized lenders decided which firms could borrow abroad and guaranteed approved foreign loans. Those powers gave officials influence over investment and refinancing but left formal ownership and day-to-day management in private hands.

Directed credit therefore resembled a government equity stake in several important respects. It lowered favored firms’ cost of capital, diverted funds from other uses, and shifted part of the downside risk to the government-controlled financial system and ultimately the broader public. Because support arrived mainly in the form of loans, recipient firms became highly leveraged and dependent on continued refinancing. Control over credit gave officials much of the direction they wanted without buying stock in most private firms.

Firms in the HCI sectors relied on borrowing to finance 90 percent of their capital, resulting in an unsustainably high debt-to-equity ratio. Excessive capacity expansion in the heavy machinery sector resulted in the operating ratio plunging from 75 percent in 1977 to 35 percent in 1980. Monetary expansion, driven by the need to expand credit to favored firms, kept inflation in the double digits throughout the 1970s, reaching 25.2 percent in 1975 and 18.3 percent in 1979. These problems led to political unrest, prompting the government to formally abandon HCI in April 1979 and proceed to implement the Comprehensive Measures for Economic Stabilization (CMES) program.

In October 1979, then-President Park Chung Hee, who had seized power through a coup and ruled autocratically, was assassinated, giving way to the emergence of a more liberal-minded government. However, the implementation of CMES took time, and in particular, subsidized credit to the HCI enterprises was abolished only in June 1982.

Economic growth slowed during the HCI and initial stabilization phase, with annual GDP growth between 1973 and 1982 averaging 7.4 percent. This period included 12 percent growth in 1973, which can scarcely be attributed to the HCI drive, as its implementation had just begun that year. If we exclude 1973, annual growth between 1974 and 1982 was 6.9 percent. The HCI drive also left behind high inflation, excess capacity, highly leveraged large firms, and structural imbalances between HCI and non-HCI sectors and between subsidized and unsubsidized enterprises and regions. It took careful implementation of CMES to clean up the economic mess HCI policies had created or exacerbated.

Phases IV and V (1983–1995 and 1996–2008): Return to a More Neutral Regime

Phase IV saw South Korea return to the relatively neutral regime of phase II, complemented by considerable external and internal liberalization. Externally, following the recommendations of the Tariff Reform Committee of 1983, the average tariff level was reduced from 24 percent in 1983 to 19 percent in 1988 and 11 percent in 1990. Many of the tariff concessions to the HCI sectors were also withdrawn in 1984. The list of strategic industries was trimmed, and concessions were limited to technological development. Foreign direct investment, an important means of acquiring technology, was liberalized between 1980 and 1984.

Domestically, the financial sector was substantially liberalized. Commercial banks were privatized; non-bank financial companies were granted unrestricted entry; and preferential interest rates for strategic and export industries were abolished. These measures led to a rise in credit from 68 percent of GDP in 1980 to 94 percent in 1984. Overall GDP growth between 1982 and 1995, at 8.7 percent, was nearly the same as in phase II.

By 1995, South Korea had become a high-income country. With productivity having increased considerably, the need to catch up was substantially reduced. As per capita income converged with that of developed countries, the gap between South Korea’s growth rate and other countries also narrowed.

Within three years, the Asian currency crisis hit the South Korean economy hard. Nevertheless, the country recovered quickly, with growth returning to a level higher than that of developed countries—a status South Korea was approaching but lower than its own between 1963 and 1995. A key reason for the quick recovery was that Seoul allowed many inefficient large firms (chaebols) to exit.

Phase V (1996–2008) was characterized by an average annual growth rate of 4.4 percent, consistent with the experience of many other high-income countries after a period of significant development.

Did Industrial Targeting Raise Growth?

Comparing the period of highly targeted economic policies, phase III, with those before and after, it is difficult to attribute South Korea’s rapid growth and transformation to the subsidization of selected firms in specified sectors and regions, most notably through cheaper credit. With rising incomes and savings rates, South Korea was already becoming increasingly capital-abundant. Therefore, the country would have naturally transitioned into the more capital-intensive sectors even without the HCI drive.

Perhaps the government sped up this transition through selective targeting. But it also paid a high price, both in terms of lower growth and the structural imbalances resulting from excess capacity in subsidized firms and sectors. This starved unsubsidized firms and sectors of capital and made the subsidized firms and sectors prematurely more capital-intensive than optimal. Because the key instrument of the subsidy was cheap credit, the subsidized firms also ended up being excessively leveraged.

Proponents of targeting contend that any claims characterizing government interventions in the East Asian tiger economies as detrimental to growth must automatically be rejected, given that the economies grew at impressive rates. Political economist Robert Wade has claimed, “To argue otherwise is to suggest that economic performance would have been still more exceptional with less intervention, which is simply less plausible than the converse.” But Ian Little, one of the earliest economists to shed his faith in government intervention as an instrument of growth and development, has countered this argument: “Since the less interventionist Hong Kong, Singapore, and Taiwan grew faster than [South] Korea, it is unclear why Wade thinks it simply less plausible that less intervention would have been better, given also the widespread failure of government industrial policies elsewhere. I find it simply more plausible that South Korea grew fast despite its industrial policies, than because of them.”

Gains Among Favored Firms Do Not Prove the Policy Worked

Empirical research on South Korea’s HCI drive has recently revived interest in the question of the efficacy of industrial targeting. For example, a paper from economist Nathan Lane finds that (1) HCI policies promoted the expansion of directly targeted industries; (2) the policies benefited downstream users of targeted intermediates; and (3) the benefits of HCI persisted even after the policy ended. Another paper from economists Jaedo Choi and Andrei Levchenko finds that “subsidized firms grew faster than those never subsidized for 30 years after subsidies ended.”

Neither paper, however, supports the case for industrial targeting as an instrument of growth. At a basic level, a policy can help favored firms and sectors while hurting unfavored firms and sectors, consumers, and the overall economy. Trade economists have always understood that protection increases the output of protected sectors. Nevertheless, they advise against protectionism precisely because, once the harm to other sectors and consumers is taken into account, the net effect is negative.

Turning to Lane’s paper, none of his conclusions speak to the overall impact of the HCI drive on growth. To put the matter starkly, even the worst kind of state capitalism pursued by India from 1950 to 1985 succeeded in establishing and expanding industries such as steel, cement, fertilizers, and chemicals. Such policies also stimulated downstream users (e.g., machinery, automobiles, scooters, air conditioners, and agriculture) of the targeted intermediates. The effects continue to be felt today. But no one seriously argues that Indian industrial policy under Jawaharlal Nehru and Indira Gandhi was an overall success worthy of emulation by other countries.

Choi and Levchenko estimate that South Korean welfare would have been 3 to 4 percent lower without the HCI drive. I remain unconvinced, however, that their analysis adequately separates the effects of the subsidies from other influences on recipient firms’ long-run performance. Indeed, we know that at least during the HCI drive, overall economic growth took a hit. Moreover, the HCI phase was preceded by a neutral phase during which manufacturing grew even faster. All potential recipients of the HCI subsides had emerged from this phase. Subsidy recipients were screened by banks and government officials, raising the possibility that some were already well positioned for growth. Their subsequent success therefore cannot, by itself, tell us how much the subsidies contributed. The relevant comparison should be with how those same firms would have performed without government support.

The question of potentially productive firms excluded from subsidized credit must also be considered. An October 1990 World Bank paper reported that HCI sectors received up to four-fifths of manufacturing investment credit. How much promising investment elsewhere was crowded out?

Finally, the Comprehensive Measures for Economic Stabilization program in the early 1980s and the Asian currency crisis of the late 1990s affected the larger enterprises, predominantly those that had benefited from HCI subsidies, differently from smaller ones. For example, HCI subsidy recipients may have been better positioned to benefit from aggregate credit expansion of the 1980s and later, as well as from improved access to foreign direct investment and world markets. Likewise, it is likely that the Asian currency crisis disproportionately squeezed out smaller, non-HCI subsidy recipients. Both factors would have helped HCI subsidy recipient enterprises improve their relative performance.

Lessons for US Policymakers

US policymakers are now promoting national champions, targeting strategic sectors, steering investment, and taking public equity stakes in private enterprises. South Korea’s HCI drive did not use the same instruments for most private firms, but its directed-credit system offers a close economic analog. Both approaches empower officials to choose favored recipients, alter the cost and allocation of capital, and expose the broader public to risks that private investors might otherwise reject. South Korea’s experience can therefore help clarify the dangers of the current US approach.

A careful look at South Korea demonstrates that the periods of fastest growth in its history (phase II, 1963–1972, and phase IV, 1983–1995) were associated with outward orientation, competition, macroeconomic stability, and trade policies that kept domestic relative prices close to world relative prices. The HCI episode (phase III, 1973–1982), which most closely resembles state corporatism, produced the predictable problems of resource misallocation; corporate debt; imbalances between favored and unfavored firms, sectors, and regions; and hard-to-unwind vested interests. Indeed, recovery from the damage required South Korea to undertake massive liberalization, both externally and internally, from 1983 onward.

The core lesson from the South Korean experience is that government has a role. But it is different than the one many have claimed: to largely limit its activity to sound macroeconomic policy, including keeping inflation in check. Selective, firm- or industry-specific state intervention must be taken with caution. The argument for state participation in, or direction of, industry on the grounds of national security or strategic industry development can be pushed too far. It is extremely important to recognize that success cannot be judged solely by the performance of a supported firm or industry. Due consideration must also be given to a policy’s impact on unsupported sectors and consumers as well as overall economic performance and consumer welfare.

Conclusion

South Korea’s economic performance from 1963 to 1995 was truly impressive. Within three decades, the country rose from being among the poorest in the world to a high-income economy. The South Korean government was surely not passive. Throughout the period, it remained not just engaged but an active player. In the middle of this period, the government actively promoted certain firms within selected sectors and regions.

For policymakers in the US and elsewhere, South Korea’s success does not establish the case for selectively promoting favored firms or sectors. The fact of the South Korean government’s activism and interventionism is not in dispute; it surely existed. The real question is whether the most selective and state-directed interventions explain the miracle. Here, the evidence is decisively against the interventionist school. South Korea grew fastest during more neutral, outward-oriented phases, while the HCI drive created serious distortions and was later unwound. That process required significant additional external and internal liberalization, which put the economy back on an 8–9 percent growth path.