• The general policies of economic freedom and limited government have led to remarkable economic growth throughout the United States’ history, making it one of the richest countries in human history.

  • The US continues to be the premier location for global investment and innovation, leading the world in venture capital, foreign direct investment, and stock market capitalization.

  • The United States has largely avoided direct state control of its economy and has one of the freest economies in the world. An emphasis on private markets is one of the main reasons for the United States’ prosperity and success.

The United States has long been a world leader in avoiding direct government control of the economy. While its record is not spotless, government interventions in private markets are typically temporary and are often struck down by a robust set of legal institutions that protect private property. Whether measured by how much of the economy the government owns or by broader indices of economic freedom, the United States has historically ranked among the freest economies in the world. This record of economic freedom has made the US one of the richest countries in human history.

But all is not well today. Recent government actions, particularly under the second Trump administration, have given the federal government a significantly larger and more active role in the private sector than at almost any other point in US history. Private property and free markets currently face one of their greatest threats yet, going beyond traditional, temporary responses to economic downturns and financial crises.

Increasingly, the right and the left demand increased government control of the economy, either through direct ownership of company shares or exerting pressure on corporate decisionmaking. These demands rest on claims that the US is losing its industrial and technological edge while ordinary families struggle to get ahead. Are these claims true? And will the proposed solution—more government control of the economy—solve the alleged economic woes?

The narrative of economic decline is wrong. But the situation could always be improved: Economic growth could be faster, and we could have even more technological advances—increasing productivity, the ultimate driver of prosperity. Not only will government control of business decisions fail to improve economic outcomes, but it will also likely make them worse.
The American Economy Has Been an Engine of Prosperity

Since the country’s founding, America has been a place where the frontier of economic growth has been pushed beyond all previous human experience. It had a good head start: Among countries with data available from the Maddison Project Database, the US was among the five richest economies in the world in 1775, as measured by average income (GDP per capita). The country was roughly on par with Great Britain at the time of separation and well ahead of other emerging economies such as France and Germany.

The US took this head start and ran with it. By the beginning of the 20th century, the US was at the top of the heap in terms of average income—surpassing even the United Kingdom, the cradle of the Industrial Revolution. The 20th century was undoubtedly the American Century, with the country’s already world-leading GDP per capita increasing by almost 500 percent. In 2000, only a few oil-rich countries and tax havens had higher average incomes. GDP per capita in 2000 was 40 percent greater in the US than in Western Europe.

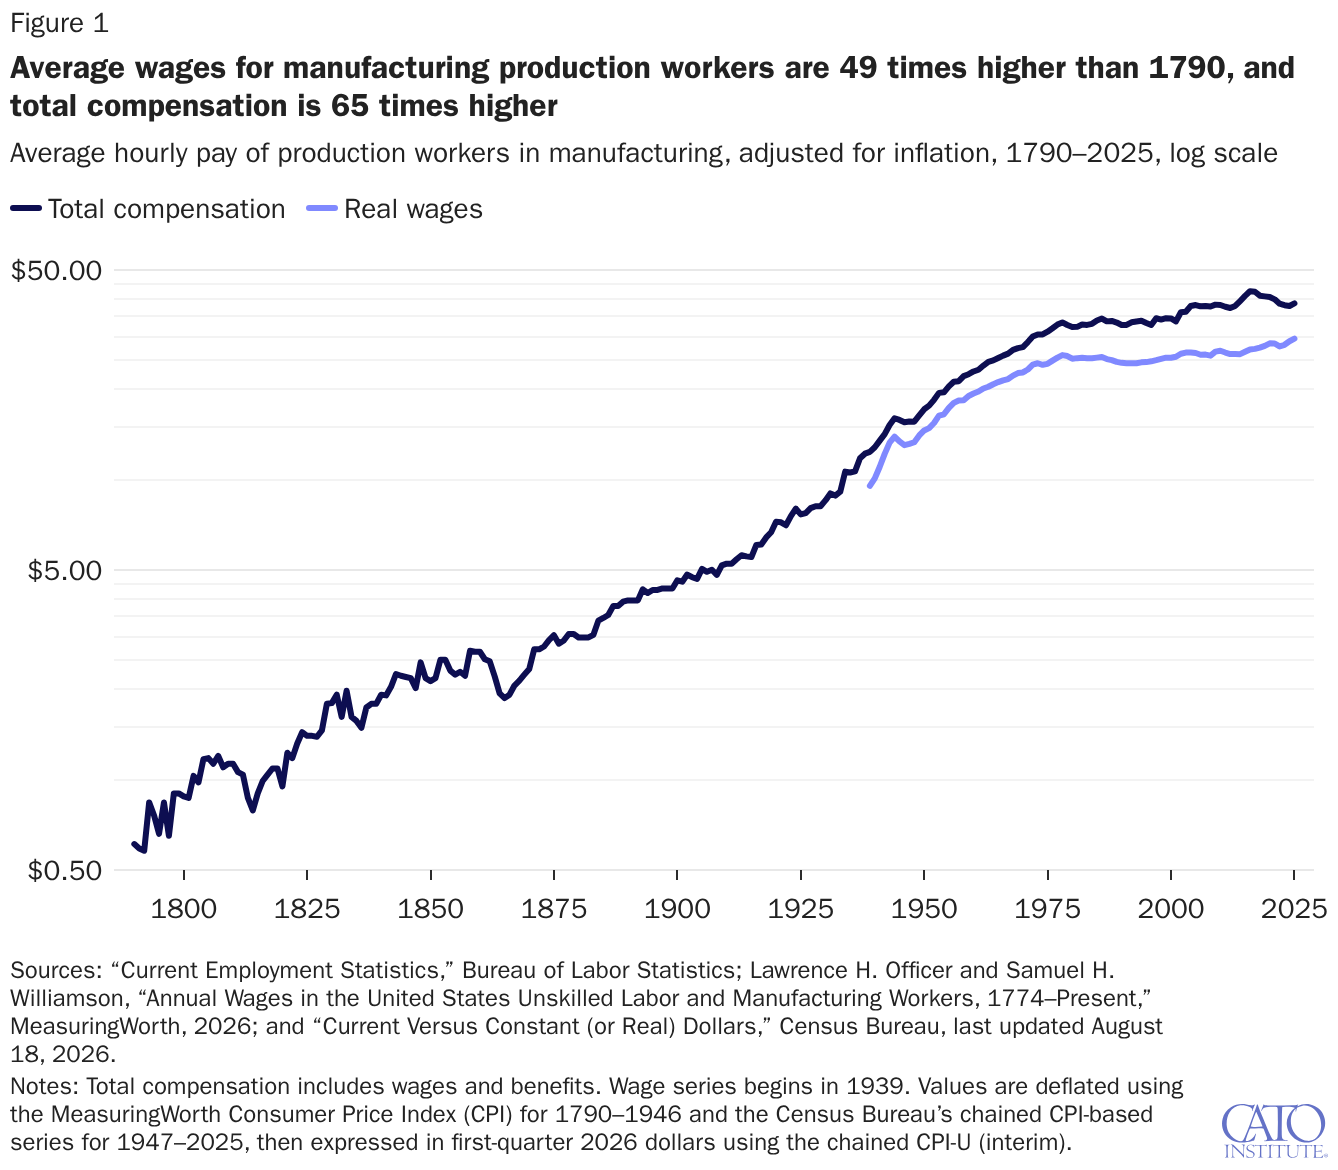
Similar trends are apparent in Figure 1, using average wages rather than GDP per capita. The average wages are for manufacturing workers, excluding supervisors, so high-earning outliers will not distort the data. The chart is on a logarithmic scale, showing growth rates over long periods (e.g., the percentage increase from $0.50 to $5.00 is the same as the increase from $5.00 to $50.00). All data are expressed in inflation-adjusted terms, using price indexes developed by economic historians and labor statisticians.

Average wages for manufacturing production workers are 49 times higher than 1790, and total compensation is 65 times higher

It is possible to look at Figure 1 and be pessimistic, given that the rate of increase for manufacturing wages has slowed down in recent decades. Several reasons underscore why this pessimism is unwarranted. To begin with, the wage growth rate in the mid-20th century was unusually high; in some senses, the United States is returning to historically typical growth rates. Also, Figure 1 uses manufacturing wages to ensure consistency over time; however, as discussed in the next section, manufacturing is a much smaller share of the economy today. Looking at a broader measure, such as median personal income, the increase has been much more substantial: a real (inflation-adjusted) increase of 57 percent from 1974 to 2024, far exceeding the 20 percent increase in real manufacturing wages.

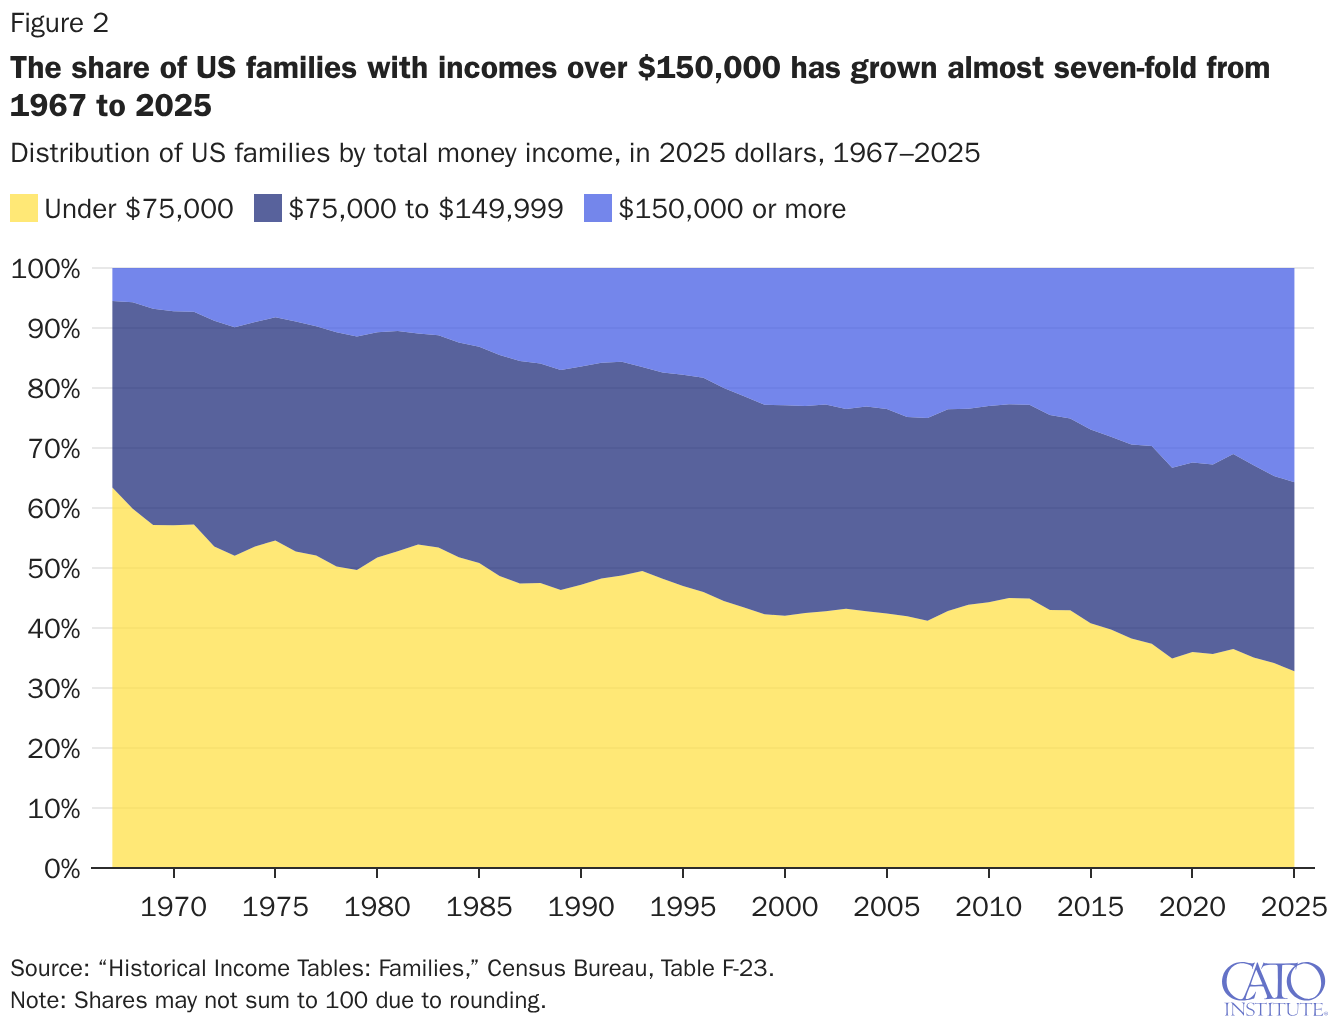
Another measure that shows recent growth in prosperity is the distribution of family income in the US. Figure 2 shows that in 1967, just about 5 percent of families in the US had incomes over $150,000 (stated in 2025 inflation-adjusted dollars); by 2025, more than one-third of families fell in this group. Some of this increase is due to more earners in the family, but not most of it: Over half of families in 1967 already had multiple earners, and that share has only risen a few percentage points. Figure 2 should also help overcome any pessimism about the slowdown in growth at the end of Figure 1.

The share of US families with incomes over $150,000 has grown almost seven-fold from 1967 to 2025

Manufacturing Has Changed, Not Disappeared

In Figure 1, manufacturing workers’ wages were used to show long-run trends. This might seem puzzling to some readers: Isn’t manufacturing on the decline? Indeed, as a share of total employment, manufacturing jobs have been falling since the 1960s and, in absolute terms, since about 2000.

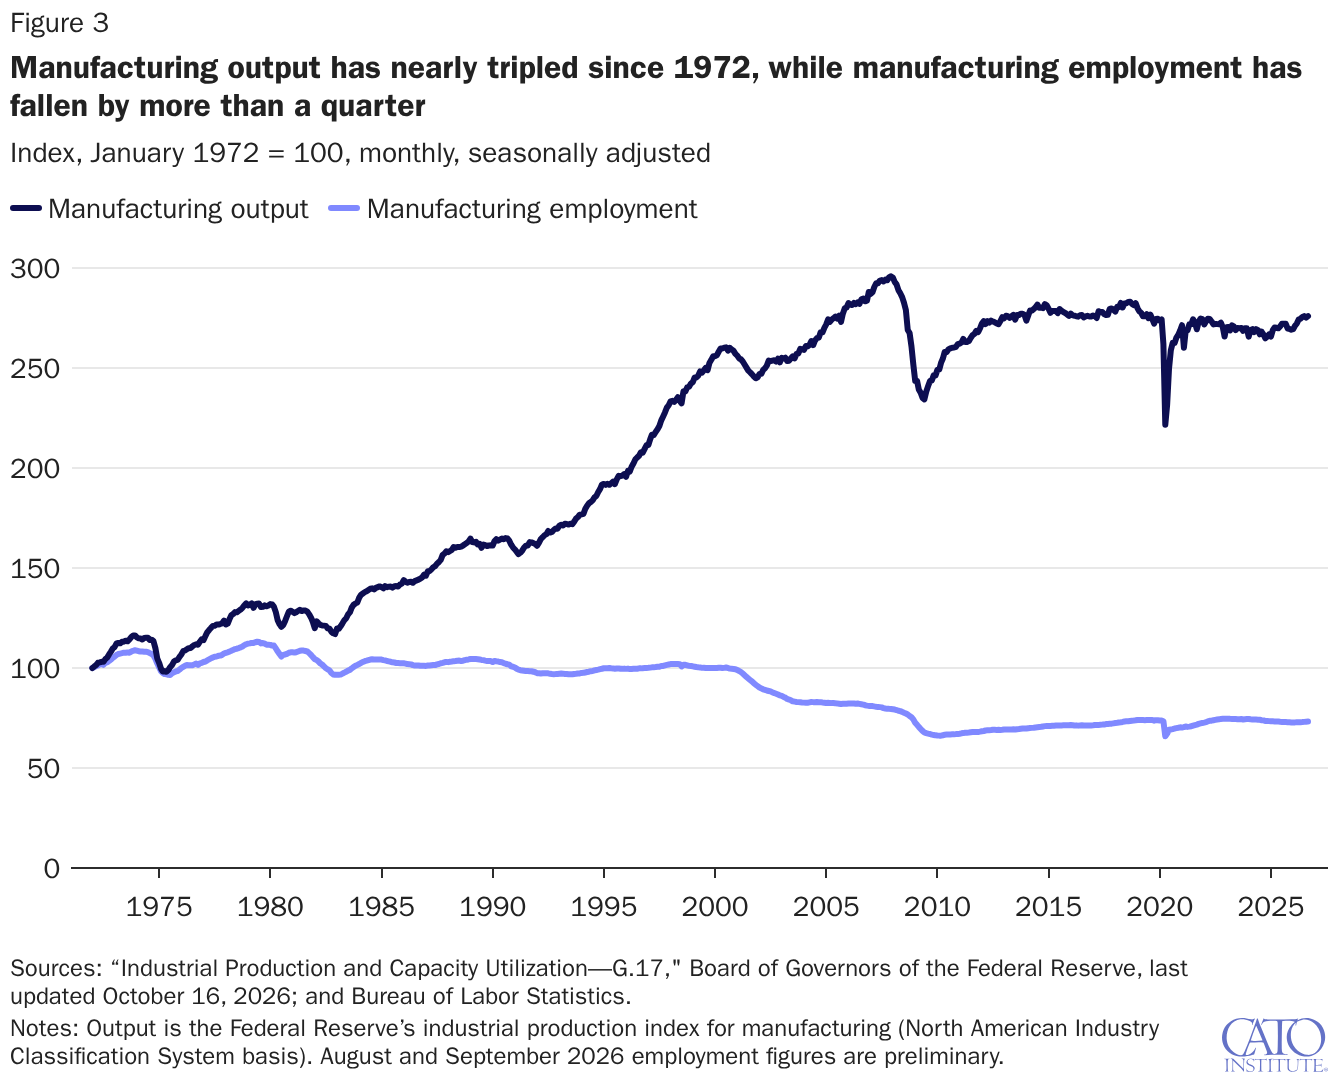
Does this mean that manufacturing is dead in America? Certainly not. If we look at total manufacturing output, as measured by the industrial production manufacturing component, it is near record highs. Figure 3 shows that manufacturing output has increased by about 175 percent since 1972 (the year this data series begins). The only time manufacturing output was noticeably higher was in the years immediately before the Great Recession of 2008–2009, by which time manufacturing output had recovered from the initial “China Shock” of 2000–2001.

Manufacturing output has nearly tripled since 1972, while manufacturing employment has fallen by more than a quarter

Figure 3 also shows the long-run trend in manufacturing employment referenced earlier, with total manufacturing employment today about 27 percent below its 1972 level. But keep in mind what that means: Output per worker in manufacturing has increased even more. Productivity gains in manufacturing have allowed the US to produce much more output than during the so-called “golden age of American manufacturing” (usually dated from the end of World War II until the 1970s), requiring fewer workers to make a lot more physical output. (It was only after about 2010 that productivity increases halted.)

Focusing too much on manufacturing also poses a danger. Even in its heyday, 30 percent of American workers were in manufacturing—a fair few, to be sure, but that means almost three-fourths of the workforce was in other industries. Today, manufacturing accounts for less than 10 percent of employment—a fact that causes some hand-wringing, but more than necessary.

While manufacturing jobs have historically paid above-average wages, that has not been true for almost two decades. Manufacturing wages today are below the national average, and several large sectors of the economy pay much better wages. Of course, some of these higher-paying industries require higher levels of education than manufacturing does. Still, even construction—probably the closest substitute for the type of industry that used to dominate manufacturing—pays significantly more than manufacturing does. While the construction industry does not employ quite as many Americans as manufacturing, it has been growing consistently, with total construction employment at record highs.

America Isn’t Short on Capital or Innovation

The fixation on factory employment misses much of what drives the modern American economy. The broader question is whether the United States has lost the ability to finance new enterprises, conduct research, and turn ideas into commercially useful technologies. The best available data suggest that the US continues to have ample capital to finance cutting-edge innovations.

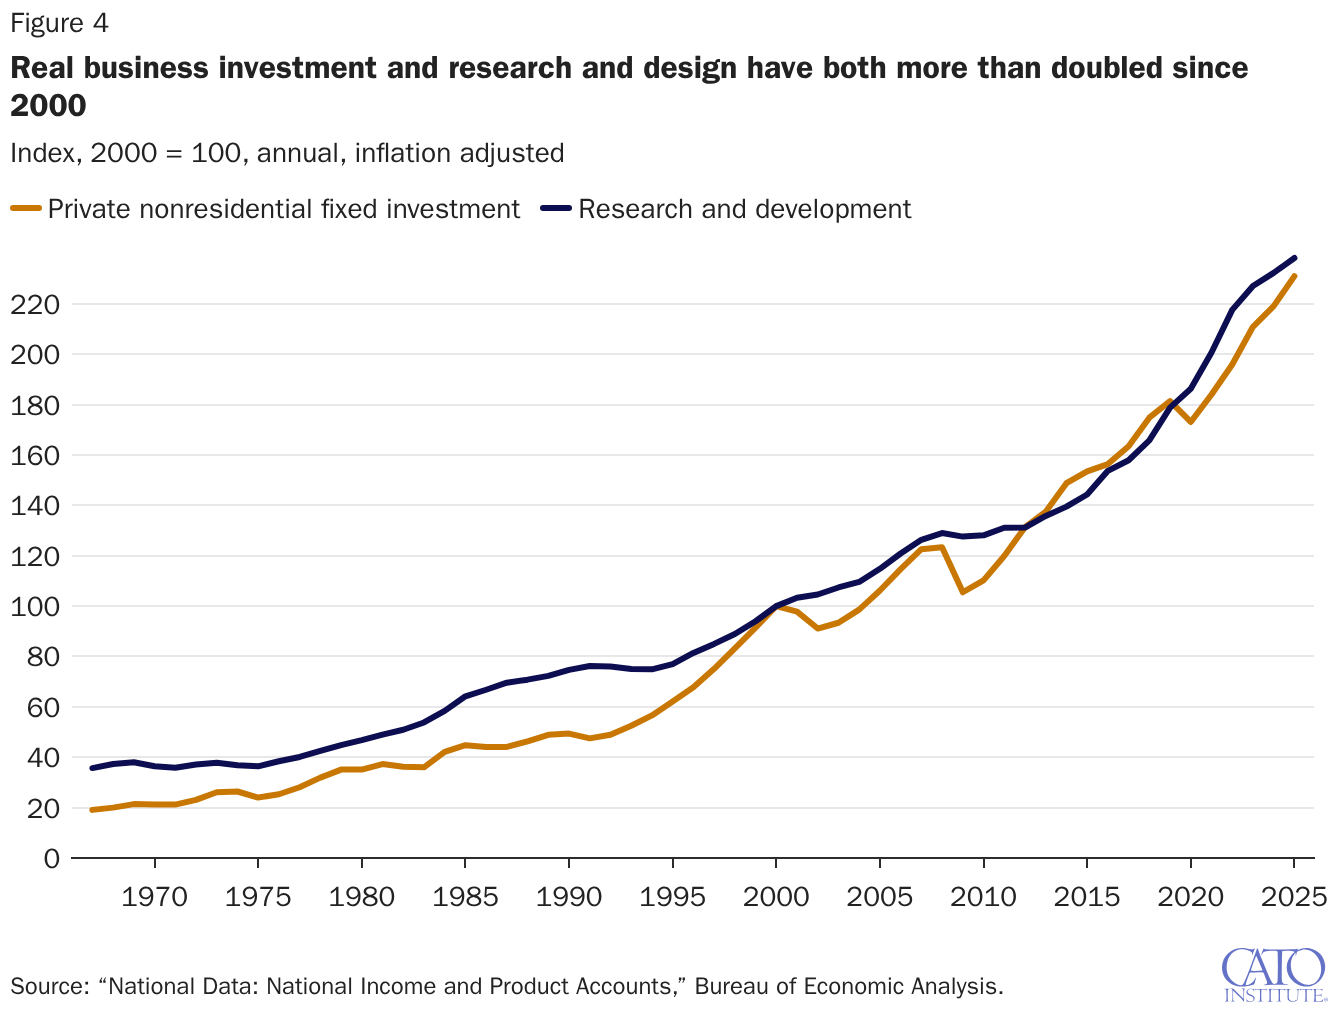
Several measures found in the Bureau of Economic Analysis’ national income and product accounts (the data underlying macroeconomic indicators such as GDP) paint a broad picture of investment in the US. A fairly broad measure, such as private nonresidential fixed investment, or a narrower measure, such as research and development (which focuses on expenditures related to intellectual property development), can be used. As seen in Figure 4, both measures are at record highs (adjusted for inflation), having more than doubled in real terms over the past 25 years. Importantly, most of this research and development is privately funded, with spending in recent years noticeably higher as a percentage of GDP than in the past.

Real business investment and research and design have both more than doubled since 2000

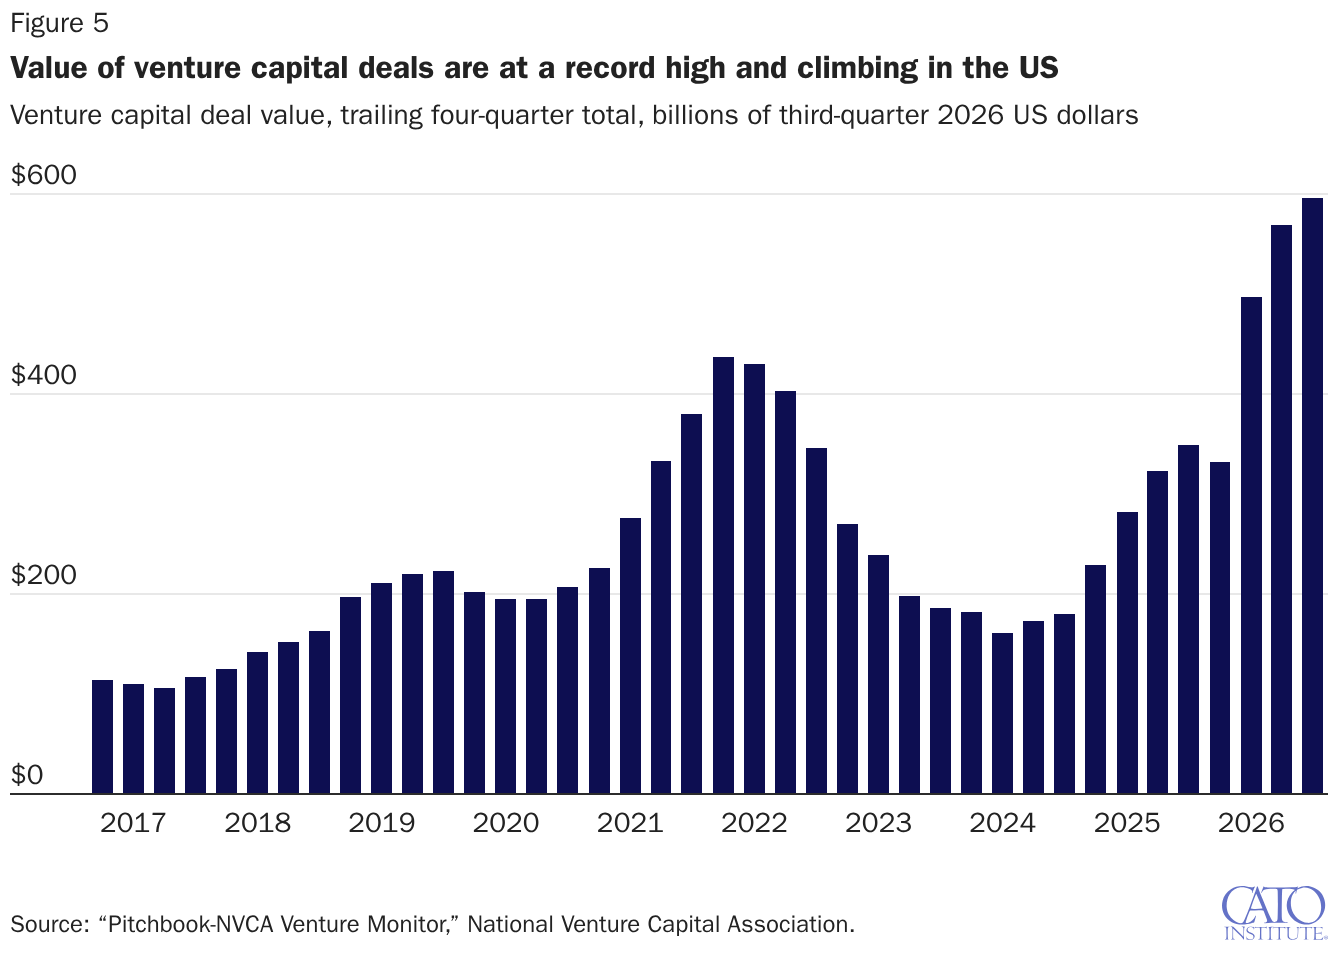
Narrower measures than those shown in Figure 4 provide a more focused picture of investment for the newest, cutting-edge innovations and technologies. Venture capital (VC) is an important source of funds for innovation—especially AI investment in recent years—and private organizations estimate the total value of VC deals in the United States. For example, PitchBook and the National Venture Capital Association produce quarterly estimates on the number and size of VC funding deals. Figure 5 uses their data to show a four-quarter moving total of funding. Something of a boom in VC funding happened in 2021, followed by a lull over the next few years. Still, with the new opportunities presented by AI in 2025 and 2026, VC funding has come roaring back to its highest level on record (adjusted for inflation). And the US is by far the world leader in VC funding, with around 50 percent of global VC fundraising occurring in the US in recent years.

The US not only dominates in funding for new innovations, but its capital markets are also massive. In total, US companies have about 50 percent of the value of market capitalization in global stock markets, which is actually an increase from where it had been a decade ago (about 40 percent). Nowhere else in the world comes close: China and the European Union (EU) are each around 10 percent of total global market capitalization.

Value of venture capital deals are at a record high and climbing in the US

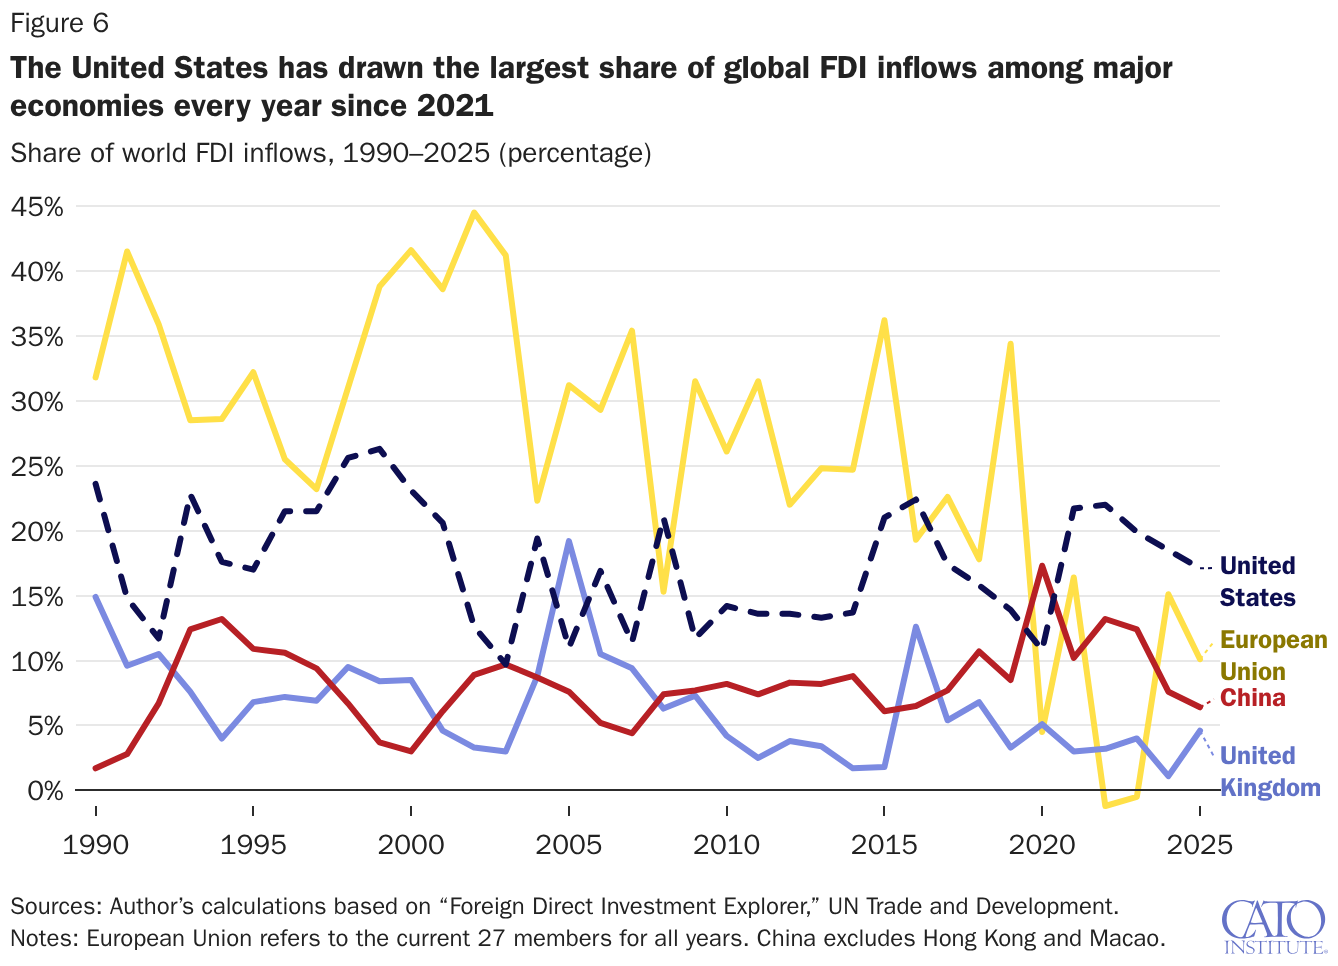
The US also continues to be the best place on the planet for foreign investors, as seen in Figure 6. It was the top country for foreign direct investment (FDI) in 1990 and continues to be the top country today. Contrast that with the EU, which was the destination for 32 percent of FDI in the 1990s on average—more than the US—but only 14 percent in the most recent decade. This claim uses the current boundaries of the EU and projects them back in time. Or consider the United Kingdom, which was the second-largest recipient of FDI in the 1990s but has declined significantly since then. Additionally, the growth of China as a location for FDI is well-known, but it still comes nowhere near matching the United States’ share. Even if we include Hong Kong in China’s figures, the US still had a larger share in 2025: 17 percent of worldwide FDI inflows versus 14 percent for China and Hong Kong.

The United States has drawn the largest share of global FDI inflows among major economies every year since 2021

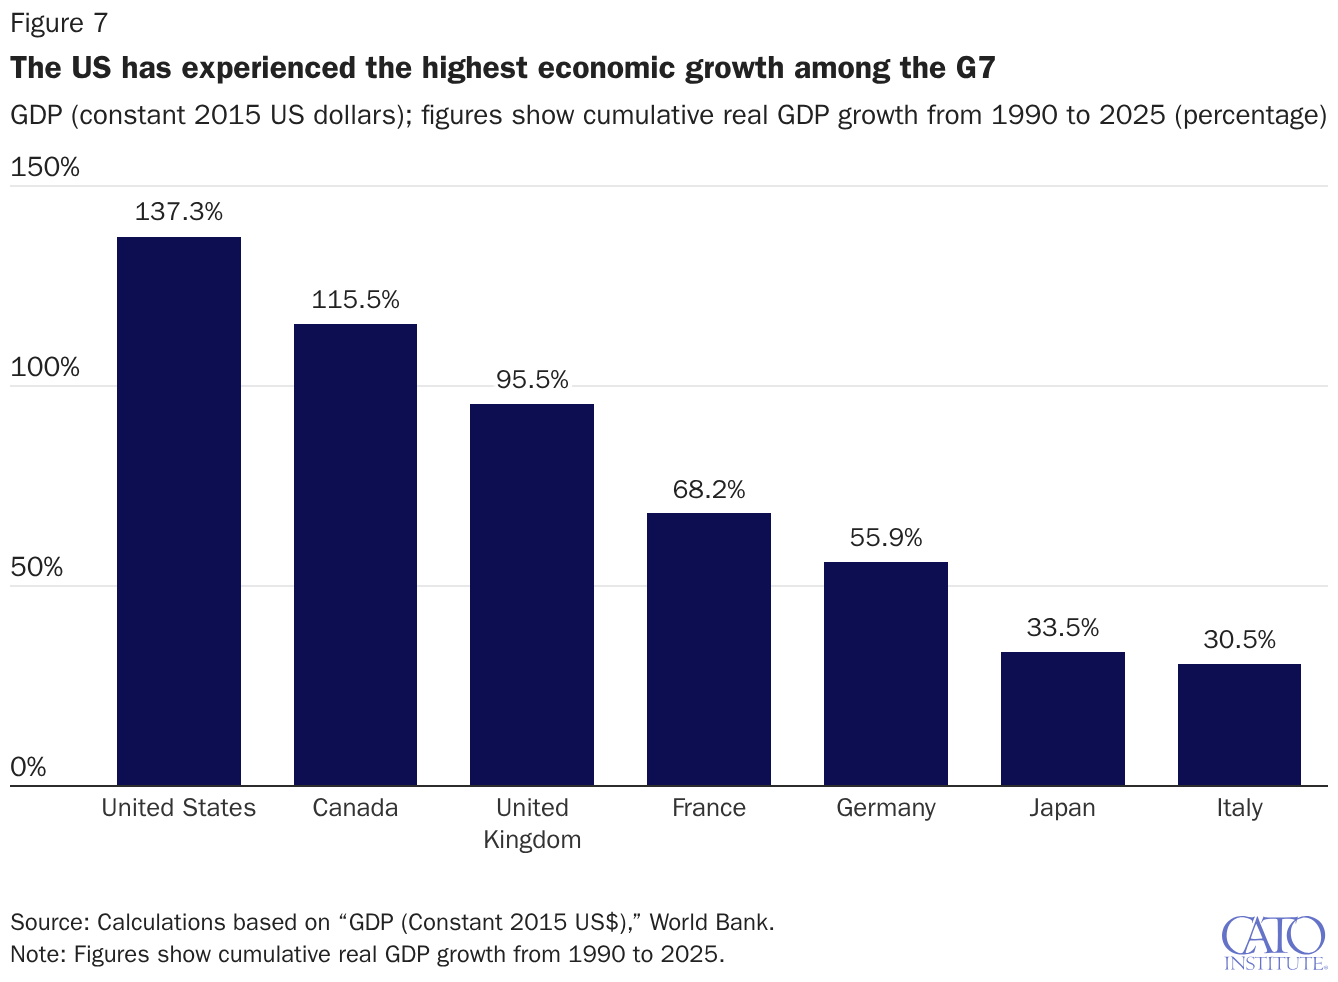
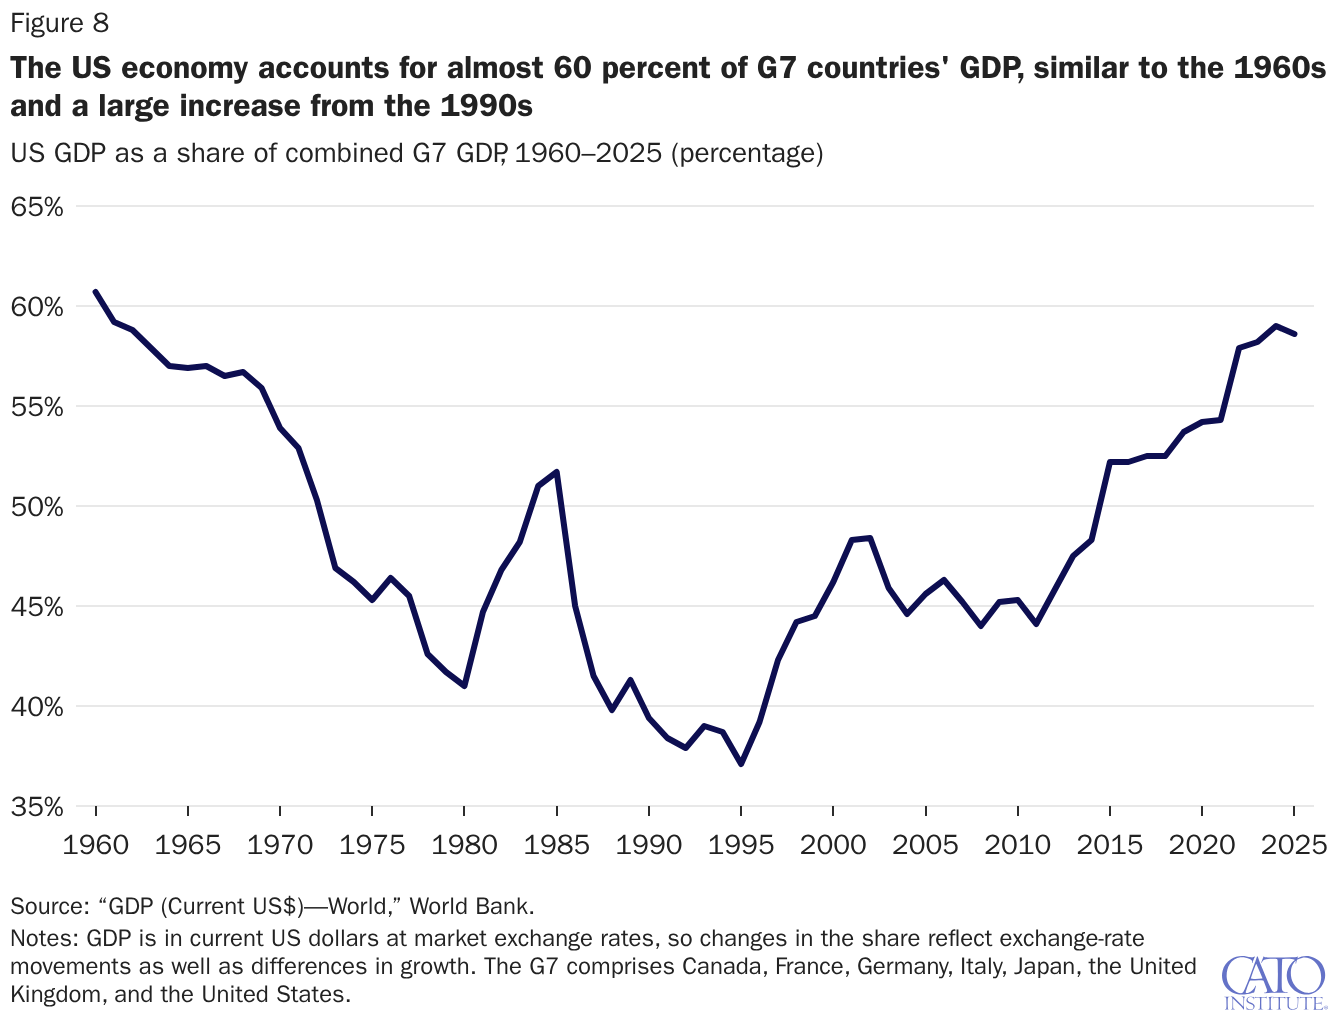
As shown in Figure 7, the continuing dominance of the US economy is evident in its relatively faster economic growth compared to peer countries such as the Group of Seven (G7), which includes Canada, France, Germany, Japan, Italy, and the UK. Figure 8 shows that the US share of this group’s total GDP has been rising since the 1990s, as these other large economies have stagnated relative to the US. The United States’ share of G7 GDP is almost 60 percent today, as high as it was in the “good old days” of the 1960s.

The US has experienced the highest economic growth among the G7
The US economy accounts for almost 60 percent of G7 countries' GDP, similar to the 1960s and a large increase from the 1990s

Private Ownership Has Been the American Default

The perceived decline in manufacturing has led to increasing calls for Washington to “do something”—namely, expand government control of the economy to correct these supposed ills. However, the United States has a long history of avoiding centralized control of the economy. A strong case can be made that the prosperity seen in the long-run trends from Figures 1 and 2 is a direct result of the relatively hands-off approach of federal and state governments. To understand how much or how little the government controls the economy, several measures compare countries’ records of free versus government-controlled markets, some tracing back decades or longer.

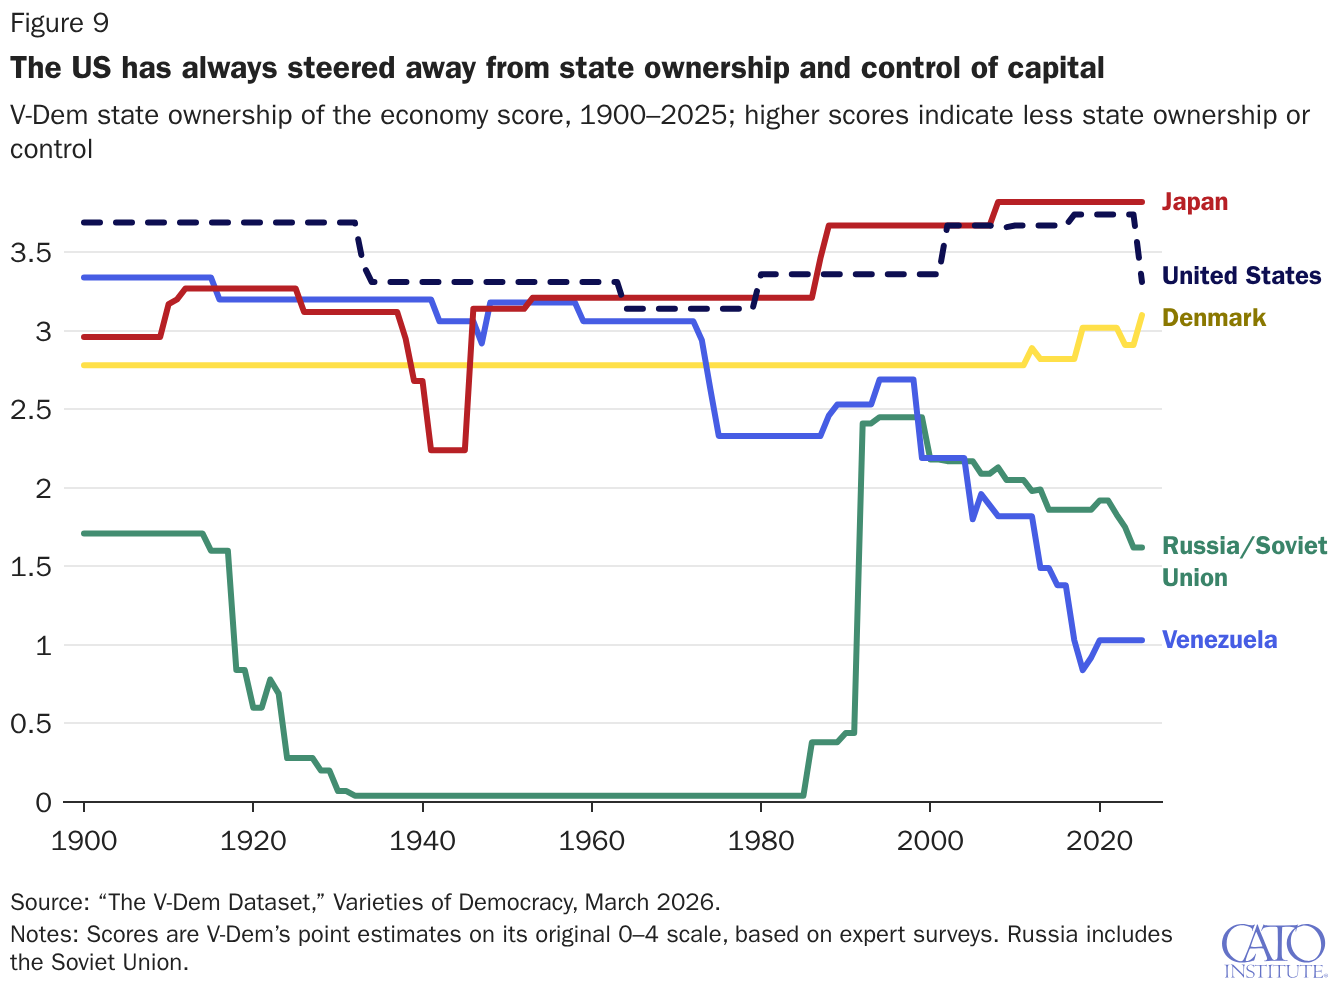
One prominent measure comes from the Varieties of Democracy (V‑Dem) project, which tracks state ownership of the economy. V‑Dem assesses countries on a 0–4 scale, where 0 indicates total state control of capital and 4 indicates that very little valuable capital is controlled by the state. The scores are derived from expert surveys; while they do not measure direct quantitative outcomes (such as spending ratios), the database is widely used in academic research.

Throughout US history (V‑Dem estimates extend back to 1789), the country’s state ownership score has remained between 3 and 4, indicating that somewhere between “some valuable capital” and “very little valuable capital” was owned or directly controlled by the state. The historical low point for the US was 3.14 (1964–1979), a period when sectors such as trucking and airlines were subject to heavy regulations over pricing and business decisions. Even then, the US never instituted widespread, structural economic controls.

As recently as 2024, V‑Dem rated the US as the second-least government-controlled economy, with only Japan having a slightly higher score. That changed dramatically in 2025, with the US score slipping significantly and the rank dropping to 16th. The V‑Dem variable itself does not tell us why this decline occurred, but its annual report highlights the broader decline of liberal institutions in the US. Figure 9 shows the United States’ score on this measure since 1900, along with a few other countries, and gives a sense of the variation in this measure.

The US has always steered away from state ownership and control of capital

As the data make clear, the US did not become the largest economy in the world through policies of direct state interventions to steer the economy. To the contrary, more than almost any other country, the United States has maintained a largely free-market economy. Even when governments have intervened, as they certainly have throughout US history, the interventions have rarely involved taking direct control of private industry and capital. It’s useful to understand why this free-market stance has been the case. And Americans like it this way: A recent survey in August 2026 from The Economist and YouGov found that 58 percent of Americans think it is a bad idea “for the federal government to own shares in major U.S. companies,” with only 11 percent thinking it is a good idea. This aversion to public ownership cuts across party and ideological lines, including among President Trump’s own voters (only 17 percent think it is a good idea).

Conclusion

The United States has reached a critical juncture regarding government involvement in the private economy. Recent federal interventions—most notably the acquisition of equity stakes in key industries and attempts to restructure commerce through executive trade policy—have marked a clear departure from the nation’s historical framework of economic freedom.

These policies threaten the very economic dynamism they aim to protect. Academic research consistently demonstrates a strong link between economic freedom and long-term economic growth; expanding government control risks slowing productivity and depressing future incomes. Furthermore, emerging research indicates that state ownership of enterprise can erode civil society by entangling private commerce with politics.

Reversing state intervention in the US economy is necessary not only to restore economic efficiency but also to prevent the normalization of a model of state capitalism that future administrations might expand even further.