I’m perplexed by the discourse about the U.S.’s disinflation.
The PCE annual inflation rate — the measure the Fed targets — has fallen from a high of 7.1 percent in June 2022 to just 2.6 percent in November 2023. People are asking: what caused this?
Starting mid-last year, notable commentators like Paul Krugman interpreted the simultaneous trends of sharply falling inflation, robust real growth, and low unemployment as vindicating “team transitory.” Inflation, this implies, would have fallen significantly anyway, without Federal Reserve action to tighten monetary policy.
Since then, others, such as Mike Konczal, have expressed an even stronger version of this thesis, which says that the disinflation we’ve seen has overwhelmingly been due to improvements to aggregate supply pushing prices lower, and little to do with weakening demand. Janet Yellen, Joe Biden’s Treasury secretary, has even claimed government policy helped here, writing that the administration has “helped ease supply-chain bottlenecks that had contributed to a surge in goods inflation.”
I feel as if I am going crazy, because this supply-side explanation just isn’t what I see in the headline economic data.
Let’s start with the basic equation of exchange that tells us:
M x V = P x Y
where M is the money supply, V money’s velocity, P is the price level, and Y is real output. This identity simply tells us that total spending in the economy is equal to the nominal value of total output.
One can rearrange that equation into a dynamic form to show:
Inflation (% ∆P) = Total Spending (% ∆M + % ∆V) — Real Output Growth (% ∆Y)
Because M x V = P x Y, the growth of total spending (% ∆M + % ∆V) is exactly equal to the growth rate of Nominal GDP (% ∆P + % ∆Y). So looking at simple trends in Nominal and Real GDP should give us a reasonable guide as to whether demand or supply changes can explain the disinflation we’ve seen since mid-2022.
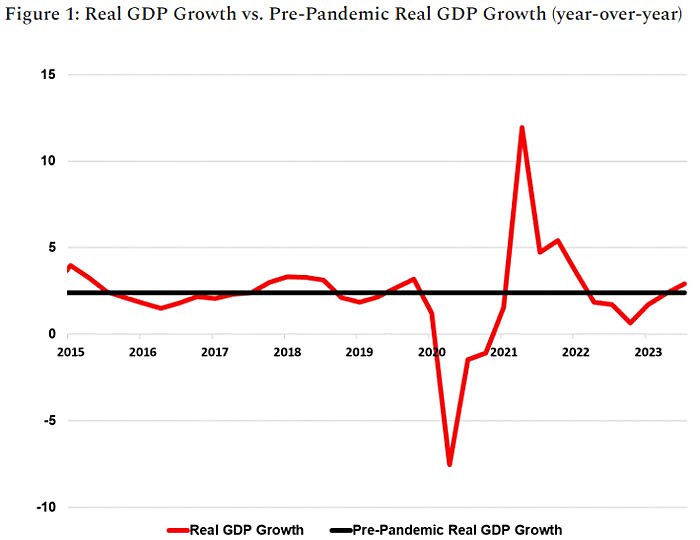
Now, if this rollercoaster on inflation was a supply-side story, we’d have expected to see a sharp fall in real output growth happen alongside inflation peaking in mid-2022, followed by booming real output growth alongside inflation falling more recently. There were indeed clear supply problems as an overhang from the pandemic and stemming from the Ukraine war. As a result, it’s true that the growth of real output by Q2 2022 (when inflation was peaking) was lower than the pre-pandemic trend at 1.9 percent (although not catastrophically low). It’s true too that by Q3 2023, real output growth was stronger at 2.9 percent.
So there’s certainly some apparent validity to the supply-side story. Yet, going back to our dynamic equation, this difference implies (for a given total spending growth) that improvements in real output growth might explain just over 1 percentage point of the difference between peak inflation in mid-2022 and inflation today. Yet the inflation rate has fallen by 4.5 percentage points over that period! Changes in supply conditions therefore cannot explain *all* the disinflation.
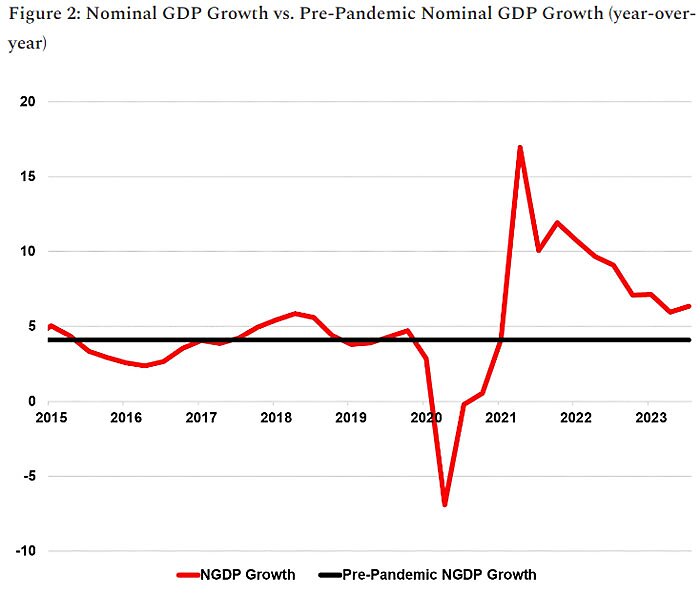
On the other hand, graphing nominal GDP growth shows that there was a significant sustained uplift in total spending growth (or what we might call “aggregate demand” growth) from early 2021 onwards. Importantly, the growth rate of total spending has been falling back somewhat towards its pre-pandemic trend since 2022, although still elevated, and this has coincided with inflation falling but still sitting above target.
In Q2 2022, when inflation was peaking, total spending had grown at a massive 9.6 percent per year. By Q3 2023, that had fallen to 6.3 percent per year. While this rate remains above the pre-pandemic trend – partially explaining why inflation still exceeds the target – it represents a significant decline in total spending growth. Indeed, our dynamic equation of exchange implies that this slowdown in spending growth can perhaps explain just over 3/4 of the fall in the inflation rate from its peak to today, with improved real output growth explaining the remaining quarter.
If those charts aren’t intuitive to you, another way of summarizing this is in the table below, which simply looks at annual real and nominal GDP growth in Q2 2022 and Q3 2023, and compares it with the pre-pandemic growth trend.
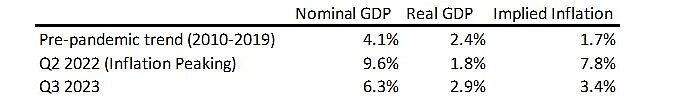
As you can see, it’s very difficult to look at these headline numbers and conclude that supply-shocks impairing real GDP growth were the dominant reason either for the peak of inflation, or indeed for the disinflation we’ve seen since. The observed trends in total spending growth provide a much more convincing explanation for what’s happened, big picture, since mid-2022.
The primary responsibility for inflation and monetary policy, of course, lies with the Federal Reserve, which seeks to alter its monetary stance to affect total spending growth. Given that money supply growth has been negative since the end of 2022 (including falling by 3.3 percent over the past year), it is bizarre to me that so many people casually dismiss the idea that monetary tightening might have played a key role in squeezing inflation.
So, why are so many smart people claiming that disinflation has nothing to do with demand?
Scott Sumner, I think, gets closest to an explanation. A lot of Keynesians see that unemployment is still low, or that real consumption expenditures are on trend, and can’t fathom how anyone could argue that a slowdown in demand explains what we’ve seen. That’s because they think real downturns or unemployment *cause* disinflation, as opposed to unemployment being caused by disinflations where total spending growth is too slow, or even negative.
As Scott shows, although there’s been a significant slowdown in total spending growth since mid-2022, it remains high compared to pre-pandemic levels. That’s totally consistent with inflation falling but still being above target, and with real output growth remaining reasonably strong.
He concludes:
To achieve its 2% inflation target, the Fed must get trend NGDP down to about 3.8%. Perhaps it will do so without triggering a recession. Maybe it’ll over tighten into a recession. Forecasting is a game for fools.
As foolish, though, is to claim that changes in demand conditions cannot explain the bulk of our disinflation. It’s right there in the data.
About the Author
