To a man with a hammer, everything looks like a nail. To Elizabeth Warren, every business pricing decision looks like “greedflation.”
The Senator from Massachusetts shared a Guardian story last week that implied that prices are still high because “corporations are price gouging to boost profits.”
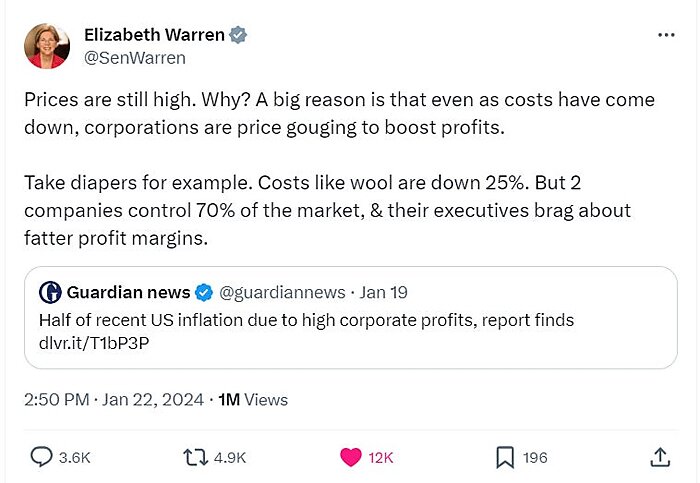
What is the evidence cited in the article she links to? A “study” by a progressive group called “Groundwork Collaborative” that pieces together and misinterprets a few pieces of disparate information and a handful of anecdotes to conclude again that, yes, greedy companies are keeping inflation higher than the fundamentals would dictate.
Comparisons of Consumer and Producer Prices
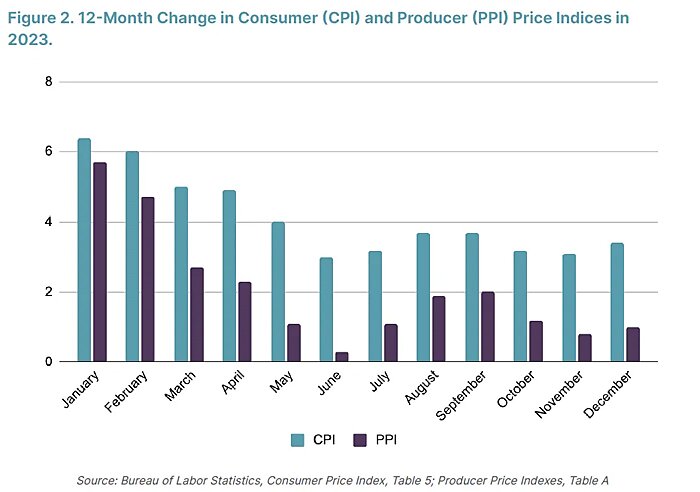
One piece of evidence cited is that consumer prices (as measured by the Consumer Price Index) have been rising faster than the Producer Price Index (see their Figure below). Groundwork interprets this as firms’ input costs rising less quickly than consumer prices — evidence that businesses are padding corporate profit margins on “the backs of American consumers.”
A moment’s reflection might have told the researchers that this interpretation was faulty; not least if they’d looked at the trends in CPI and PPI since 2020 (see my Figure 1 below). If the CPI growing faster than PPI reflects customer prices growing more quickly than firms’ costs, then doesn’t the period 2021 to mid-2022 show producer costs rising faster than prices, suggesting firms were making less in profits then? Strange, given that “greedflation” or “profit-led inflation” was the clarion cry of progressives throughout that period.
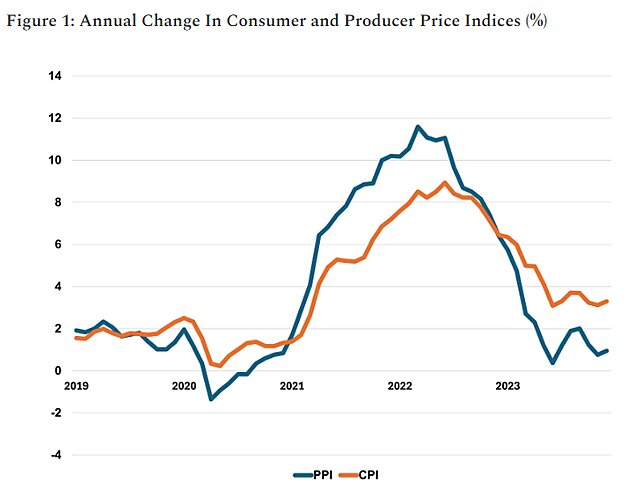
In reality, of course, Groundwork have just misunderstood what these prices indices represent. PPI isn’t an index of firms’ costs — i.e. what firms pay. The measure Groundwork cite (final demand) measures the weighted-average change in the prices domestic producers receive for their output. It’s just another measure of inflation.
To be crystal clear, the CPI is calculated by having agents walk around recording consumer prices on shelves, as well as asking consumers how much they pay in rent and for various other bills. The PPI is calculated by surveying firms on how much they are charging for their final goods and services.
For the same goods and services, the prices recorded in these two indices should be broadly equal. But discrepancies arise because what’s covered by these two measures of inflation differs. The PPI only surveys U.S. firms, so leaves out imports. Consumer prices can be influenced by subsidies and certain taxes. What’s more, the weights attached to goods or services in each index differs. For example, the PPI does not measure price changes for aggregate housing costs; the CPI’s “shelter” component typically accounts to 30–40 percent of that index.
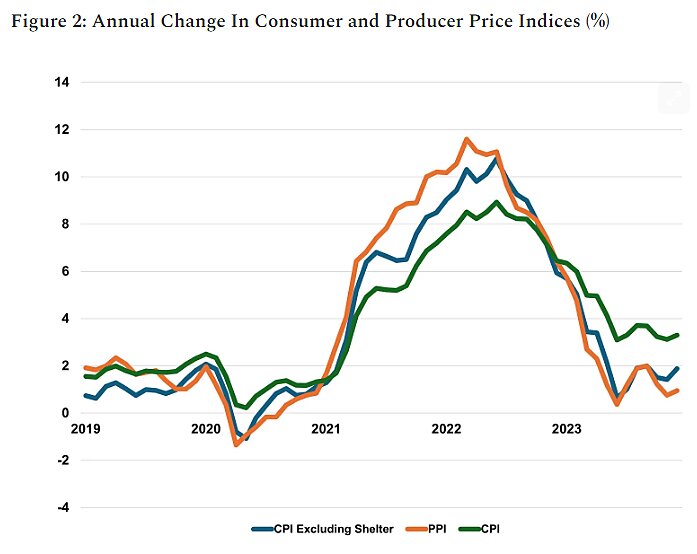
In fact, if you account for this difference between the indexes alone (proxied for by looking at the CPI excluding shelter, see Figure 2) the indices track much more closely. Quite simply, comparing the aggregate CPI to PPI tells us nothing about firm behavior, or what’s driving inflation. It’s just two different ways of measuring the same economic phenomenon.
Are Corporate Profits “Driving” Inflation?
Misinterpreted price indices aside, the thrust of the whole “greedflation” narrative has really been derived from taking basic accounting identities and using them to tell causal stories.
Folks like Groundwork take the truism that says
Profit per Unit = Selling Price per Unit — Unit Cost of Production
and rearrange it to show
Selling Price per Unit = Unit Cost of Production + Profit per Unit
Aggregating across the economy, if they see a period where consumer prices and profits have gone up concurrently, they thus conclude that rising profits have been *driving* inflation.
And this is what national income data showed happened between Q2 2020 to Q3 2021, and they now calculate happened during Q2 and Q3 of 2023. For those latter quarters, they thus write that “corporate profits drove 53 percent of inflation during the second and third quarters of 2023 and more than one-third since the start of the pandemic.”
Of course, this whole narrative is silly, for a couple of reasons. First, there can be external factors that cause profits and price rises to occur simultaneously. Let’s suppose, for the sake of argument (smirks), that a central bank allows the money supply to get out of control for a period. This can cause a massive increase in spending in the economy. That extra demand for goods and services can produce rising consumers prices AND rising profits across many sectors in the short-term, not least because wages (a big cost for firms) tend to be stickier. Prices and profits would thus rise. Yet it would be monetary excess causing both, not greedy companies’ profits driving prices.
Second, Chris Conlon, an economist NYU Stern School of Business, has explained to me that the way “profits” are measured by Groundwork is to just use national accounts data to obtain what value-added goes to labor and other inputs, with the remainder ascribed to “profits”. “This,” he says, “includes things like retained earnings which firms might use to invest or expand capacity. If this line item [profits] were zero, they’d never been able to expand or invest.” Accounting identities thus don’t get to the heart of what’s animating businesses.
It’s therefore crucial to understand what Groundwork have been trying to with their statistic suggesting 53% of inflation in the second and third quarters of 2023 was driven by profits. During that period prices barely went up. So they’ve been calculating the extent to which a tiny delta for prices can be accounted for by a tiny rise in profits over that period.
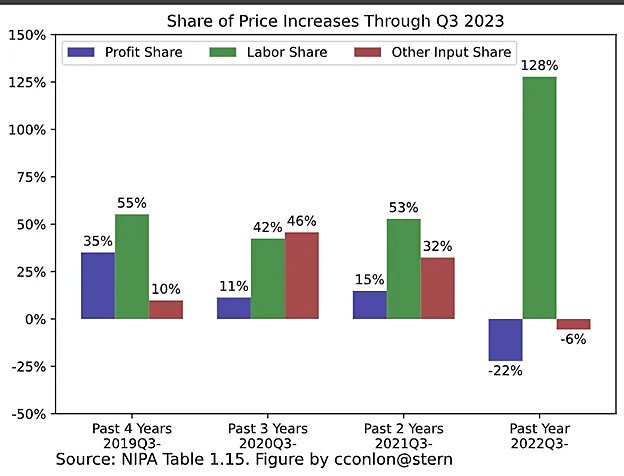
Why that specific time period? Well, Conlon has the answer: if you look over a slightly longer period (like the year Q3 2022 to Q3 2023) profits accounted for, by their logic, minus 22% to the price rise, while labor costs more than accounted for inflation (positive 128%). In other words, worker compensation growth eclipsed consumer price rises and corporate profits declined. That’s because wages have grown more quickly than inflation (as we’d expect) and corporate profits actually peaked back in mid-2022.
In fact, Conlon has replicated Groundwork’s own methodology and shows that, when you look over longer periods, profits account for a much smaller share of the increase in price rises in the past two or three years — precisely the time when greedy companies supposedly ran riot.
This whole way of thinking, as Conlon acknowledges, is deeply flawed. And it has dangerous policy implications. If corporate profits *drive* inflation, then perhaps you don’t need to tighten monetary policy to stem the increase in price rises. A lot of people looked for a boogeyman to explain inflation to avoid the Fed tightening monetary policy and to shift the blame for inflation away from the fiscal and monetary excesses that exacerbated short-term supply-shocks. This latest salvo is another self-serving explanation for why inflation hasn’t fallen even quicker, when much of the public still seems concerned about high prices.
About the Author
