Monthly reports about inflation are too often uncritically expressed on a year-to-year basis, such as the percentage change in the consumer price index from November 2020 to November 2021. Relying on year-to-year percentage increases to describe or predict trends in inflation is frequently misleading, however, for reasons I previously enumerated here, here, here and here. In the third quarter of 2021, year-to-year changes made it appear as if inflation was speeding up when it was slowing down.
Trying to predict the future by gazing in the rear-view mirror at previous year-to-year monthly changes will invite the opposite confusion in 2022, by creating a false expectation that the largest one-time price changes between 2020 and 2021 may continue into 2022.
In November 2021, the two most noticeable 12-month increases in the consumer price index (CPI) were the 33.3 percent increase in the price of energy and the 31.4 percent increase in the price of used cars. By the summer of 2022, the year-to-year increases in prices of energy and used cars will be near zero, if not below zero.
The reopening of world economies in the Spring of 2021 made year-to-year price changes inflate price trends because changes were measured against flat or falling prices during global lockdown months. But demand and prices recovered when restrictions on commerce and transportation were largely ended by February 2021.
By the Spring of 2022, the confusing habit of describing monthly inflation by year-to-year percentage changes will begin to push in the opposite direction. Prices that are rising at the same rate as before will appear to be slowing rapidly on a year-to-year basis. Prices that are not changing at all will be seen as falling toward zero or less.
The first graph provides a straightforward way to illustrate these anomalies by examining one pivotal price that affects many others — the price of crude oil — by showing what would happen to monthly year-to-year percentage changes if crude oil remains near $75 (well above the 2021 median of $69).
From April 2020 to April 2021, the spot price of a barrel of West Texas Intermediate (WTI) crude oil rose by 273 percent to $61.70 in April 2021. That was not because $61.70 was unusually high (it was higher in April 2019; $63.80), but because the $16.55 price of April 2020 was so deflated that U.S. crude oil production collapsed from 13 million barrels a day in March 2020 to 10.45 million in September 2021, before partly recovering to 11.65 million near year-end.
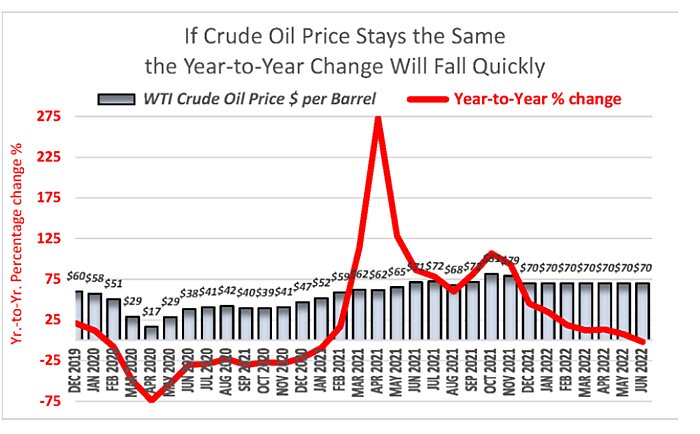
With U.S. oil supply falling and world demand rising as economies reopened, the average price of regular gasoline (which had fallen from $2.88 a gallon in April 2019 to $1.72 in April 2020) quickly recovered to $2.72 in April 2021. The gasoline price was widely reported as 58 percent “inflation” although gasoline was cheaper than in April 2019.
By October 2021, the price of WTI crude peaked at $81.48, though the year-over-year change slowed to 107 percent. The price then settled down to $70 during the first 20 days of December. On December 21, the Energy Information Agency predicted “prices will remain near current levels in 2022, averaging $70 (using Brent crude which is pricier than the WTI). That would be higher than the pre-pandemic price below $60 or the 2021 median price of $69.
If the EIA forecast is right and the monthly price averages$70 a barrel before the November elections, that would rapidly shrink the year-to-year change to 35 percent in January, 19 percent in February, 12 percent in March, ‑1.9 percent in June, and ‑16.4 percent by October 2022. The 12-month rate of oil price inflation would not fall as quickly if the oil price instead averages $75 a month –as depicted in the graph– but the year-to-increase would still drop to 5 percent by June and to ‑7.4 percent by October.
A year-to-year drop of 7–16 percent in the oil price would be modest by previous experience. Year-to-year crude oil prices fell by 34–58 percent in 1986, 1991, 1997, 2001, 2009 and 2015, though it sometimes took more than 12 months for the price to fall that much. Falling year-to-year oil prices, in turn, brought slow or negative year-to-year CPI inflation.
In October 1990, when the price of WTI crude oil was up 78.8 percent from the same month in 1989, the consumer price index was up 6.4 percent from a year earlier. But one year later, WTI crude oil had fallen 35.3 percent and year-to-year CPI slowed to 2.8 percent.
In July 2008, when the price of oil was up 79.9 percent from a year before, consumer prices were up 5.5 percent. But one year later, the crude oil price had fallen 52 percent year-to-year and CPI inflation turned negative, to minus 2 percent.
As we now look ahead to 2022, the year-to-year rise in oil prices will start to turn negative by June if oil stays around $70 or October if it stays near $75. Year-to-year reported inflation in energy-intensive goods and services can likewise be expected to slow sharply as 2022 progresses.
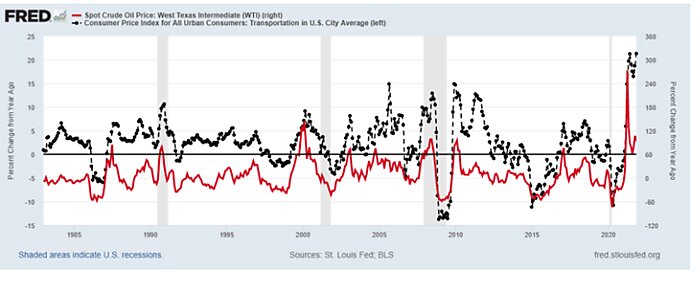
The second graph from FRED (Federal Reserve Bank of St. Louis) shows how year-to-year changes in the CPI for transportation, for example, move up and down with year-to-year changes in the oil price. Producer prices for oil-intensive products such as fertilizer and plastics also follow oil prices up and down. Like transportation costs, those prices also greatly affect prices of other products — such as grain, dairy, and meat prices in the case of fertilizer, and packaged goods in the case of plastics.
A Price That Rises Only Once is Not Inflation
Crude oil is only one price among many that rose rapidly in 2021 but will appear to be falling on a year-to-year basis by the summer of 2022 — even if the monthly price remains the same. (The same logic does not apply, however, to rent and other prices that increased little in 2021).
Used cars offer another excellent example of a 12-month pace of inflation that cannot possibly continue. The CPI for used cars and trucks peaked at 160.4 in January 2001 and had fallen to 139.5 by July 2020. Even in March 2021, the used car index was still below the 1994 peak (151.2) before leaping 30 percent to 197.2 in June. Headlines promptly reported that as an alarming 45.2 percent rate of “inflation” in used car prices, as if it was part of an ongoing trend. But at that pace, used cars would quickly become far more valuable than new cars and the index would reach 286.5 by June 2022 — an impossible trajectory.
The used car index remained roughly unchanged from June to November, averaging 197.3. Even if that number could somehow remain at that record high through June 2022, the recorded year-to-year change of 45.1 percent in June 2021would nonetheless drop to 18.6 percent by April 2022, then 10.5 percent in May and zero in June.
If the used car price index in June 2022 instead dipped back to the more-normal level of March 2021, that would amount to a 23.3 percent decline in used car prices compared with a year before. Discounting of overpriced used cars is to be expected as new vehicle production picks up. IHS Markit forecast a 16.9 percent rise in North America in production of cars and light trucks in 2022, and a 17.8 percent rise in Europe. And KPMG predicts that used car prices could crash by roughly 30 percent before October 2022, a warning that could dampen demand for the increased number of new vehicles by reducing trade-in values.
In short, one thing we can confidently project about 2022 is that year-to-year measures of “inflation” in prices of used cars and energy will be near zero by the third quarter, if not below zero. That is nearly a sure thing, baked-in-the cake.
Once the new Spring and Summer consumer price statistics begin rolling in, embarrassed economists and reporters who had long been pointing backwards at year-to-year price changes to warn of ever-increasing future inflation may have to either switch to a different way to measure inflation or switch to a different tune.
About the Author
