The federal funds rate is the unsecured overnight rate at which banks lend to one another in the domestic U.S. market. For several years after the Fed implemented its crisis-era approach to operations, it wrestled with a soggy federal funds market: the Fed’s response to the crisis had made it difficult to keep the funds rate from dropping through the lower limit of its target range. With experience, and the introduction of new operational tools, the funds rate was eventually stabilized near the middle of the target range.
Beginning in 2018, however, the contrary problem emerged: the funds rate gradually approached uncomfortably close to the upper limit, raising the possibility it could breach it, evading the Fed’s control. In July and September 2019, isolated such breaches actually occurred as just one sign of a severe liquidity shortage in the wholesale money markets. Sustained disruption in these markets, in which large nonfinancial firms, banks, securities dealers, and money market mutual funds can meet a transitory need for cash or invest liquid balances, poses risks to the smooth operation of other parts of the financial system and ultimately to the nonfinancial economy it supports.
The tightening in the money markets is just the most recent manifestation of the fragility and impermanence of an approach to implementing monetary policy that has been somewhat ad hoc since its initiation during the crisis. In contrast to the precrisis operating framework, the current approach is dependent at any point in time on a particular configuration of money market supply and demand. When it changes, as is inevitable in response to shifts in the markets, or to the unintended consequences of policy shifts, the Fed has also had to adjust the mechanics of how it keeps market rates near its target. An important mechanism for the transmission of monetary policy is clear signaling of central bank intentions, and the frequent changes in the operating framework work against clarity.
This article sets out how Fed operations and money markets have evolved in recent years and their implications for normalizing monetary policy and defining a new long-term operating regime. The market rigidities induced by postcrisis regulatory revisions have interacted with the changing monetary operating framework and changing market expectations to produce a succession of disruptive surprises in the money markets, most recently the large increases seen in key money market rates in September 2019.
The revised regulatory framework aims to achieve enduring financial stability and end the vulnerabilities perpetuated by an overleveraged financial system. But by relying on detailed requirements and proscriptions of specific activities rather than credibly phasing out explicit and implicit bailout guarantees, it has eroded the functioning of the money and other financial markets and created obstacles to any new or revived framework for monetary policy, while contributing only modestly to financial stability. This represents a substantial cost of the new regulations that must be set against their putative benefits, costs that might be acceptable if the regulatory approach itself did not miss its mark.
The Postcrisis Evolution of U.S. Monetary Operations
Control of short-term interest rates is the core of how the Federal Open Market Committee (FOMC) has implemented monetary policy, both before and since the crisis. It targets the market-clearing funds rate, at which banks can borrow from or lend to one another to smooth out routine and seasonal fluctuations in cash holdings and keep payment systems in balance.1
The funds market is part of the larger, more-or-less integrated U.S. dollar wholesale money markets. It includes overnight and short-term secured and unsecured lending between commercial banks, and between banks and other intermediaries such as dealers, institutional investors, and money market mutual funds, as well as Treasury bills. The pre- and postcrisis operating regimes both view the funds rate as an anchor for other short-term lending rates, so eroding money market integration is highly problematic.2
The current regime took shape during the crisis as the Fed sought to retain control of short-term rates while drastically expanding the amount of reserves. For decades prior to the crisis, the Fed got close to the desired funds rate by stating a target level for the funds rate and adding or draining the estimated amount of reserves—deposits at Federal Reserve district banks—needed to get the market to clear there. Fluctuations in the supply of and demand for reserves could be estimated with tolerable accuracy. The public’s knowledge of the target rate as well as the Fed’s daily operations made the framework effective in keeping the funds rate near the target, and it was robust to changes in the financial system over the decades it was in place.
But starting at the end of 2007, the Fed acquired a vast amount of assets, at first consisting of emergency loans to banks, dealers, and foreign central banks among others, and from the beginning of 2009, in even greater size, Treasury and agency mortgage-backed securities (MBS). These new assets were not a matter of normal monetary policy. The emergency loans were extended as temporary liquidity support for key markets and intermediaries. The bond purchases, carried out in a sequence of large-scale asset purchases (LSAPs) through 2014, aimed, not to influence short-term rates, which by then were loosely governed by interest on excess reserves (IOER), but to push down long-term interest rates.
The large volume of reserves issued as the liability counterpart to these assets would normally have been expected to lead to a sharp decline in the fed funds rate. To ward off the as-yet unwanted loosening of its monetary stance that could result from a massive increase in its balance sheet,3 the Fed began in October 2008 to pay IOER, remunerating banks for holding a risk-free alternative not only to other money-market lending, but to business and household lending, making reserve balances attractive to suddenly risk-averse intermediaries during the crisis. IOER would also set a lower limit or floor on the funds rate and keep it from straying too far from the target rate. An alternative investment for banks’ cash balances would have to pay at least the IOER rate, while rates on alternatives that paid more would be bid lower.
In the event, bank lending did not expand, but most banks were not as eager as expected to acquire additional reserves and earn IOER. U.S.-domiciled banks, but not foreign banking organizations (FBOs), are subject to Federal Deposit Insurance Corporation (FDIC) deposit insurance fees on all assets, including reserves. Banks in the Federal Home Loan Bank System (FHLBs) aren’t eligible to earn interest on their reserves at the Fed.
So the funds market shrank drastically, with FHLBs lending their uninvested mortgage-loan proceeds to FBOs, and domestic banks content to hold a larger stock of reserves than before the crisis, but for the most part not actively bidding for more.4 As a result, the funds rate stayed well below IOER. U.S. banks were at first not only reluctant to add additional risky loan assets to their balance sheets. They didn’t even wish to add safe reserve balances on which they would earn the spread between IOER and the funds rate. Eventually, as regulatory changes introduced later on came into force, reserve balances came to be disproportionally concentrated on the balance sheets of FBOs and large U.S. banks.5
With IOER not fully effective as an anchor for the funds rate, the Fed began to target a range rather than a level for the funds rate, and in 2013 introduced an additional operational tool, overnight reverse repos (ON RRPs), through which it drains reserves by borrowing from a wide range of intermediaries, not just banks, at a specified rate generally equal to the lower limit of the range. ON RRPs have been used in significant volumes only sporadically.
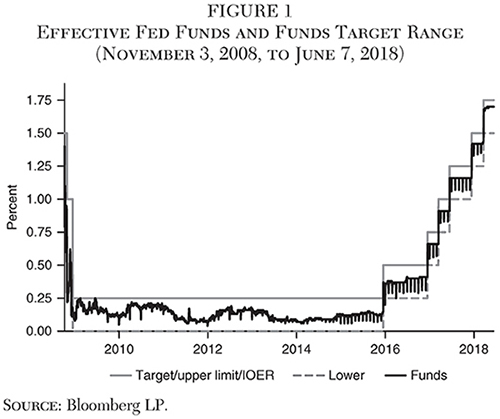
The funds rate, with isolated exceptions, remained confined until early 2018 near the midpoint of its target range, even through the rate hikes that began at the end of 2015 (Figure 1). The use of a range, and the tendency of the funds rate to trade near its midpoint, was optically similar to the Fed’s precrisis framework in permitting the funds rate to fluctuate narrowly at a desired level, and to symmetric corridor systems found in other countries. But it was also quite different in that the upper limit of the range, the level at which IOER was also set, was at least initially intended to be the lower limit. Rather than serving as a ceiling on rates, IOER was a mechanism to keep the funds rate from falling even lower, in a market awash in reserves, through an arbitrage that remained incomplete.6
The Recent Turmoil in the Money Markets
The turmoil that began in mid-September 2019 has been centered in the repo market, in which short-term loans are secured by high-quality bonds, generally Treasuries or MBS. Securities dealers, traders, and many investors finance holdings of Treasury securities by borrowing in the repo markets, using the bonds as collateral. Repo is a much larger market than fed funds, accounts for over half of dealers’ funding, and is a major component of money market mutual fund assets.7 Prior to the crisis, the Fed sought to control short-term rates by operating in the repo market, rather than directly in the funds market, so money market integration was central to its success in implementing policy.
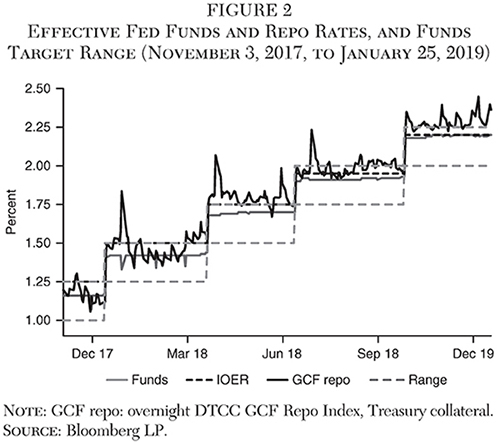
The repo rate should trade at least a bit below the funds rate, as it generally did before the crisis, because repo transactions are secured, while funds trades are not. Reserves are claims on the Fed, but fed funds liabilities to other banks are just unsecured claims. In 2018, the repo rate, which in spite of being secured had generally been higher than the soggy funds rate since the crisis, returned a bit closer to its expected relationship, near but at least at times slightly lower than the funds rate. But the anomalous positive spread of repo over the funds rate persisted even during this time of apparent smooth functioning of the framework (Figure 2).
In late 2016, the funds rate began drifting gradually toward the upper limit of the rising fed funds target range. In October 2017, the FOMC initiated a further step toward normalization: a gradual runoff of assets, slowing the reinvestment of bonds as they mature or pay down. Some liability positions had to decline apace, primarily reserves.
By early 2018, the upward pressure on the funds rate became pronounced enough that the FOMC attempted to offset it by lowering the IOER rate, which had coincided with the upper limit, at first to 5, then to 10, 15, and most recently to 20 basis points below it, leaving it now just 5 basis points higher than the lower limit.8 The expectation was that even if arbitrage can’t fully coax banks into acquiring reserve balances in the funds market when rates are lower than IOER, perhaps it will at least reduce demand and coax them into selling reserves when the funds rate is higher. Lowering IOER within the target range should therefore also depress rates on T‑bills, repo, and other money market substitutes relative to reserves.
With these tweaks, and stronger demand for reserves, the funds rate appeared for a time to be constrained to trade at a rate very close to IOER, in contrast to its previous behavior of trading somewhat below IOER. Superficially, this may have appeared to be only a small change. The funds rate returned closer to the center of the range, but with some room to exceed IOER while remaining within the range (Figure 2). After the successful lifting of rates since 2015, the operating framework seemed to be working well.9 For a time, the funds rate barely fluctuated at all. If it had continued to trade virtually without fluctuation, the funds rate would have been more akin to another administered rate. It would lose much of its remaining appearance as a market rate and its role, and what it adds to that of IOER, would become less clear.
The tightening of money markets led to the March 2019 FOMC decision to halt the slow runoff of assets on its balance sheet that had been in progress since 2017, as well as announcements that it is ready to resume asset purchases sooner than expected. It has been a factor in the rate cuts that resumed at the end of July 2019. Policy tightening had come not only from higher fed funds targets, but from tighter money markets overall and from changes in expectations.
Month- and quarter-end pressures had in recent years typically depressed the funds rate as banks, especially FBOs, lightened up on funds arbitrage trading near balance-sheet reporting dates (Munyan 2015). But demand for reserves has strengthened enough so that the funds rate has been at least as high as IOER on every business day since the beginning of 2019 and has exceeded it consistently since late March. The IOER rate, which was originally intended to act as a floor on rates—and didn’t—and was later intended to draw other overnight rates upward but act as a ceiling on rates, was now lower than the funds rate and its liquidity absorbing function counterproductive.
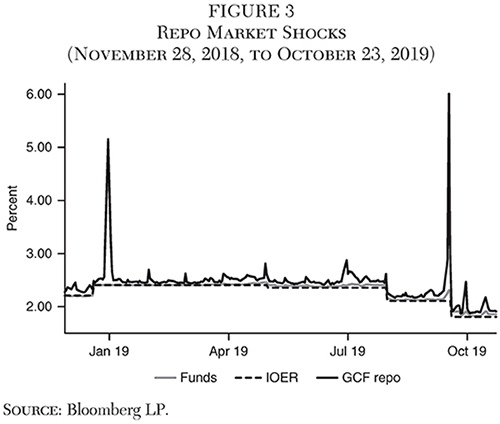
After tightening a bit on September 16, rates on overnight repos spiked up hundreds of basis points the next day. These market moves were shocking. Smaller fluctuations in repo rates are not unusual at month-end and other bank balance sheet reporting dates.10 But these were extreme and occurred in the middle of a month. Trades were recorded at 10 percent, yet banks did not step in to substitute secured repo lending for reserves. IOER had proven ineffective in anchoring rates in both loose and tight money markets (Figure 3).
The Fed responded, beginning on September 17, by conducting repo operations on an increasingly aggressive scale. The Fed had used repos routinely in precrisis operations to temporarily add reserves to the banking system, but not in the past decade, and the average daily amount was now 10 times greater.11 On October 11, the FOMC committed itself to continuing these operations at least through January 2020. It also announced its intention to begin, in addition, regular outright purchases of Treasury bills until further notice. Like the LSAP programs of 2008–13, these are permanent additions of securities and reserves to the Fed’s balance sheet. Unlike the LSAPs, they are not aimed at implementing monetary easing, but are an effort to maintain the current monetary stance. The initial volume of purchases will be quite large: $60 billion per month. These responses to the turmoil were accompanied by a restatement of the Fed’s commitment to keep reserves plentiful—“ample,” as the Fed expresses it—now implicitly estimated as a volume equal to their early September level of $1.45 trillion.12 The Fed had stated in January 2019 that it uses the funds rate as its primary tool for implementing monetary policy changes and IOER as its primary tool for controlling the funds rate,13 and it reiterated that stance now.
Many market participants were puzzled by the sudden shortage of cash and believe repo rates remain susceptible to large swings. The funds rate hasn’t to date pierced the upper limit of the target range by more than a few basis points, and that on only three occasions coinciding with FOMC meeting dates. But even with the large infusions of reserves that began in September and with the funds rate having moved well below the upper limit, confidence has eroded that the funds rate can’t persistently rise above it if reserve demand continues to increase.
Causes of the Tightening in the Money Markets
The shift beginning in early 2018 from soggy to tight money markets came as a surprise. The immediate triggers of the abrupt September 2019 repo spikes included transient factors. But a number of recent changes can be identified that have over time reduced the supply and increased the demand for reserves and brought about an overall tightening of money markets. The relative demand for reserves via-à-vis other money market assets is also shifting in ways that are hard to disentangle. The overall impact of these can be best understood with a widely used reserves supply and demand model (Figure 4).
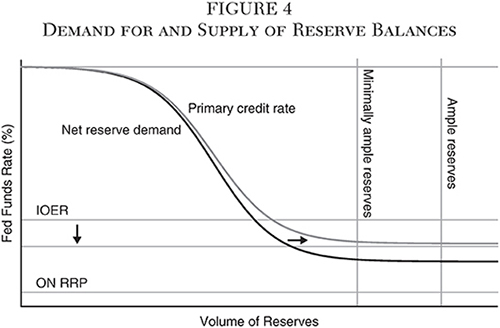
Banks’ aggregate demand for reserves increases as the cost of borrowing—or opportunity cost of lending—them in the funds market declines. The funds rate is capped, more or less, at the rarely used primary credit rate at which member banks can borrow reserves at the Fed’s discount window.
The market-clearing level of the funds rate is then determined by the amount of reserves in the banking system, represented by the vertical supply curve. With reserves ample, it intersects the demand curve in a relatively flat region. Moderate variations in supply will then have little to no impact on the funds rate. But if the supply of reserves is less ample than the Fed thinks, relatively small changes in demand can lead to large changes in the rate. Much therefore depends on accurate estimates of the demand function.
Supply of Reserves
During the period of slow runoff that began in late 2017 and ended with the recent spike in repo rates, the overall size of the Fed’s balance sheet declined by about $700 billion and a corresponding volume of federal debt was placed with private investors. But reserves can shrink not only because the Fed, as a matter of policy, reduces total assets. Reserves can also be displaced by the growth in other Fed liabilities and have declined by more than assets: $800 billion (Figure 5).14
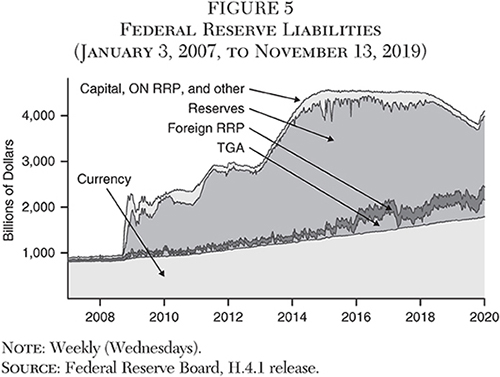
One major liability, the U.S. Treasury’s deposit or General Account (TGA), fluctuates widely as tax payments flow in and disbursements out. Both the volatility and typical size of the account have increased over the past decade, in part because the Treasury has moved cash balances from commercial banks to the Fed. The TGA is also used by the Treasury to cope with the recurrent debt-limit confrontations with Congress, by issuing T‑bills when the limit has been raised, depositing the proceeds, and then drawing down the account when political tensions resume.
The foreign reverse repo (RRP) account, an investment vehicle of long standing available to foreign central banks to deploy their U.S. dollar reserves, has also grown. The relative attractiveness of foreign RRPs has increased as the U.S. yield curve has flattened and repo rates have risen relative to other money market rates. The account has been growing since the crisis, and that growth has accelerated over the past year. The Fed can constrain the program but has instead in recent years removed limits.15
Currency in circulation, finally, grows steadily to keep pace with the long-term growth of the economy and rise in the price level. These three nonreserve absorbing factors have together displaced roughly $100 billion in reserves since the end of 2017, a material but not large amount relative to the shrinking of the Fed’s balance sheet. However, with a smaller balance sheet, the roughly $650 billion of balance sheet the TGA and foreign RRP occupy become more problematic if they constrain the Fed but serve no clear purpose related to monetary policy. Moreover, the wide variability of nonreserve liabilities, due especially to the TGA, causes proportionally larger variability in reserves as the Fed’s balance sheet shrinks.
Federal Debt and the Demand for Reserves
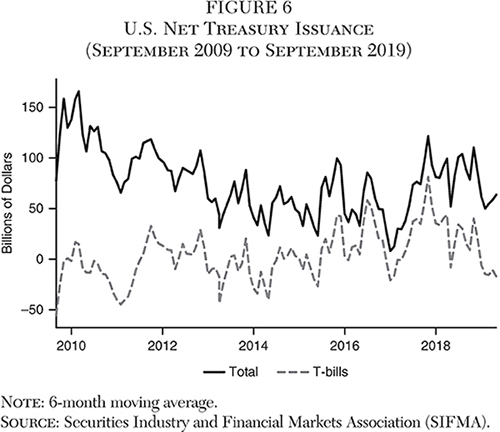
Another change has been the acceleration in Federal debt issuance and particularly of T‑bills, which puts upward pressure on money market rates generally and changes the relationships among different money market rates. Corporate tax payments in mid-September may have increased inflows to the TGA and led to reductions in repo lending by money funds as investors drew down holdings. High Treasury debt issuance, particularly T‑bills, at the same time the Fed was reducing its holdings, increased the demand for repo borrowing by dealers to finance inventories. These forces added to upward pressure on the repo rate (Pozsar 2018), but are not likely to have been dominant factors in the medium term, as the net issuance and tax payments were neither unprecedented nor even exceptionally large for the past decade (Figure 6).
Regulation and the Demand for Reserves
Countervailing regulatory forces are also altering the demand for reserves as well as for Treasury bills and other money market instruments. Ongoing regulatory and supervisory developments have generally been increasing reserve demand, that is, shifting the demand curve out and raising the lowest funds rate at which the market clears with ample reserves in the system. In addition, they shift demand away from money-market substitutes, including T‑bills and reverse repo, that is, lending in the repo market. There is still considerable uncertainty about postcrisis regulation, but as it continues to be defined and implemented, upward pressure on the funds rate relative to other money market rates will likely persist.
The leverage ratio requires larger banks to finance low-risk, low-return assets, including excess reserves and reverse repo lending, relatively heavily with equity capital, making them unattractive if the ratio is binding and money market rates are low relative to the required anticipated return on banks’ equity.16 It penalizes any effort by banks to borrow funds and lend in the repo market at elevated rates. On the other hand, banks can count reserves, other money market instruments, and high-quality collateral received in a reverse repo as part of the stock of liquid assets they must maintain to satisfy the liquidity coverage ratio (LCR).17
Resolution planning rules such as living will requirements, regulatory stress tests, and macroprudential rules—all less visible than the risk-weighted capital and leverage ratios and the LCR—also penalize repo market lending relative to reserves. These include the G‑SIB surcharge, an additional capital requirement imposed on large banks said to pose systemic risks. These pressures are closely related to reported pressure to avoid reliance, even in liquidity contingency planning, on Fed discount window borrowing. Such pressure goes well beyond mere “stigma” and softens the cap on the funds rate represented in Figure 4. Banks are similarly reluctant to borrow intraday from the Fed via daylight overdrafts.18
The Fed and FDIC guidance on bank resolution plan submissions states detailed requirements for resolution liquidity resources to be deemed adequate. It goes beyond the LCR in addressing the contingency that a bank fails and is resolved by the FDIC, requiring that liquidity reserves cover not only its typical end-of-day net cash outflows, but also its intraday funding needs. The requirement is similar to Tier 2 regulatory capital, which is intended to fund banks in resolution—as “gone concerns”—without recourse to public monies. The resolution guidance on liquidity is similarly intended to avoid the Fed being exposed in the event of abrupt failure to large banks’ daylight overdrafts vis-à-vis not only the Fed, but also other counterparties.19
Among the largest such intraday exposures are obligations between banks and central counterparties (CCPs), the platforms through which swaps and certain other derivatives contracts must be cleared under the Dodd-Frank Act. As derivatives prices change during the trading day, margin calls are made that must be settled by the close or the next day. Compliance with clearing mandates has concentrated these exposures, once diffused more widely among intermediaries, in larger banks, larger customers, and the CCPs. Another large intraday exposure is primary dealers’ funding of Treasury inventories during daylight hours.20 These problems are reminiscent of the Fed’s efforts over the years to reduce the intraday exposure of repo clearing banks to their broker-dealer customers.21
The increased reliance on CCPs also directly affects the repo market by encouraging an increase in participation. The Fixed Income Clearing Corporation (FICC) is a CCP serving the repo market. By increasing the scope for netting of transactions through its members, clearing through FICC reduces the regulatory balance sheet impact of repo intermediation and the cost of accommodating participation by smaller dealers (Copeland, Selig, and Tarascina 2019).
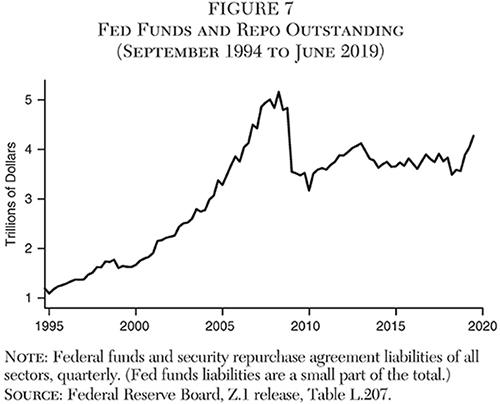
While the repo market shrank dramatically during the crisis and remains much smaller than it was, it has grown rapidly more recently (Figure 7). The combination of a rising volume of transactions and the hesitancy of large banks to respond to surges in demand for repo cash borrowing by reducing reserves increases the likelihood of supply-demand imbalances in the inner market of large banks and dealers (Committee on the Global Financial System 2017).
Changes to the rules governing money market mutual funds (MMMFs) also affect the relative demands for different money market instruments. The stable net asset value privilege granted by the federal government to MMMFs now applies exclusively to those investing in or collateralized by government liabilities. By constraining MMMFs to invest in T‑bills and Treasury repo rather than commercial paper and other private-sector debt, the MMMF rules may offset some of the impact of other regulations and supervision.
Oddly, in the new regulatory environment, reserves have become a more attractive liquid asset for banks relative to Treasuries, especially T‑bills. On the one hand, T‑bills can be owned by anyone, not just banks, enjoy a much more liquid secondary market, and are among the most easily pledged assets for borrowing cash in the repo market. Reserves, however, can be used instantaneously for payments by banks, particularly intraday settlement. T‑bills would have to be sold or used as collateral in a repo to raise cash, taking at least some time and potentially more difficult in a crisis. This real but, in normal times, minor difference in serviceability as a means of intraday settlement is reported to have been strongly emphasized, and larger banks have been urged toward reserve balances in on-site supervisory reviews.22 Large U.S. banks have in recent years become the largest holders of reserves, alongside FBOs not subject to FDIC fees.
A shift away from bills may be discernable in market pricing. It is difficult to compare T‑bill rates with overnight rates due to the difference in term to maturity, which, particularly at the very short end, can be affected not only by interest rate expectations and price risk premiums, but also by variations in liquidity premiums on close substitutes for cash. That said, T‑bill rates were substantially lower than the funds and IOER rates prior to the 2018 “honeymoon period” of the current operating system and have largely converged since (Figure 8).

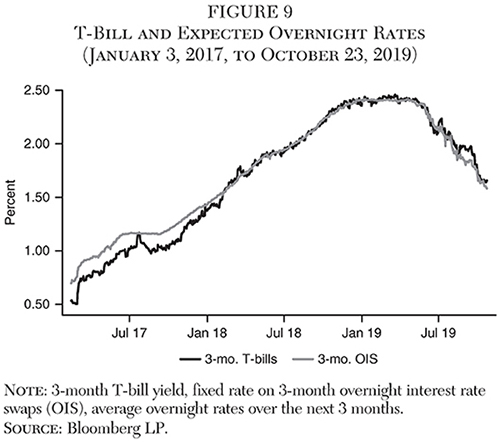
T‑bill rates were also lower than fixed rates on overnight interest swaps (OIS) of the same tenor in 2017 and largely converged during 2018 (Figure 9). Traders can take a view about or hedge against changes in the average future overnight rate via OIS, in which one counterparty pays another the difference between an expected and the actually realized average of overnight rates during its tenor. A negative spread between the two rates is an indicator that market participants were prepared to give up some yield in order to hold T‑bills. T‑bill rates have recently moved higher than OIS, another indicator that T‑bill demand has shifted lower.
Changes in Money Market Expectations
As these shifts in supply and demand have been playing out, expectations about where rates are heading, both those of the public and of the Fed, have fluctuated widely and generally been far apart from one another. Market expectations about overnight rates several years in the future are expressed in the OIS market. Since 2012, the Fed has been polling FOMC participants about their projections of the appropriate longer-term target rate.
Market and Fed views initially diverged radically from one another (Figure 10). In 2012, the median Fed expectation was over 4¼ percent, while that of the market was a mere ½ percent. The Fed’s estimates have fallen steadily, to 2.5 percent in September 2019, while those of the market had until recently been rising, so the gap nearly disappeared toward the end of 2018. The market briefly appeared to have accepted and incorporated into its planning and pricing the Fed’s stated view.
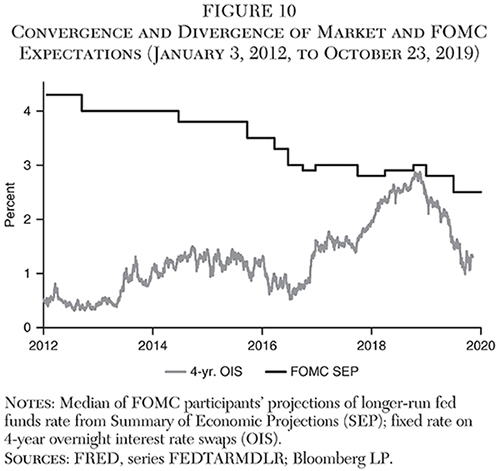
But market rate expectations turned sharply at the end of 2018, again opening a gap with those of the Fed of over 100 basis points. The re-emergence of the gap in 2019 is also an aspect of yield curve inversion, particularly at the front end. Monetary policy works smoothly only when policymaker and market expectations are in rough agreement, so the reappearance of this divergence represents a stability risk. It also reflects greater market uncertainty regarding future policy, which goes hand in hand with the higher implied and realized volatility seen since mid-2019.23
Going Forward
Considering the doubts that had prevailed before the first hike at the end of 2016 about whether the Fed could raise rates at all given the size of its balance sheet and the sogginess of the funds market, the Fed had been surprisingly successful until recently in doing so without generating more than transitory turmoil in markets. But the Fed may have been overconfident that it can navigate subsequent steps as smoothly. The shift in money markets from being awash in liquidity to tight and the abrupt tightening in repo markets came as surprises and others may be looming.
The operating framework established in response to the crisis has not been robust to changes in the environment that shift reserve supply and demand and affect market functioning, and has had to be adapted, ad hoc and reactively, many times. It has never operated as planned, though it appeared to for a time, with the funds rate generally near its desired level and with narrow spreads to other short-term rates. But the tightening of the money market and relative demand and supply shifts have required a rapid sequence of adjustments in 2018 and 2019, culminating in the reversal on balance-sheet runoff, and the dislocation in the repo market. The framework’s viability going forward will depend on factors that are hard to assess: reserve demand, and the extent to which the current regulatory environment is impairing money-market arbitrage.
The Fed has responded to the recent repo market stress primarily through temporary open market operations and a plan to buy T‑bills in permanent operations. In essence, it will add a large volume of reserve liabilities to its balance sheet and a corresponding volume of Treasury securities, primarily bills, to its assets. The efficacy of the approach will depend therefore on whether increasing the volume of reserves will sufficiently satiate demand, offset banks’ growing regulatory demand, and return the system to the flat part of the reserve demand curve, and on whether lowering the stock of T‑bills remaining in the market will induce substitution effects on the pricing of other money market assets. The potential difficulties arise from the difficulty of estimating banks’ reserve demand function and from market impairment that prevents smooth money market integration and boosts reserve demand.
Demand for Reserves
If the banking system is deep in the flat portion of the reserve demand curve, then upward pressure on the funds rate is limited. If it is closer to the point at which a small reduction in the supply of reserves leads the markets to clear at a significantly higher funds rate, then sharper increases in the rate are possible. The Fed doesn’t wish to hold any more assets than just necessary to satiate reserve demand, allowing for some buffer. It wants, in other words, the funds market to clear within a very narrow flat range on a demand curve that is difficult to estimate. The repo rate spike was surprising because the Fed had made diligent efforts to estimate this range based on data such as surveys of bank liquidity managers’ desired reserve balances and on the empirical relationship between system reserve balances and the funds rate.24
Moreover, the volume of reserves—the position of the vertical supply curve—is easy to measure at a point in time, but subject to unpredictable short-term variation in response to fluctuations in other Fed liabilities such as the foreign RRP and Treasury accounts. The Fed had from time to time indicated with excessive confidence that it had reliably estimated demand and that its framework was working smoothly, cautioning against interpreting market developments earlier in 2019 as evidence that reserves are not only in greater demand but close to being scarce. But the Fed erred in the location of its sweet spot on the reserve demand curve and thereby underestimated the potential for a continued rise in reserves demand to pressure the funds rate higher.25
The ample-reserves approach is said to obviate the need for the precrisis daily estimation of net reserve needs, but there is a paradox in considering that a virtue when maintaining minimally ample reserves requires just such estimates. Recent statements by the Fed have been more agnostic, acknowledging, for example, that it must “continue to learn about demand for reserves and other Federal Reserve liabilities” (Williams 2019).
The Fed’s rationale for retaining a larger balance sheet than necessary to accommodate natural currency demand growth has never been entirely clear. The desire to conduct monetary policy in an ample-reserves regime has been put forward as the primary motivation but may instead be a second-best solution. It is possible that the Fed is more concerned to avoid the risk of an abrupt rise in longer-term rates resulting from a more rapid reduction in the balance sheet. The Fed has been keen to avoid a recession in the current low-rate environment. The wealth and investment hurdle rate benefits of a low long rate were the original rationale for the LSAPs, and their erosion would add to concerns about confronting the effective lower bound in a downturn.26
Market Impairment
Arbitrage always has its limits (Shleifer and Vishny 1997), especially during financial market stress, as seen in 2008 when the funds rate sank below IOER without drawing banks into the arbitrage trade in sufficient volume to eliminate the gap. The arbitrage back then was limited by the costs of deposit insurance fees and differential regulatory treatment of domestic and foreign banks.
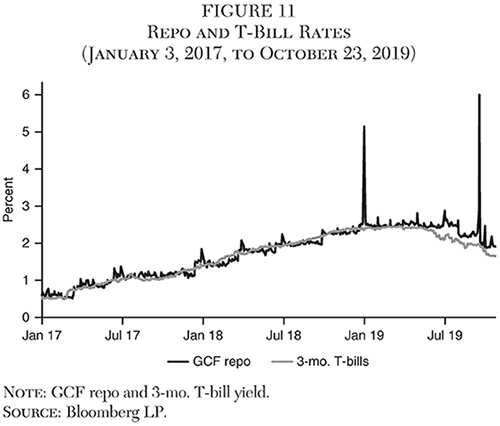
Banks may sacrifice a few basis points of net cash flow to meet the regulatory pressures to hold reserves, permitting a positive spread of the funds rates over IOER. This would not be an arbitrage violation, but rather reflect the additional value of reserves in satisfying that regulatory pressure. That value, and hence the arbitrage-free spread of the funds rate over IOER, is difficult to estimate. Similarly, a decline in T‑bill rates stemming from Fed operations may not be fully transmitted to the repo markets if the arbitrage remains incomplete. A widening spread between repo and T‑bill rates may indicate this is the case, while bearing in mind the occasional inversion of the yield curve (Figure 11).
But money market arbitrage has been further impaired since the crisis by revisions in financial regulation and is just one example of the poorer market functioning they have induced since the crisis. Market liquidity has declined, and across financial markets one witnesses the persistence over years of near-riskless arbitrage opportunities (Malz 2018). The regulatory revisions are largely motivated by the survival of the “too-big-to-fail” policy that grants large leveraged banks a debt funding advantage implicitly subsidized by the public and are a study in unintended consequences. For example, low risk activities such as repo market making and clearing have become costlier, while investment in higher-risk assets such as leveraged loans has flourished and must be discouraged informally and through supervisory guidance. The Fed has expressed some openness to changes in supervisory stance but less in the regulations themselves.27
Further Adjustments to the Operating Framework
Apart from frequent changes, the operating framework has grown ever more complex. It involves numerous administered rates set by Fed decision rather than market clearing: the IOER and ON RRP rates, the upper and lower target range limits, and, lurking in the background but currently less relevant, the primary credit rate. There is but one market-adjusted target, the funds rate, but at least one other rate, on overnight repo, that is central to setting money market rates overall. To further complicate matters, as part of its overall review of monetary policy strategy, the Fed is contemplating replacing the effective funds rate as the target by the Overnight Bank Funding Rate (OBFR) index of interbank rates or the Secured Overnight Financing Rate (SOFR) index of repo rates. Both have drawbacks: the former, like the funds rate, suffers from low trading volumes, while the latter sporadically displays high volatility, as in the recent episode.
What would happen if the repo rate remains volatile, or the funds rate appeared to be more systematically evading its current controls? The projected Treasury bill purchases may prove to be another ad hoc response or a first step in a new program to address the longer-term reserve supply. T‑bill purchases will reinvigorate concerns about the Fed accommodating rising federal government deficits and a large Fed balance sheet.28 Some market participants have also raised concerns that substantially increasing the Fed’s balance sheet, particularly with the addition of T‑bills, could increase upward pressure on the repo rate by withdrawing high-quality collateral and at least partly offset any accommodative impact via reserve supply.
But the fact that reserve scarcity prevailed with $1.39 trillion of reserves on banks’ balance sheets, the level reported in the midst of the repo shock on September 18, while the precrisis funds market functioned well with a total of $6 billion, suggests the volume of reserves is not the fundamental problem (Williamson 2019b). Moreover, the tentatively planned increase is to a level not far from that recent low. Reserves might reach a revised, higher Fed estimate of ample supply, but sporadic liquidity impasses continue to dog the repo market because of declining integration and substitutability between reserves and repo lending.
Other proposals are more drastic. Reforming and placing limits on the TGA and foreign RRP liabilities, which contribute little to the Fed’s objectives, would reduce a source of volatility in reserve volume (Andolfatto and Ihrig 2019; Selgin 2019a), but would not address either the potential for reserve shortages, given a $4 trillion balance sheet, or the impaired functioning of the money markets. New mechanisms to govern the funds rate include reducing the width of the target range, and, most prominently, a standing repo facility to enforce an upper limit, mirroring the use of ON RRP to enforce a floor. The operations would be temporary, in contrast to the announced T‑bill purchases.
Apart from their impact on the size of the Fed’s balance sheet, the impact is uncertain in a rapidly changing environment in which few phenomena have much historical precedent. A standing repo facility could ease upward pressure on both the funds and repo rates, even if not heavily drawn upon, if its mere availability induces greater substitutability between reserves and Treasuries and thus greater readiness to participate in repo-funds arbitrage. A standing repo rate would be an additional administered rate, even if set to coincide with the target range’s upper limit.
These changes would be the latest to the yet-to-be-finalized current approach but could represent much more than a mere tweak. Narrowing the target range and flanking it with standing facilities to add or drain funds would be a new framework more akin to a corridor.29 Some FOMC members have expressed openness to the idea, but the Fed’s rejection of active management of reserves and reliance on administered rates would be at odds with sporadic but possibly frequent operations at target-range limits. But the Fed’s focus remains its determination to keep reserves plentiful enough to avoid further turmoil in the repo markets.30
Conclusion
There are two fundamental reasons behind the operational problems the Fed is experiencing, working in tandem: the basic approach to systemic risk adopted both internationally and, with enthusiasm, in the United States, and the Fed’s large balance sheet, which it can unwind only at the risk of a large increase in interest rates and recession, and which has imposed the need for a complex and ever-evolving operating framework for monetary policy. Even if the intention were there, extricating the United States from these dilemmas would take years of gradual effort.
Rather than obliging banks to fund their assets with enough equity capital to enable them to fund via debt without public-sector guarantees, the regulatory and supervisory system attempts to address each vulnerability of the financial system caused by excessive leverage. This impossible attempt to reshape every specific feature of the financial system that can arguably be held responsible for the crisis through comprehensive and detailed rules ultimately serves political ends and has predictably resulted in myriad unanticipated consequences. The new regulations have contributed to the disarray in money markets by forcing the banks to hold much larger reserve balances and by leading to the impairment of money market functioning and integration.
In spite of the high cost of the regulatory changes introduced since the crisis, of which the recent money market turmoil is an example, the fundamental problem they are intended to address—large, heavily leveraged intermediaries posing a financial stability threat but reliant on public-sector guarantees to woo debt investors—persists. Higher regulatory capital requirements would be a more efficient approach that would achieve the same goals, more reliably, at lower cost across the economy. They could be used as a transitional step to market-adjusted funding of banks, giving banks an incentive to reduce leverage where it counts, and to be more transparent about their asset risks, and giving the public sector the opportunity for gradual withdrawal of guarantees.
While Fed officials have expressed sanguine confidence in its ability to control rates in the past, nearly everything about the future operating framework is still open, including the most fundamental questions: the size of its balance sheet, and whether rate setting will rely on regular market operations or administered rates. Resolution appears further away than ever. Mechanically, even on its own terms, the current approach has functioned as planned only for limited periods of time. It has been less an enduring framework than a sequence of transitory adaptations to changing circumstances, to which the recent repo stress has now been added. In the interim, uncertainty about the future framework and the size of the Fed’s balance sheet raise the probability of surprising fluctuations in the funds as well as other money market rates.
References
Andolfatto, D., and Ihrig, J. (2019) “Why the Fed Should Create a Standing Repo Facility.” Federal Reserve Bank of St. Louis, On the Economy Blog (March 6).
Andros, J.; Beall, M.; Martinez, F.; Rodrigues, T.; Styczynski, M.-F.; and Thorp, A. (2019) “Approaches to Estimating Aggregate Demand for Reserve Balances,” Board of Governors of the Federal Reserve System, FEDS Notes (October 17).
Bindseil, U. (2016) “Evaluating Monetary Policy Operational Frameworks.” In Designing Resilient Monetary Policy Frameworks for the Future, 179–277. Federal Reserve Bank of Kansas City.
Bush, R.; Kirk, A.; Martin, A.; Weed, P.; and Zobel, P. (2019) “Stressed Outflows and the Supply of Central Bank Reserves.” Federal Reserve Bank of New York, Liberty Street Economics (February 20).
Committee on the Global Financial System (2017) “Repo Market Functioning.” Bank for International Settlements, CGFS Papers, No. 59 (April).
Copeland, A.; Selig, I.; and Tarascina, A. (2019) “Are New Repo Participants Gaining Ground?” Federal Reserve Bank of New York, Liberty Street Economics (April 3).
Covas, F., and Nelson, B. (2019) “Bank Regulations and Turmoil in Repo Markets.” Bank Policy Institute, Underwritings (September 26).
Duffie, D., and Krishnamurthy, A. (2016) “Pass-Through Efficiency in the Fed’s New Monetary Policy Setting.” In Designing Resilient Monetary Policy Frameworks for the Future, 21–101. Federal Reserve Bank of Kansas City.
Faruqui, U.; Huang, W.; and Takáts, E. (2018) “Clearing Risks in OTC Derivatives Markets: The CCP-Bank Nexus.” BIS Quarterly Review (December): 73–90.
Foerster, A.; and Leduc, S. (2019) “Why Is the Fed’s Balance Sheet Still So Big?” Federal Reserve Bank of San Francisco, Economic Letter 2019–16.
Ihrig, J. (2019) “Banks’ Demand for Reserves in the Face of Liquidity Regulations.” On the Economy Blog (March 5).
Ihrig, J. E.; Kim, E.; Vojtech, C. M.; and Weinbach, G. C. (2019) “How Have Banks Been Managing the Composition of High-Quality Liquid Assets?” Federal Reserve Bank of St. Louis Review, 101(3): 177–202.
Ihrig, J. E.; Meade, E. E.; and Weinbach, G. C. (2015). “Rewriting Monetary Policy 101: What’s the Fed’s Preferred Post-Crisis Approach to Raising Interest Rates?” Journal of Economic Perspectives 29 (4): 177–98.
Keating, T. F.-F.; Martinez, F.; Pettit, L.; Rezende, M.; Styczynski, M.-F.; and Thorp, A. (2019) “Estimating System Demand for Reserve Balances Using the 2018 Senior Financial Officer Survey.” Board of Governors of the Federal Reserve System, FEDS Notes (April 9).
Logan, L. K. (2019a) “Normalizing the Federal Reserve’s Balance Sheet and Policy Implementation.” In J. H. Cochrane, J. B. Taylor, and K. Palermo (eds.), Currencies, Capital, and Central Bank Balances, 197–211. Stanford, Calif.: Hoover Institution.
_________ (2019b) “Observations on Implementing Monetary Policy in an Ample-Reserves Regime.” Remarks before the Money Marketeers of New York University (April 17). Available at www.newyorkfed.org/newsevents/speeches/2019/log190417.
Malz, A. M. (2018) “Liquidity Risk after the Crisis.” Cato Journal 38 (1): 35–64.
_________ (2019) “Macroprudential Policy, Leverage, and Bailouts.” Cato Journal 39 (3): 499–528.
Munyan, B. (2015) “Regulatory Arbitrage in Repo Markets.” Office of Financial Research, Working Paper No. 15–22
Nelson, W. (2019a) “Get Up Off the Floor.” In J. H. Cochrane; J. B. Taylor; and K. Palermo (eds.), Currencies, Capital, and Central Bank Balances, 213–20. Stanford, Calif.: Hoover Institution.
_________ (2019b) “Two Little-Noticed and Self-Inflicted Causes of the Fed’s Current Monetary Policy Implementation Predicament.” Bank Policy Institute, Underwritings (October 1).
Plosser, C. I. (2018) “The Risks of a Fed Balance Sheet Unconstrained by Monetary Policy.” In M. D. Bordo, J. H. Cochrane, and A. Seru (eds.), The Structural Foundations of Monetary Policy, 1–16. Stanford, Calif.: Hoover Institution.
Potter, S. (2018a) “Confidence in the Implementation of U.S. Monetary Policy.” Remarks at the 23rd EMEAP Governors’ Meeting, Manila (August 4). Available at www.newyorkfed.org/newsevents/speeches/2018/pot180803.
_________ (2018b) “U.S. Monetary Policy Normalization Is Proceeding Smoothly.” Remarks at the China Finance 40 Forum–Euro 50 Group–CIGI Roundtable, Banque de France (October 26). Available at www.newyorkfed.org/newsevents/speeches/2018/pot181026.
Pozsar, Z. (2018) “Monetary Policy with Excess Collateral.” Credit Suisse, Global Money Notes No. 15 (August 13).
_________ (2019a) “Collateral Supply and o/n Rates.” Credit Suisse, Global Money Notes No. 22 (May 31).
_________ (2019b) “Sagittarius A*.” Credit Suisse, Global Money Notes No. 24 (August 21).
Selgin, G. (2018) FLOORED! How a Misguided Fed Experiment Deepened and Prolonged the Great Recession. Washington: Cato Institute.
_________ (2019a) “Reflections on the Repo-Market Imbroglio.” Cato Institute, Alt‑M (October 3).
_________ (2019b) “Stop the Presses! or, How the Fed Can Avoid Reserve Shortages without Bulking-Up, Part 1.” Cato Institute, Alt‑M (November 12).
Shleifer, A., and Vishny, R. W. (1997) “The Limits of Arbitrage.” Journal of Finance 52 (1): 737–83.
Smith, A. L. (2019) “Do Changes in Reserve Balances Still Influence the Federal Funds Rate?” Economic Review 104 (1): 5–34.
Williams, J. C. (2019) “Money Markets and the Federal Funds Rate: The Path Forward.” Remarks at the MFA Outlook 2019 (October 17). Available at www.newyorkfed.org/newsevents/speeches/2019/wil191017.
Williamson, S. D. (2019a) “The Fed’s Operating Framework: How Does It Work and How Will It Change?” Cato Journal 39 (2): 303–16.
_________ (2019b) “The Fed’s Failed Experiment.” New Monetarist Economics (September 26).
_________ (2019c) “An Attempt to Sort out the Fed’s Overnight Market Issues.” New Monetarist Economics (October 27).
1 Ihrig, Meade, and Weinbach (2015) is a clear and succinct overview of the pre- and postcrisis framework and its rationale, written around the time of the attempted transition to policy normalization.
2 See Duffie and Krishnamurthy (2016) on the importance and extent of money-market integration following the crisis.
3 The European Central Bank had raised rates as recently as mid-2008 following a rapid run-up in commodity prices.
4 A time series of fed funds lending volumes by lender is available at www.newyorkfed.org/fed-funds-lending/index.html.
5 See the discussion of liquidity regulation below.
6 The system has been termed “a floor and a subfloor” to distinguish it from a corridor system. Bindseil (2016: 209f.) refers to it as “a corridor of two same-sided standing facility rates,” here liquidity-absorbing facilities. See Selgin (2018) on the evolution of the Fed’s approach during the crisis.
7 As of mid-2019, repo borrowing represented 51.1 percent of U.S. dealers’ $3.49 trillion in liabilities, and repo lending 35.3 percent of money market funds’ $3.21 trillion in assets (see the Fed’s Financial Accounts of the United States at www.federalreserve.gov/releases/z1/current/default.htm, Tables L. 121 and L. 130).
8 The first reduction in IOER relative to the upper range followed the June 2018 meeting. It was lowered again at the September 2018, April/May 2019, and September 2019 meetings.
9 Williamson (2019c) notes that “if we judge the performance of an interest-rate-targeting regime by success in pegging all overnight rates to the FOMC’s target, then this floor system worked well for only a few months in late 2018.” However, the generally positive spread of the repo over the funds rate was anomalous even then.
10 An unusually large spike of over 250 basis points, but isolated and smaller than the recent ones, occurred on the last day of 2018, in a premonition of the September 2019 shocks.
11 The New York Fed conducted an average of $60.7 billion in overnight Treasury repo in daily operations between September 17 and November 5, 2019, in addition to smaller volumes of term repo, generally 2 weeks, and repo using MBS collateral. The average was $6.0 billion between September 20, 2001, and August 9, 2007.
12 The decisions were finalized at the end-October FOMC meeting. See the implementation note at www.federalreserve.gov/monetarypolicy/fomccalendars.htm and the New York Fed statement at www.newyorkfed.org/markets/opolicy/operating_policy_191011. For comparison, in the final phase of quantitative easing in 2013, the Fed was buying $85 billion of Treasury notes and agency MBS per month, not that much larger, though consisting of long- rather than short-term securities.
13 In its “Statement Regarding Monetary Policy Implementation and Balance Sheet Normalization,” at www.federalreserve.gov/newsevents/pressreleases/monetary20190130c.htm.
14 These are the so-called autonomous or “absorbing factors, other than reserve balances” in the Fed’s weekly H.4.1 balance-sheet report. Reserves declined $796.4 billion between October 18, 2017, and September 11, 2019, while total assets fell $698.8 billion. Even more tellingly, during the prior three years, between January 7, 2015, and October 18, 2017, reserves declined $455.2 billion, but total assets by only $26.6 billion.
15 See Selgin (2019b), Nelson (2019b), Pozsar (2019b), and Williamson (2019a, 2019b) on the roles of the TGA and foreign RRP programs in absorbing Fed balance sheet since the crisis.
16 The leverage ratio becomes the binding regulatory capital constraint if it is calculated to be higher than the minimum capital ratio using risk-weighted assets. The U.S. leverage ratio rules were introduced with compliance deadlines in 2018.
17 The eligible assets are called high-quality liquid assets (HQLA). The U.S. LCR was introduced with compliance deadlines in 2017.
18 See Covas and Nelson (2019). Malz (2019) provides a critical survey of macroprudential policy.
19 See the 2019 guidance at www.govinfo.gov/content/pkg/FR-2019–02-04/pdf/2019–00800.pdf, pp. 1450f., describing Resolution Liquidity Adequacy and Positioning (RLAP).
20 Faruqui, Huang, and Takáts (2018) and Pozsar (2019a) discuss the primary dealer impact on intraday liquidity. These strains on liquidity might be mitigated by speedier settlement in derivatives and repo markets.
21 The efforts slowed after 2015. Since then, one of the two major triparty repo clearing banks, JP Morgan, has left the business, as well as other clearing services, leaving only Bank of New York. Its exit was likely motivated by higher regulatory capital requirements.
22 See Bush et al. (2019), Ihrig et al. (2019), Ihrig (2019), and Covas and Nelson (2019) on the impact of liquidity regulations and supervision on the demand for and holdings of reserves.
23 Implied volatilities of swaptions and other fixed-income options had been declining steadily until late 2018 and have been rising steadily since.
24 The “Balance Sheet Normalization Principles and Plans” statement (www.federalreserve.gov/newsevents/pressreleases/monetary20190320c.htm) calls for “a level consistent with efficient and effective implementation of monetary policy,” that is, “no more securities than necessary for efficient and effective policy implementation.” This is referred to as the minimally ample or, from the point of view of the banks holding reserves, the lowest comfortable level of reserves (LCLoR). See also Keating et al. (2019), Andros et al. (2019), Smith (2019), and Logan (2019b).
25 “It seems highly likely that we are … on the ‘flat’ part of the curve” (Potter 2018a and 2018b). In contrast, Logan (2019a: 205) lays out the difficulty of estimating the supply and demand for reserves given the variability of the nonreserve factors and the impact of changes in regulation on demand.
26 See, for example, Foerster and Leduc (2019). The realized losses attendant on a rise in rates may be a secondary concern.
27 For example, by Powell in the post-FOMC press conference of October (www.federalreserve.gov/mediacenter/files/FOMCpresconf20191030.pdf).
28 These concerns include foreclosing a return to the precrisis operating framework for monetary policy, and the risk of opening the door to a readily politicized “credit policy” of guiding resources to specific sectors rather than an independent monetary policy oriented to the economy as a whole (Plosser 2018 and Nelson 2019a).
29 Selgin (2019a) suggests that IOER itself might serve as the lower bound, becoming an authentic floor.
30 See www.federalreserve.gov/monetarypolicy/files/fomcminutes20190918.pdf.

This work is licensed under a Creative Commons Attribution-NonCommercial-ShareAlike 4.0 International License.