For various reasons, economists have become interested in investigating the causes and effects of war and other armed conflict (e.g., Coyne and Mathers 2011).
This article uses a consistent measurement of these forms of violence across space and time to conduct a rigorous quantitative analysis of the effect of war on economic growth.
Recent History of War
As shown in Figure 1, from the end of World War II to the early 1990s, there was an upward trend of armed conflict in the world. Many of these armed conflicts were wars of independence, some tinged by the struggle between communism and democracy that characterized the Cold War period. Examples of such wars include the French-Indochina War of 1946 to 1954 and the U.N.-North Korea War of 1950 to 1953.
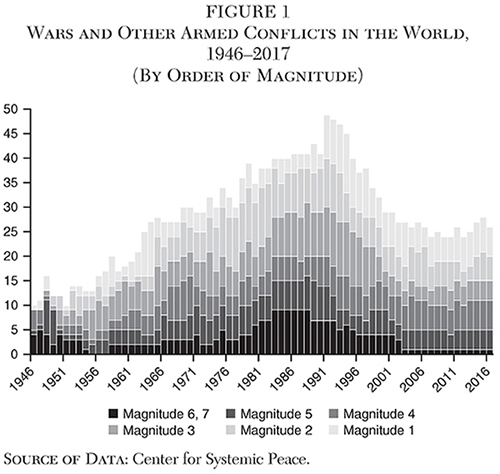
Other such wars during the Cold War period include the Soviet invasions of Hungary in 1956 and of Czechoslovakia in 1968, the Romanian Revolution of 1989, and wars and other armed conflicts following dissolutions of the U.S.S.R. and of Yugoslavia. In Asia, the Chinese invasion of Tibet of 1950, the Cultural Revolution from 1966 to 1976, and communist insurgencies in various countries of southeast Asia marked the Cold War period.
In Africa, independence was achieved by many countries only following war or some other violent resistance to continued colonial rule. In Angola, the war of independence lasted from 1961 to 1974. This and similar wars in Mozambique and Guinea-Bissau were ended only following a military coup in Portugal. Subsequently, a civil war commenced in Angola that lasted until 2002, with the factions engaged in this civil war supported by outside countries from either the eastern or the western bloc. In Algeria, a war of independence lasted from 1954 to 1962. This war ended the vision of France for transforming its once vast colonial empire into so many overseas departments.1 Other conflicts during the Cold War period included the suppression of dissidents by various non-democratic regimes and ethnic-based conflicts.
Following the dissolution of the Soviet Union, the number of on-going wars fell. From a peak of 49, the number dipped to 24. Since then, the number of ongoing wars has fluctuated in the high 20s. In addition, the dominant kinds of wars shifted to conflicts related to ethnic and religious differences. Among these are civil wars, insurgencies, and other violence involving radical Islamic terrorism. During the past several years, the more significant conflicts have involved Afghanistan, Colombia, the Democratic Republic of Congo, Iraq, Mexico, Myanmar, Nigeria, Pakistan, Somalia, Sudan, Syria, and Yemen.
Quantifying War
Until recently, wars were treated as episodic events. But, with the development of data sets detailing the dates, belligerents, and possibly also the magnitudes of war and other armed conflicts, the causes and consequences of war were made amenable to quantitative analysis (e.g., Auvinen 1997, Ellingsen and Gleditsch 1997, Hegre et al. 2001, Zanger 2000).
One of the first such data sets is “Correlates of War” (Small and Singer 1982). With this data set, wars are treated as dichotomous, the defining criterion being at least 1,000 battle deaths over a 12-month period. This data set has been periodically updated. Its fourth edition covers the period 1816 to 2010 (Sarkees and Wayman 2010).
A second data set — compiled by the Uppsala Conflict Data Program (UCDP) and Peace Research Institute Oslo (PRIO) — lowered the threshold defining war to 25 battle deaths over the course of a year. This data set initially tracked wars in real time starting in 1989. Later, it was retrospectively backdated to 1946 (Gleditsch et al. 2002). This data set has likewise been periodically updated (e.g., Harbom, Melander and Wallensteen 2008).
Both of these data sets treat war as a dichotomous event, the first with a relatively high threshold and the second with a relatively low one. These thresholds can have very different meanings for countries depending on their size. In addition, advances in the medical treatment of wounded soldiers has significantly lowered the ratio of battle deaths to wounded for more advanced armies. Defining war as a dichotomous event according to the number of battle deaths should be considered problematic.
A data set that includes a judgment as to the magnitude of a war has been developed by the Center for Systemic Peace (Marshall and Elzinga-Marshall 2017), covering the period 1946 to 2017. Magnitude 6 and 7 wars roughly correspond to the wars included in the Correlates of War data set, and the lesser, Magnitude 1 to 5 wars and other armed conflicts roughly correspond to the other wars included in UCDP-PRIO data set. Among the Magnitude 7 wars is the U.S.-Vietnam War of 1964–73 (from the standpoint of Vietnam), and among the lesser wars and other armed conflicts are the sectarian conflict in Northern Ireland of 1969–94 and the insurgency in Honduras of 1981–86. These data are displayed in Figure 1, with the order of magnitude arrayed from greatest (Magnitude 6 and 7) to least (Magnitude 1).
From the same source, a data set on coups and other forms of political instability is available. In addition to changes in government brought about by coups, changes caused by assassination, ouster by foreign forces, victory by rebel forces, and forced resignation are included. In this article, “coup” includes all of these.
To briefly comment on the other data sets used in this article, GDP per capita is taken from the Maddison project (Bolt et al. 2018). These data are real GDP per capita based on a common international price survey. Accordingly, these data are related across countries on the basis of purchasing power rather than on the basis of exchange rates. The Maddison project continues the work of Angus Maddison (1995, 2001, 2006).
The Economic Freedom Index is from the Fraser Institute (Gwartney, Lawson, and Hall 2017). The original data set covered the period 1975 to 1995 in five-year increments (Gwartney, Lawson, and Block 1996), and has since then been updated annually in real time. The index has recently been backdated to 1950, in five-year increments, by Murphy and Lawson (2018). The five-year increments of the original and retrospective portions of this data set dictate the periodicity of this study. The index of economic freedom ranges from 1 to 10, where 1 represents no economic freedom and 10 maximum economic freedom. It is a composite of many underlying measures of government involvement in the economy.
The index of political freedom is from Freedom House and is based on 7‑point scales for both civil liberty and political freedom, where (1,1) is most free and (7,7) least free. The index is calculated as 100*(14 2 the sum of the two scales)/12.
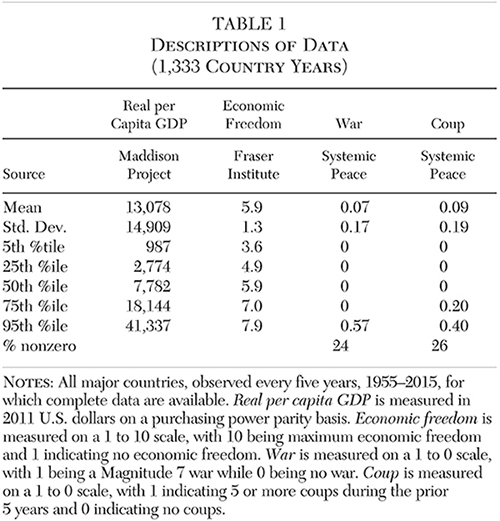
Table 1 presents some summary statistics for GDP per capita, economic freedom, war, and coup. Notice that wars and coups are not rare. Regarding war, 24 percent of the country-year observations have a nonzero value. A nonzero value indicates that a country had at least one war or other armed conflict during the prior five years. Regarding coups, the comparable number is 26 percent. The percent of observations having a nonzero entry for either war or coup is 40. These large percentages impel consideration of war and coup in cross-national studies.
War and GDP per Capita
While wars are destructive of physical and human capital, the impact of war on GDP per capita is unclear. This ambiguity is fundamentally due to the way national income accounting deals with killing people and destroying things during war. Producing weapons and munitions is counted positively, while killing people and destroying things is not counted at all.
On the one hand, war can increase GDP per capita by reducing unemployment and by shifting people from family formation and other nonmarket activities into wartime production.2 On the other hand, even with the failure to account for the destruction of physical and human capital or the loss of nonmarket activity, war can lower GDP per capita by reducing labor and total factor productivity through the destruction of existing physical and human capital and by reducing investment in new physical and human capital. War can also reduce GDP per capita by reducing gains from both domestic and foreign trade.
Conceptually, the total cost of war includes three parts: (1) the opportunity cost of the resources used to prosecute war, (2) the loss of lives and destruction of physical and human capital during the war, and (3) the reduction of GDP per capita as measured during and following the war. The focus of this study is on the third part.
In fact, empirical findings of the impact of war on GDP have been inconsistent. Barro (1991) finds that coups and assassinations degrade the growth rate of GDP per capita. Barro and Lee (1993), among others, confirm the finding regarding political instability, but find that war has an insignificant impact on growth. Jong-A-Pin (2009), in a review of the literature, found that political instability affects growth but war does not. Even so, Murdoch and Sandler (2004) find that civil wars negatively impact the growth rate of GDP per capita.
A second line of inquiry suggests that war impacts the economy negatively. This line of inquiry examines the reaction of financial markets to war events and began with studies of the impacts of U.S. Civil War events on currency values (Weidenmier 2002; Willard, Guinnane, and Rosen 1996). This method has been used to investigate the impact of war on an expanding list of financial instruments over the course of an increasingly diverse set of wars (e.g., Burdekin 2006, Ferguson 2006, Frey and Waldenstrom 2004, Pecquet and Thies 2010, Weidenmier and Oosterlinck 2007). Unfortunately, the impacts of war events on currency and debt values are convoluted by the possibilities of inflation and repudiation. The impacts of war events on stock market indexes seem more clearly due to the impact of war on real economic activity. Schneider and Troeger (2006) find such impacts in their study of stock market indexes during three recent wars. The availability of a measure of the magnitude of wars enables more precise analysis.
Econometric Analysis
Table 2 reports the results of regression analysis of (the natural logarithm of) per capita GDP for all the major countries of the world, observed every five years from 1955 to 2015, where all data are available. The regressions are calculated as dynamic panel data models using what has come to be known as the Arellano–Bond (1991) method.3 This method is well suited for unbalanced panel data sets with a large number of cross-sectional units and a small number of longitudinal units. While this method exploits certain characteristics of such panel data sets to gain efficiency in estimating the parameters of a model, there are potential problems that are addressed by test statistics.

Among the explanatory variables are the contemporaneous war and coup measures, along with one or more of their lagged values. Other explanatory variables include the lagged value of the dependent variable (considered to be correlated with the equation error when differenced) and of the lagged values of the economic and political freedom indexes.
All versions of the model indicate that Magnitude 7 wars lower per capita GDP significantly, by 16 to 24 percent. (Lower magnitude wars have lesser effects.) Coups also have a consistently negative impact effect on GDP per capita, depressing per capita GDP by 8 or 9 percent across the four versions of the model. The sum of the dynamic effects of wars and of coups are given in Table 2, along with their standard errors and t‑statistics. The sum of the impacts of war is significant at the 95 percent level for all specifications, while the sum of the impacts of coups is significant in specifications 3 and 4.
With regard to the institutional variables, economic freedom is found to have a significant, positive effect on per capita GDP, while political freedom is not significant. The positive impact of economic freedom on economic growth is a common finding. Political freedom has had mixed results in analysis of economic growth (Farr, Lord, and Wolfenbarger 1998; Roll and Talbott 2003; Thies 2007; Xu and Li 2008; a survey is provided by Fabro and Aixala 2012).
While the Arellano–Bond method is well-suited for the analysis of this kind of unbalanced panel data set, there are some potential problems. The small number of longitudinal units obviates the use of fixed effects because of Nickell (1981) bias. Instead of specifying fixed effects, the Arellano-Bond method implicitly removes unobserved heterogeneity through first-differencing.
The first test of the appropriateness of this method, the Arellano-Bond AR(2) test, examines if there is second-order serial correlation in the residuals by the cross-sectional unit (in this case, by country). The second test of the appropriateness of this method, the Hansen (1982) J test of overidentifying restrictions, examines the correlation of the residuals with the internally generated instruments used to identify the right-hand side endogenous variables (in this case, the lagged dependent variable). Both tests fall short of the standard level of significance in each of the four versions of the model, providing support for our findings.
As with prior research, this article finds that political instability depresses economic growth. In contrast to prior research, this article also finds that war depresses economic growth. Critical to the latter finding is the use of a large panel data set in which countries are observed every five years from 1955 to 2015. In unreported ordinary least squares (OLS) regressions, in any one cross-section, war is only once (in the 1980 cross-section) found to significantly depress GDP per capita. In contrast, coups are found to significantly depress GDP per capita seven times (in the 1955, 1975, 1980, 1985, 2000, 2005, and 2010 cross-sections). These unreported regressions essentially replicate prior research.
Conclusion
The cost of war is largely masked by national income accounting, which ignores the loss of lives and the destruction of physical and human capital associated with war. Moreover, resources devoted to war are treated as final goods or services instead of as costs of production. This article makes no adjustment to these aspects of national income accounting. It looks only at the impact of war on GDP per capita as measured. It questions the assumption of many that war is good for business, presumably on the basis that war increases employment and production.
Careful measurement of war in the context of a large data set indicates that war is not good for business. In addition to the loss of lives and destruction of physical and human capital ignored by national income accounting, and the mistreatment of the cost of war as a positive value by national income accounting, the tendency is for war to reduce GDP per capita as measured. Countries that suffer from war underperform in terms of production and also underperform in terms of consumption. GDP per capita falls because of lower labor and total factor productivity, presumably due to the destruction of existing physical and human capital, the lack of investment in new physical and human capital, and because of reduced gains from both internal and external trade.
War and other forms of armed conflict should be considered a major impediment to the economic development of low-income countries, many of which are beset by ethnic and religious strife. Among policy options are the protection of moral autonomy at the individual level in pluralistic societies and devolution of government. Devolution can fall short of full sovereignty as in the case of Bangsamoro Autonomous Region in the Philippines, as well as fully sovereign new countries as in the case of Timor-Leste (Roeder 2018). Federal, regional, and global arrangements can secure the advantages of specialization and trade; economies of scale, labor, and capital flows; and robust competition and innovation for even small places. Democratic processes can provide for peaceful changes in government. Market economies can provide meaningful opportunities for both ordinary and talented individuals. Constructive engagement can bring about better policy options in the future. But, just because there may not be a political solution for a place torn by ethnic and religious divisions does not mean there is a military solution.
References
Arellano, M., and Bond, S. (1991) “Some Tests of Specification for Panel Data: Monte Carlo Evidence and an Application to Employment Equations.” Review of Economic Studies 58 (2): 277–97.
Auvinen, J. (1997) “Political Conflict in Less Developed Countries, 1981–89.” Journal of Peace Research 34 (2): 177–95.
Barro, R. J. (1991) “Economic Growth in a Cross Section of Countries.” Quarterly Journal of Economics 106 (2): 407–44.
Barro, R. J., and Lee, J.-W. (1993) “Losers and Winners in Economic Growth.” NBER Working Paper No. 4341.
Baum, C. F. (2019) “Dynamic Panel Data Modeling.” In P. Atkinson, S. Delamont, A. Cernat, J. W. Sakshaug, and R. A. Williams (eds.) SAGE Research Methods Foundations. Available at http://methods.sagepub.com/foundations.
Bolt, J.; Inklaar, R.; de Jong, H.; and van Zanden, J. L. (2018) “Rebasing ‘Maddison’: New Income Comparisons and the Shape of Long-Run Economic Development.” Maddison Project Working Paper No. 10.
Burdekin, R. C. K. (2006) “Bondholder Gain from the Annexation of Texas and Implications of the U.S. Bailout.” Explorations in Economic History 43 (4): 646–66.
Cederman, L.-E.; Gleditsch, K. S.; and Wucherpfennig, J. (2017) “Predicting the Decline of Ethnic Civil War: Was Gurr Right and for the Right Reasons?” Journal of Peace Research 54 (2): 262–74.
Coyne, C. J., and Mathers, R. L., eds. (2011) The Handbook on the Political Economy of War. Northampton, Mass.: Edward Elgar.
Ellingsen, T., and Gleditsch, N. P. (1997) “Democracy and Armed Conflict in the Third World.” In K. Volden and D. Smith (eds.), Causes of Conflict in Third World Countries, 69–81. Oslo: North-South Coalition and International Peace Research Institute.
Fabro, G., and Aixala, J. (2012) “Direct and Indirect Effects of Economic and Political Freedom on Economic Growth.” Journal of Economic Issues 46 (4): 1059–80.
Farr, W. K.; Lord, R. A.; and Wolfenbarger, J. L. (1998) “Economic Freedom, Political Freedom and Economic Well-Being: A Causality Analysis.” Cato Journal 18 (2): 247–62.
Ferguson, N. (2006) “Political Risk and the International Bond Market between the 1848 Revolution and the Outbreak of the First World War.” Economic History Review 59 (1): 70–112.
Frey, B. S., and Waldenstrom, D. (2004) “Markets Work in War: World War II Reflected in the Zurich and Stockholm Bond Markets.” Financial History Review 11 (1): 51–67.
Gleditsch, N. P.; Wallensteen, P.; Eriksson, M.; Sollenberg, M.; and Strand, H. (2002) “Armed Conflict 1946–2001: A New Dataset.” Journal of Peace Research 39 (5): 615–37.
Gwartney, J.; Lawson R.; and Block, W. (1996) Economic Freedom of the World: 1975–1995. Vancouver: Fraser Institute.
Gwartney, J.; Lawson, R.; and Hall, J. (2017) Economic Freedom of the World, 2017 Annual Report. Vancouver: Fraser Institute.
Hansen, L. (1982) “Large Sample Properties of Generalized Method of Moments Estimators.” Econometrica 50 (3): 1029–54.
Harbom, L.; Melander, E.; and Wallensteen, P. (2008) “Dyadic Dimensions of Armed Conflict, 1946–2007.” Journal of Peace Research 45 (5): 697–710.
Hegre, H.; Ellingsen, T.; Gates, S.; and Gleditsch, N. P. (2001) “Toward a Democratic Civil Peace? Democracy, Political Change, and Civil War, 1816–1992.” American Political Science Review 95 (1): 33–46.
Higgs, R. (2006) “Regime Uncertainty: Why the Great Depression Lasted So Long and Why Prosperity Resumed after the War.” In Depression, War and the Cold War, 3–29. New York: Oxford University Press.
Jong-A-Pin, R. (2009) “On the Measurement of Political Instability and Its Impact on Economic Growth.” European Journal of Political Economy 25 (1): 15–29.
Maddison, A. (1995) Monitoring the World Economy 1820–1992. Paris: OECD.
_________ (2001) The World Economy: A Millennial Perspective. Paris: OECD.
_________ (2006) The World Economy: Historical Statistics. Paris: OECD.
Marshall, M. G., and Elzinga-Marshall, G. (2017) Global Report 2017: Conflict, Governance and State Fragility. Vienna, Va.: Center for Systemic Peace.
Mueller, J. (1989) Retreat from Doomsday: The Obsolescence of Major War. New York: Basic Books.
Murdoch, J. C., and Sandler, T. (2004) “Civil Wars and Economic Growth: Spatial Dispersion.” American Journal of Political Science 48 (1): 138–51.
Murphy, R. H., and Lawson, R. A. (2018) “Extending the Economic Freedom of the World Index to the Cold War Era.” Cato Journal 38 (1): 265–84.
Nickell, S. (1981) “Biases in Dynamic Models with Fixed Effects.” Econometrica 49 (6): 1417–26.
Pecquet, G. M., and Thies, C. F. (2010) “Texas Treasury Notes and the Mexican-American War: Market Responses to Diplomatic and Battlefield Events.” Eastern Economic Journal 36 (1): 88–106.
Roeder, P. A. (2018) National Secession: Persuasion and Violence in Independence Campaigns. Ithaca, N.Y.: Cornell University Press.
Roll, R., and Talbott, J. (2003) “Political Freedom, Economic Liberty, and Prosperity.” Journal of Democracy 14 (3): 75–89.
Sarkees, M. S., and Wayman, F. (2010) Resort to War: 1816–2007. Washington: CQ Press.
Schneider, G., and Troeger, V. E. (2006) “War and the World Economy: Stock Market Reactions to International Conflicts.” Journal of Conflict Resolution 50 (5): 623–45.
Small, M., and Singer, J. D. (1982) Resort to Arms: International and Civil War, 1816–1980. Beverly Hills, Calif.: Sage.
Thies, C. F. (2007) “Political and Economic Freedom Reconsidered.” Journal of Private Enterprise 22 (2): 95–118.
Weidenmier, M. D. (2002) “Turning Points in the U.S. Civil War: Views from the Grayback Market.” Southern Economic Journal 68 (4): 875–90.
Weidenmier, M. D., and Oosterlinck, K. (2007) “Victory or Repudiation? The Probability of the Southern Confederacy Winning the Civil War.” NBER Working Paper No. 13567.
Willard, K. L.; Guinnane, T.; and Rosen, H. S. (1996) “Turning Points in the Civil War: Views from the Greenback Market.” American Economic Review 86 (4): 1001–18.
Xu, Z., and Li, H. (2008) “Political Freedom, Economic Freedom, and Income Convergence: Do Stages of Economic Development Matter?” Public Choice 135 (3–4): 183–205.
Zanger, S. C. (2000) “A Global Analysis of the Effect of Political Regime Changes on Life Integrity Violations, 1977–93.” Journal of Peace Research 37 (2): 213–33.
1 Nevertheless, France has incorporated 10 overseas departments and “collectivities” into France, including the islands of Martinique and Guadeloupe in the Caribbean Sea, Réunion in the Indian Ocean, and French Guiana on the mainland of South America.
2 Higgs (2006) thus describes the high levels of employment and production during World War II as a false prosperity.
3 Baum (2019) provides a review of the development of dynamic panel data models.
