A certificate of need (CON) law requires those seeking to open or expand a medical facility or offer a specific medical service to first prove to regulators that the facility or service is needed. Found in a handful of industries including moving companies and taxi markets, such laws are most common in health care, with state CON laws resembling central planning. CONs are required for dozens of technologies and services, including new hospitals, hospital expansions, beds, urgent care centers, birthing centers, cancer treatment facilities, substance-use treatment facilities, and psychiatric care facilities. Providers in states with CON laws are often barred from expanding existing services without an additional CON.
New York was the first state to require a CON in health care in 1964. Within a decade, 26 more states had followed. Then, in 1974, Congress passed the National Health Planning and Resources Development Act, effectively compelling adoption by threatening to withhold federal funds from any state without a CON program. The stated goals were to rein in what policymakers saw as runaway health care spending, driven by providers acquiring expensive, unnecessary capital, and to promote access in underserved areas. By the mid-1980s, however, researchers had already accumulated evidence that CON laws were creating more problems than they solved. Congress eliminated the federal inducement in 1986. Some forms of these laws, nonetheless, remained on the books in most states, sustained largely by the incumbent providers who benefited from them.
An applicant seeking a CON must prove to the government’s satisfaction that the public “needs” the applicant’s services. This complicated and time-consuming process—unusual in a market economy for most other goods and services—requires providers to submit lengthy applications to “prove” need.
Controversially, incumbent providers are typically permitted to participate in the application approval process. When they object to the application of a would-be rival, that can trigger a lengthy quasi-judicial process in which applicants must demonstrate that their project will not “duplicate” or otherwise interfere with the existing provider’s business. Sometimes the process is resolved through a negotiated settlement in which the entrant agrees not to encroach on the incumbent’s territory. Given the cost and uncertainty involved, many would-be entrants are likely deterred from applying. As such, it’s impossible to know how many providers are deterred from applying in the first place.
Yet, this does not mean that CON laws do not have observable effects. They have been widely studied. These regulations are found in some states and not others and, because some states have modified and even eliminated these requirements over time, the regulations are well-suited for empirical analysis. Hundreds of peer-reviewed assessments of these regulations have already been conducted. Employing careful statistical analyses that control for possibly confounding effects, the preponderance of evidence from these studies offers a clear picture that CON laws are associated with limited access to care, higher costs, worse quality, and especially negative effects on vulnerable and underserved populations.
The Scale and Scope of CON
CON rules cover more than 30 services and technologies from hospital beds and hospice care facilities to dialysis clinics and drug-use treatment centers.1 Table 1 lists the services and technologies that are regulated through CON and the frequency with which they are regulated.2 Figure 1 shows the number of services and technologies that require a CON in each state.3 The most common CON requirements are for nursing homes, psychiatric services, and hospitals, while the least common requirements are for air ambulances, ultrasounds, and subacute services.
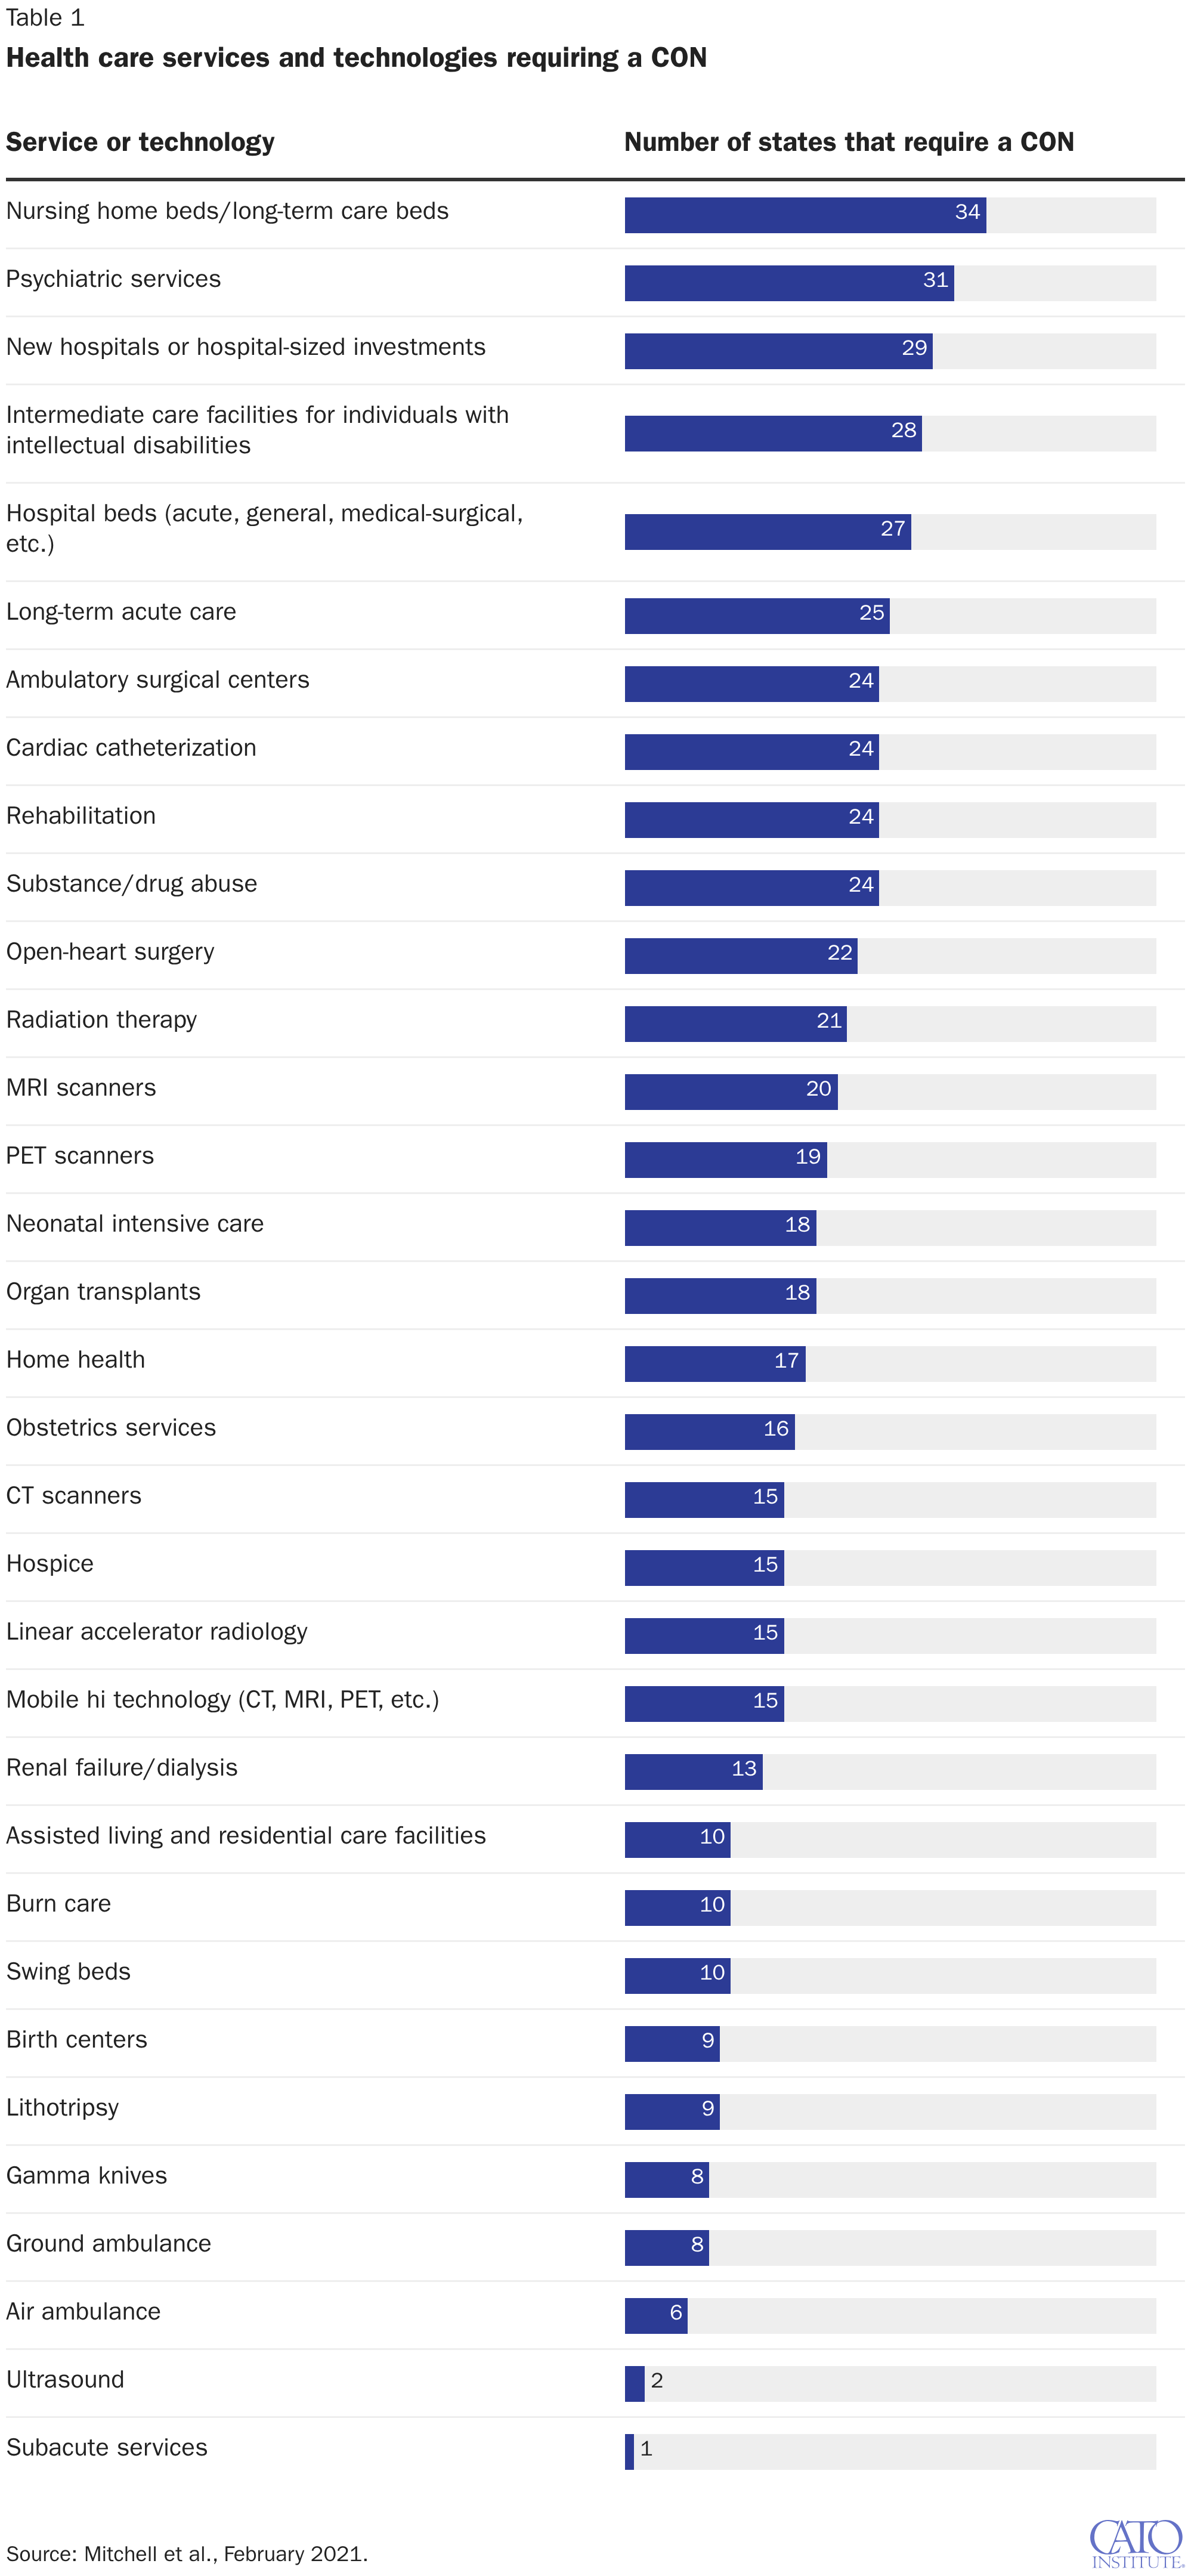
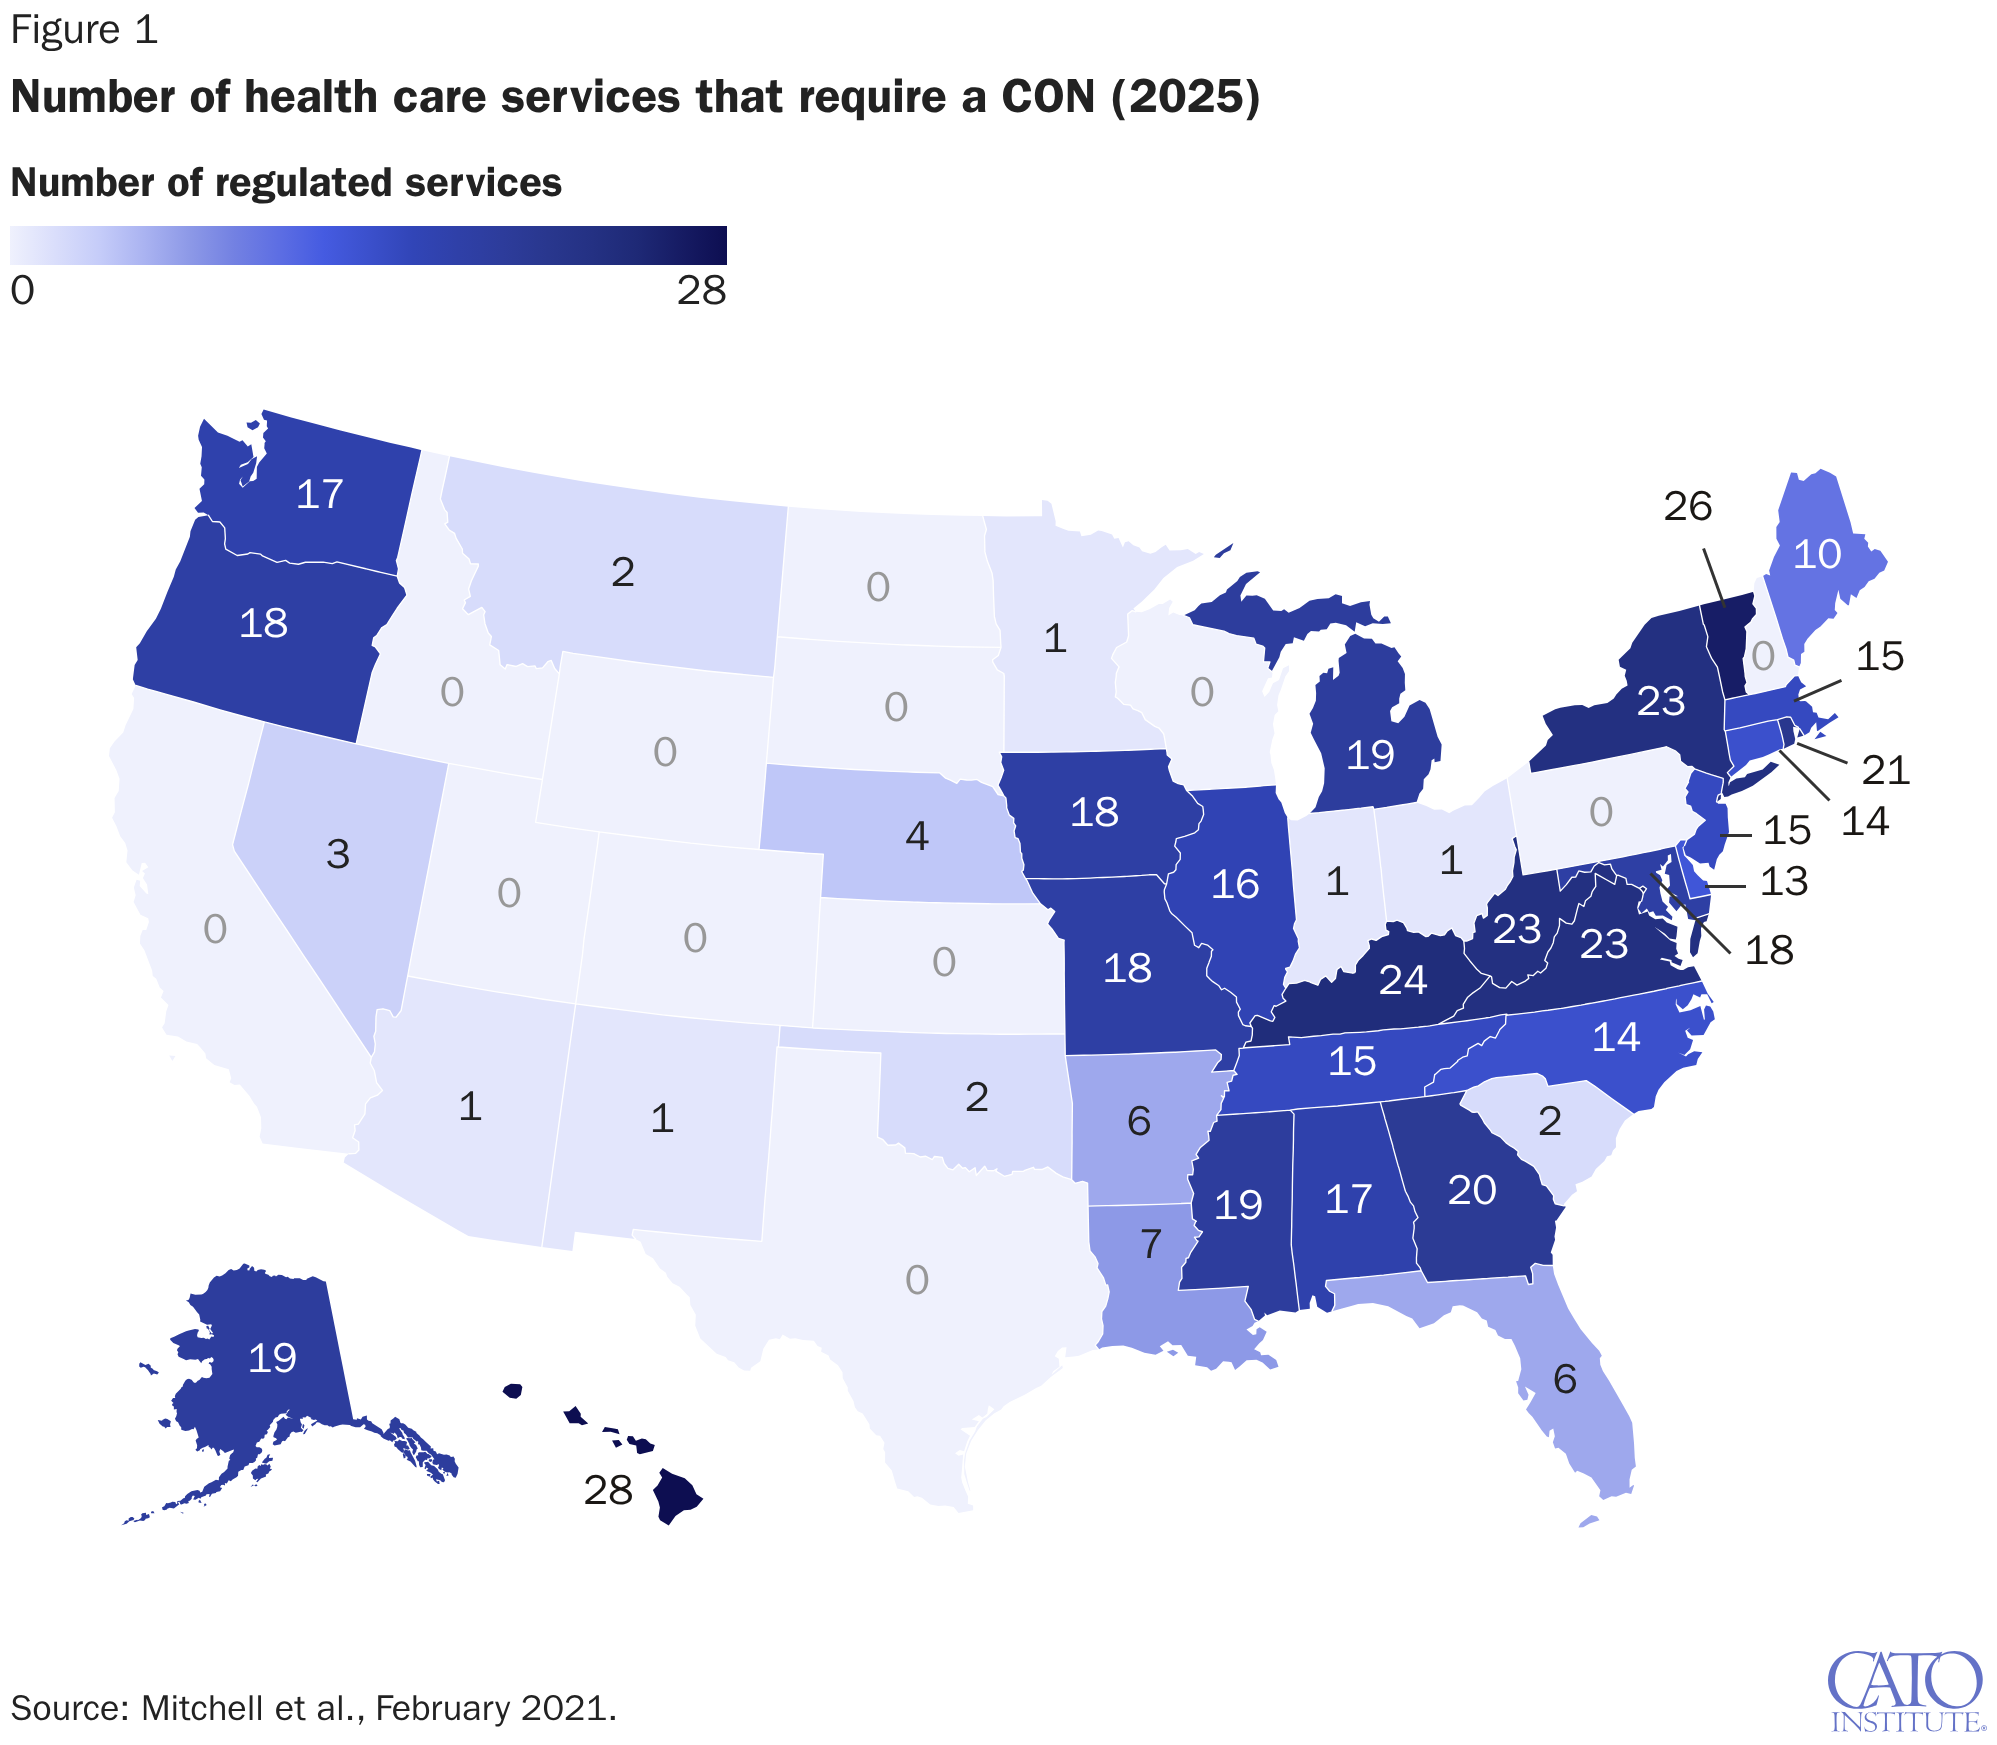
Today, 39 states require a CON for at least one health care service or technology.4 But some of these requirements are relatively limited. For example, Arizona, Minnesota, and New Mexico require CONs only for ambulance services, while Indiana and Ohio require CONs only for nursing homes.5 Thirty states require a CON for four or more services or technologies, and given recent reforms in South Carolina, Oklahoma, and Tennessee, that number may soon shrink.6
CON laws give state regulators the power to determine whether a service provided by a certificate applicant is “needed” in the community.7 Regulators typically attempt to determine need by constructing state health plans that try to project need based on population estimates, utilization of current resources, and past experience.8
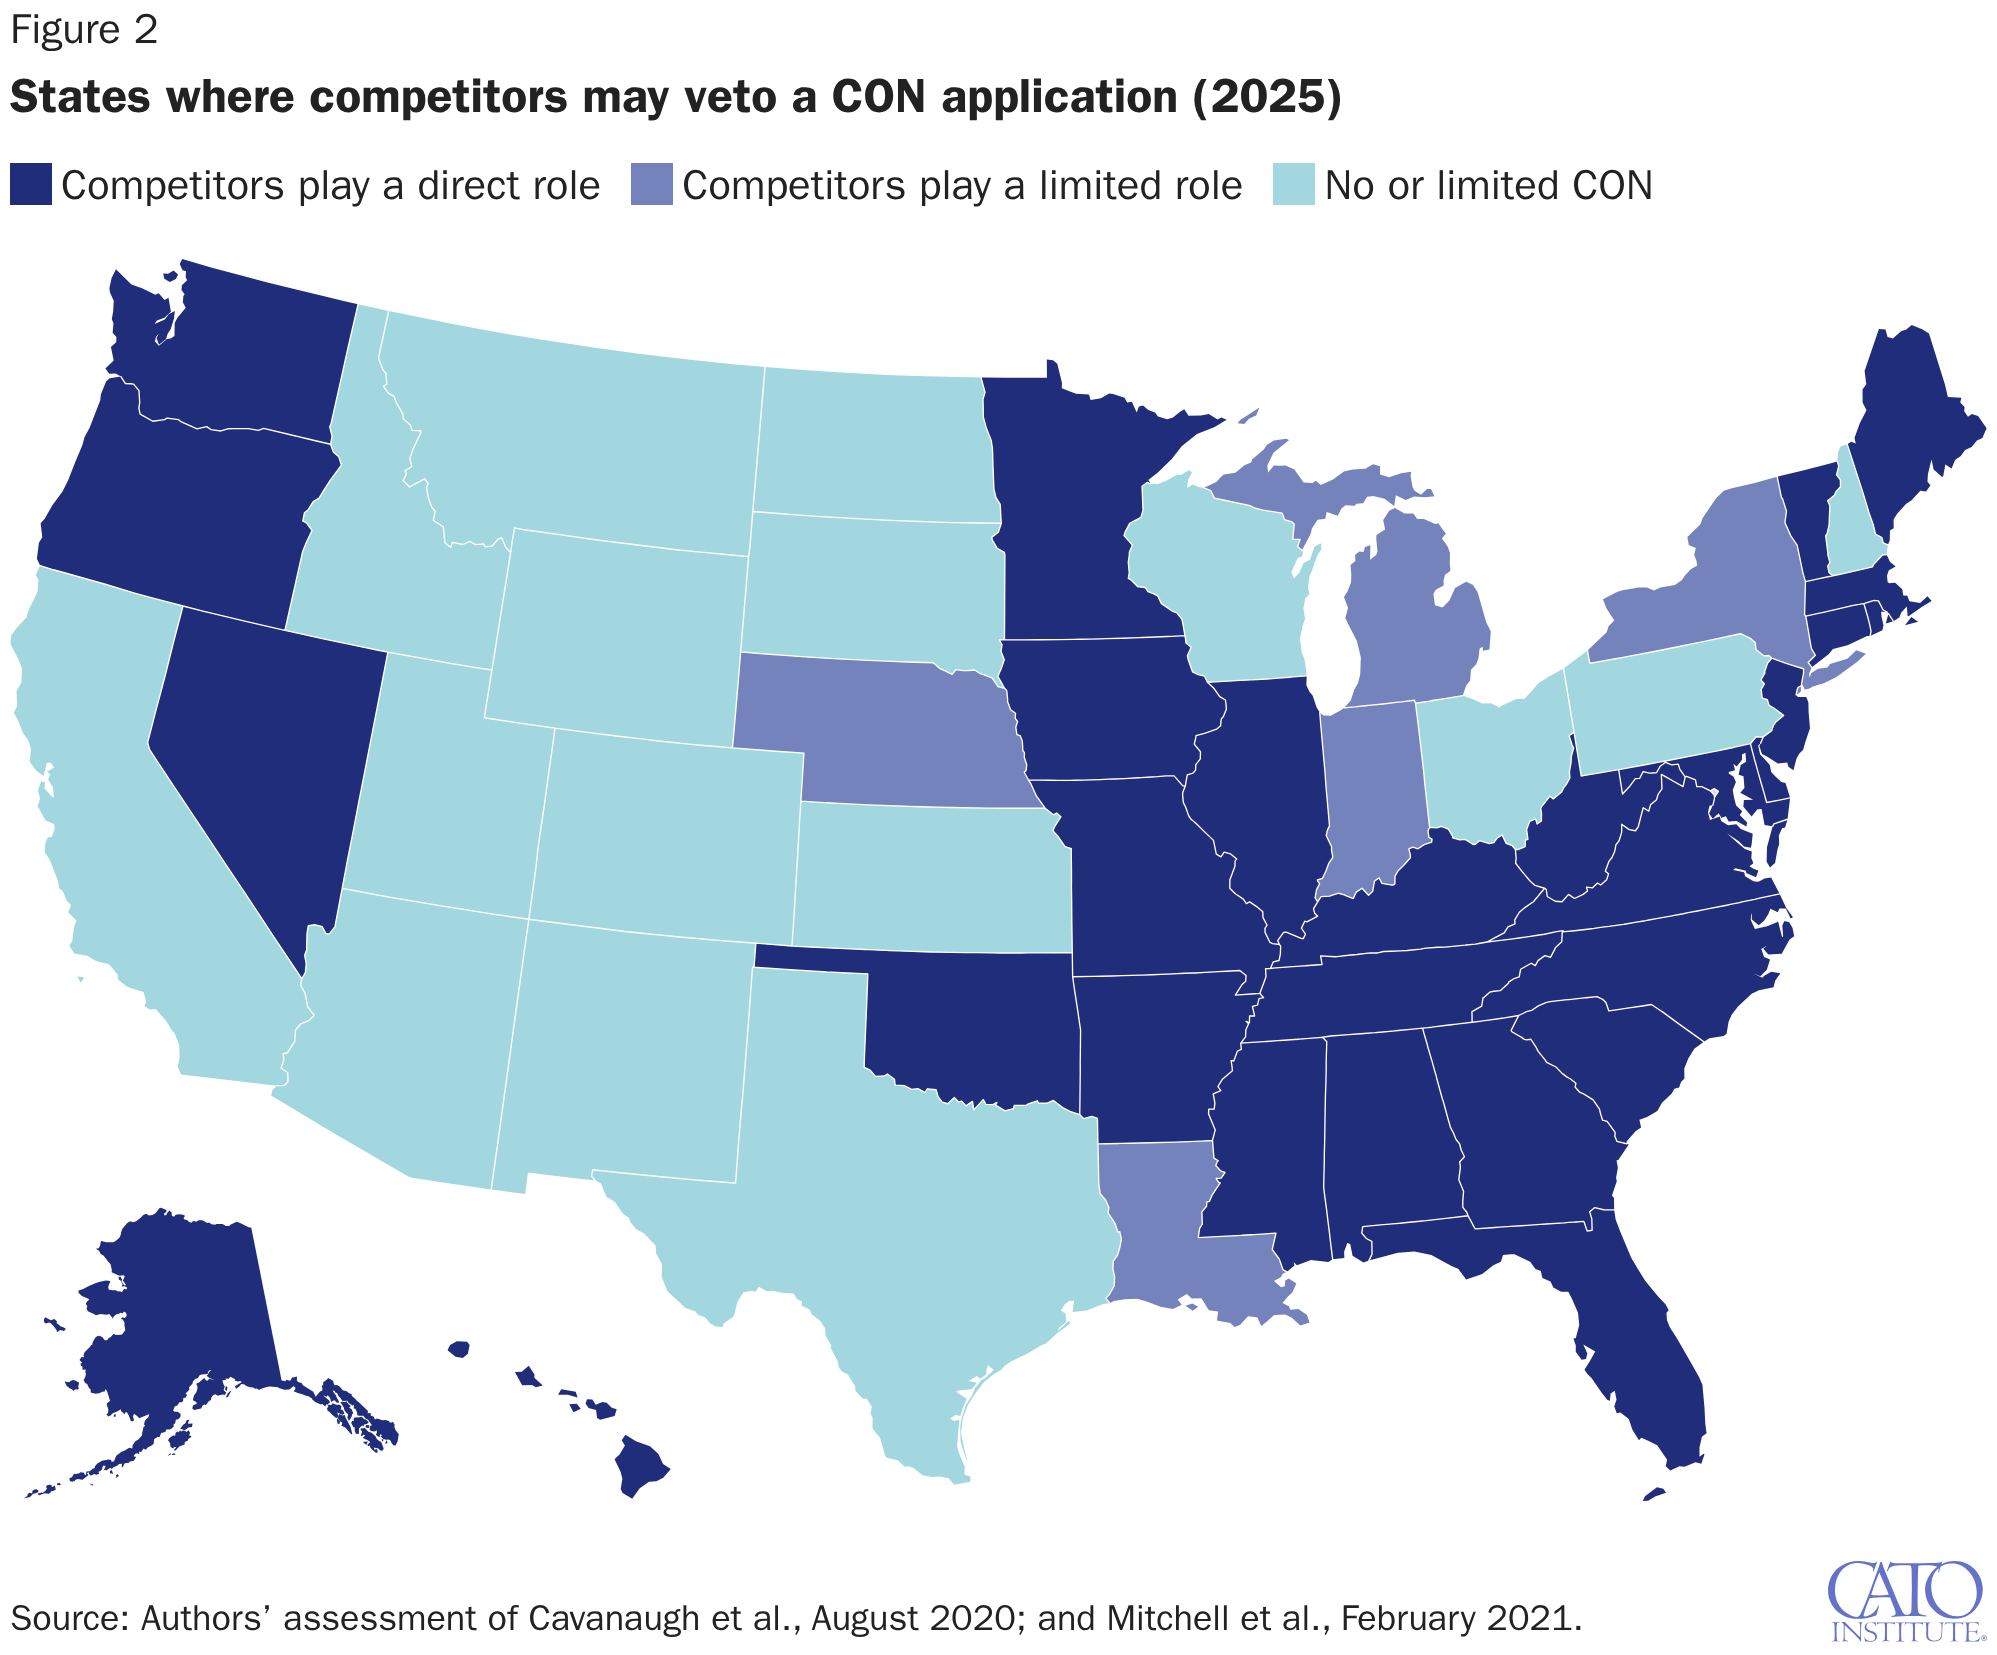
Regulators also rely on public comments and formal written objections. As seen in Figure 2,9 in most CON states, policymakers consider objections from would-be competitors when they make their determination.10 Because of the prominent role that incumbent providers play in the CON process, critics have often dubbed the regulation a “competitor’s veto.“11
When a would-be competitor objects to an application, that can trigger an expensive and time-consuming process featuring hearings similar to legal proceedings. In some cases, incumbents drop their objections after the applicant agrees not to encroach on incumbent territory, a type of territorial collusion that would be a per se violation of the Sherman Antitrust Act if it were not facilitated by the state.12
Even when competitors don’t object to an application, regulators may still deny an application if they believe it will “duplicate” an existing service—a practice that guarantees a local monopoly when followed literally. The formulas that regulators rely on to determine need open another avenue for competitors to influence the process. These formulas direct regulators to deny an application if current resource utilization is below a certain threshold.13 This means that incumbents can increase the odds that a competitor’s application will be denied simply by keeping their utilization rates below that threshold.
Applicants can spend months or even years preparing applications, and they sometimes employ the services of boutique consulting firms to help them navigate the process.14 Some providers report that while awaiting approval, they have lost hundreds of thousands of dollars in forgone profits.15 Approval rates vary from state to state. One analysis found approval rates of 51 percent in Virginia, 57 percent in Georgia, and 77 percent in Michigan.16
Empirical Evidence Debunks the Claims of CON Supporters
Hospital executives and their representatives typically claim that CON reform or repeal will hurt consumers and payors by causing health care costs and payments to rise. In 2023, North Carolina’s hospital association warned, for example, that “repealing North Carolina’s CON law will likely raise healthcare costs, not lower them.“17
CON laws are explicitly designed to limit competition, so this claim is inconsistent with the standard microeconomic expectation that more competition tends to drive prices down instead of up. In addition, incumbent providers benefit from more and higher payments; thus, the fact that providers typically oppose CON deregulation or elimination reflects at least some implicit evidence that the regulations do indeed raise, instead of lower, payments.18
Hospitals also often claim that CON reform or repeal will cause hospitals to shutter their doors or suspend certain services. In response to proposed 2024 reforms, for example, Tennessee’s hospital association warned that “current proposed state legislation to drastically change the [CON] law would cause hospital closures, cutbacks in the types of services offered at local hospitals, and ultimately result in a reduction in the availability of care for many Tennesseans.“19 As with concerns over cost, this claim is hard to square with the nature of CON regulation. A more straightforward expectation is that a restriction such as CON will limit supply.
One way to evaluate these fears is to observe what actually happens in CON and non-CON states: 32 percent of Americans live in a state with no health care CON requirements, and 42 percent live in a state with no or limited CONs that apply to only a few categories such as ambulance services.20 Figure 1 demonstrates that among CON and non-CON categories, there are both high- and low-income states, urban and rural states, and coastal and landlocked states.21 Using regression analysis, researchers can compare outcomes including cost, access, and quality in CON and non-CON states while controlling for other, possibly confounding factors such as income and demography.
As it turns out, many researchers have done this.22 A recent review found 128 studies that together contained 458 separate statistical tests assessing the effect of CON on outcomes. The review was organized around the principal objectives that CON advocates claim to be worried about: lower cost, greater access (especially for underserved populations), and enhanced quality.23
Figure 324 summarizes the results, which are adapted from that review, and adds a few additional tests that have been published since then.25 Among 448 tests with a clear normative implication, 53 percent link the regulation to a “bad” outcome such as more spending, less access, or lower quality of care. Just 12 percent of tests find that CON produces a desirable outcome.
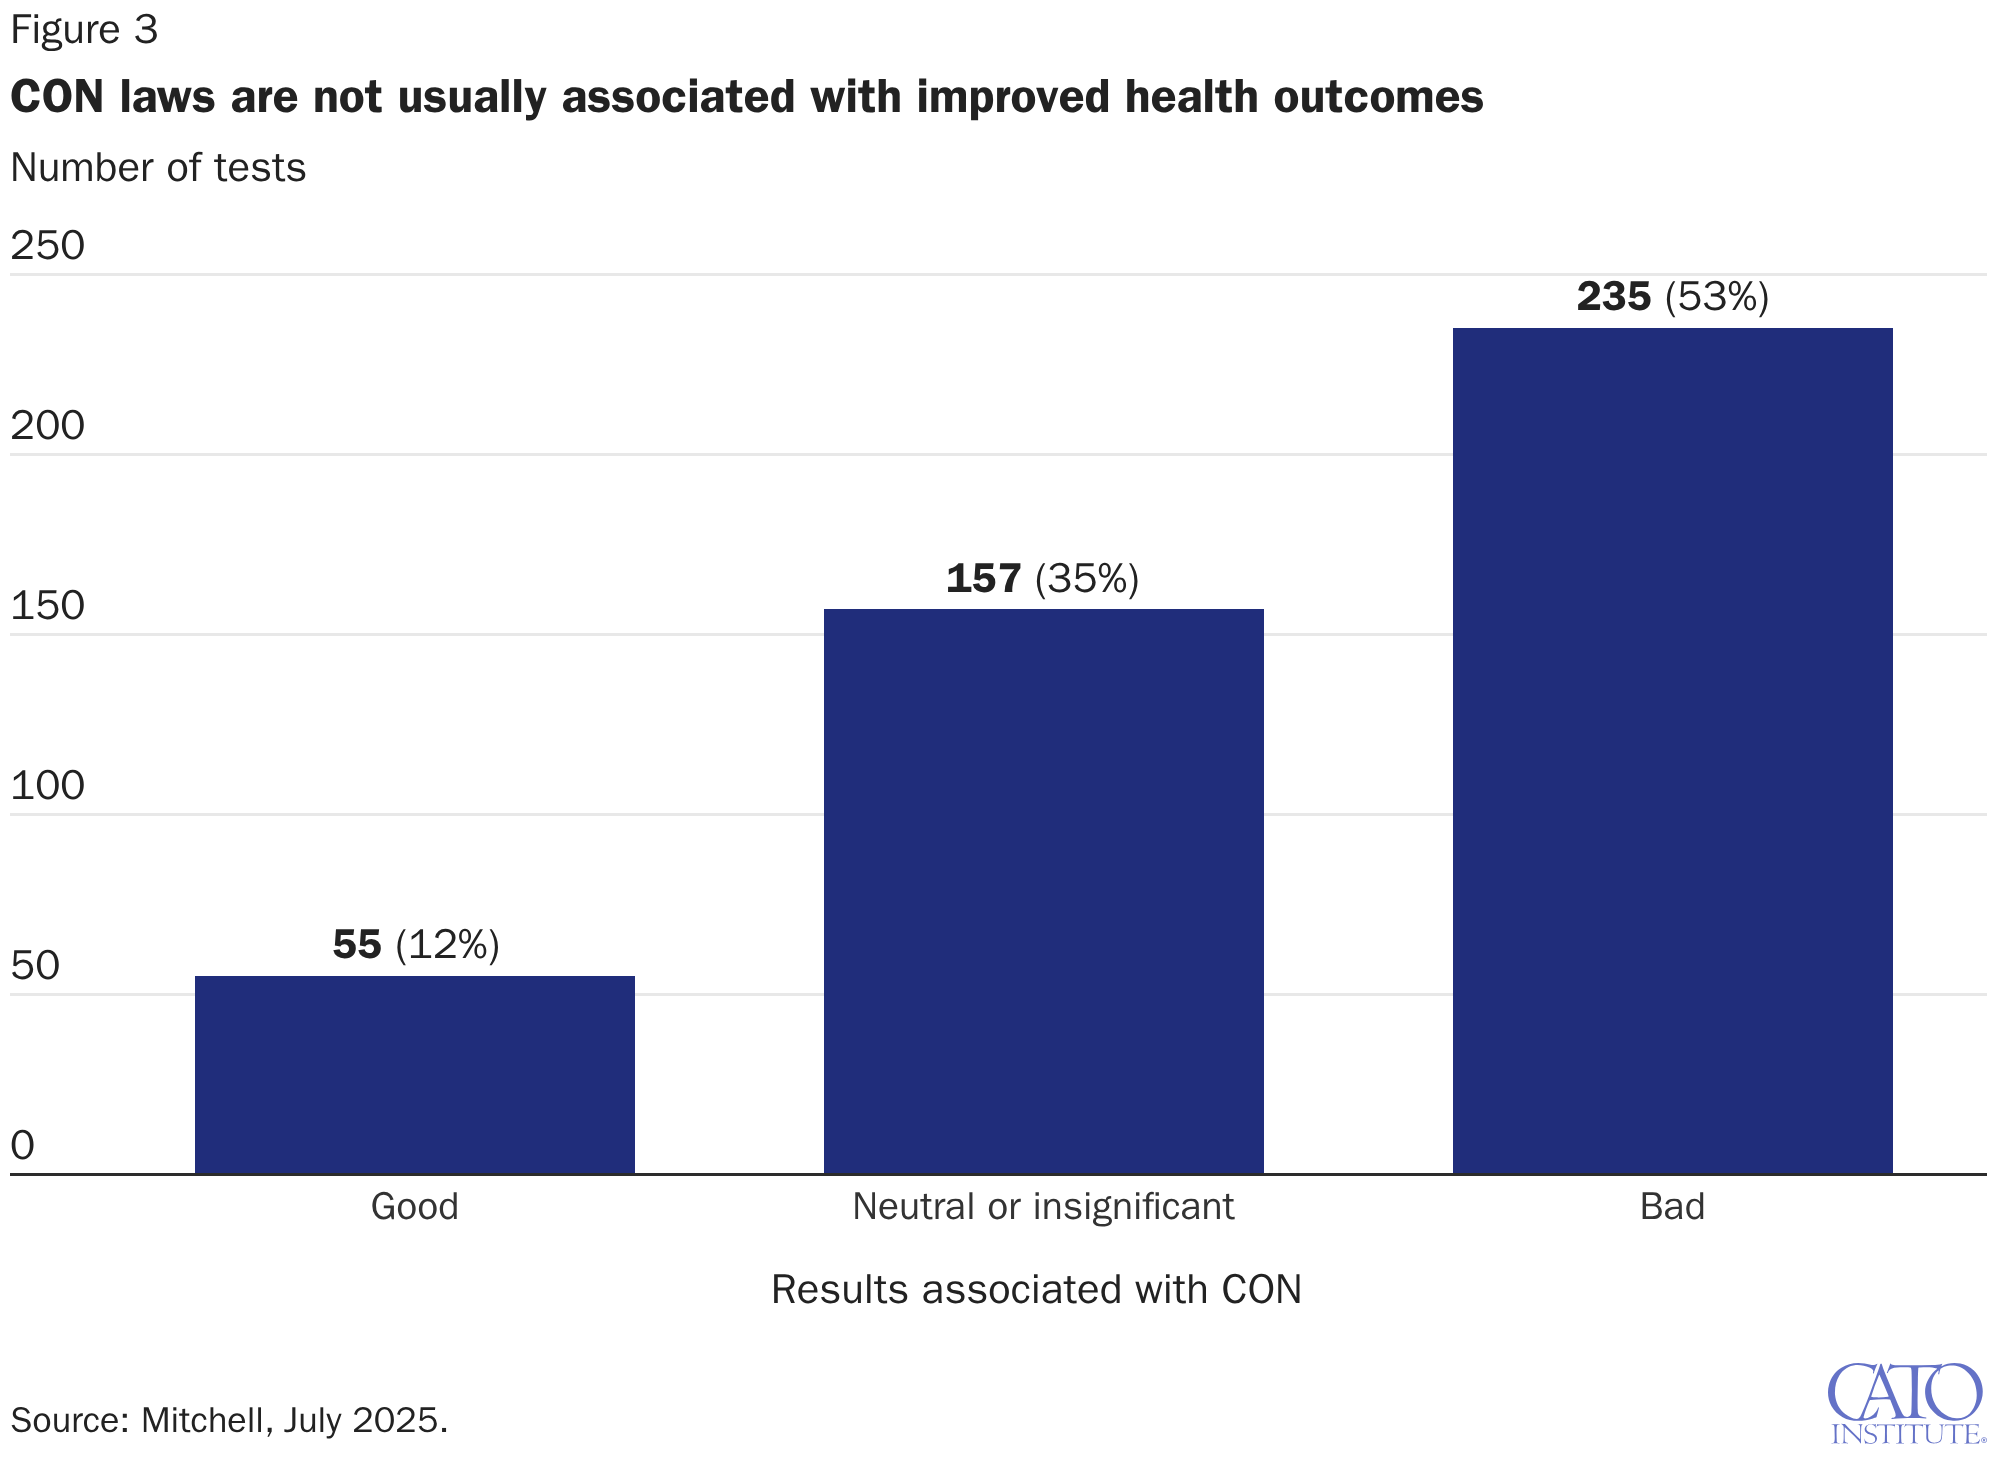
The evidence is especially lopsided when it comes to spending per service, availability of care, and access for underserved populations. Among 45 tests assessing the relationship between CON and spending per service, 60 percent find the regulation tied to higher spending, while just 7 percent find it connected to lower spending.26 Among 88 tests assessing the relationship between CON and availability of services, 80 percent show the regulation reducing access, while just 7 percent find CON correlated with greater access. And among 24 tests assessing the relationship between CON and underserved populations, 88 percent find the regulation harmful to these communities, while none find it beneficial.
These studies typically compare states that have not had CON laws for an extended period to those that still do. An alternative way to group the studies is to focus on the ones that compare states that eliminated or reformed their CON laws and see what happened before and after those changes. Figure 4 does that.27 Of the 42 studies that undertook this type of event analysis, only one found that outcomes worsened after repeal. Over two-thirds of the studies found that outcomes improved after reform or repeal, and 13 found that states were no worse off after reform or repeal.
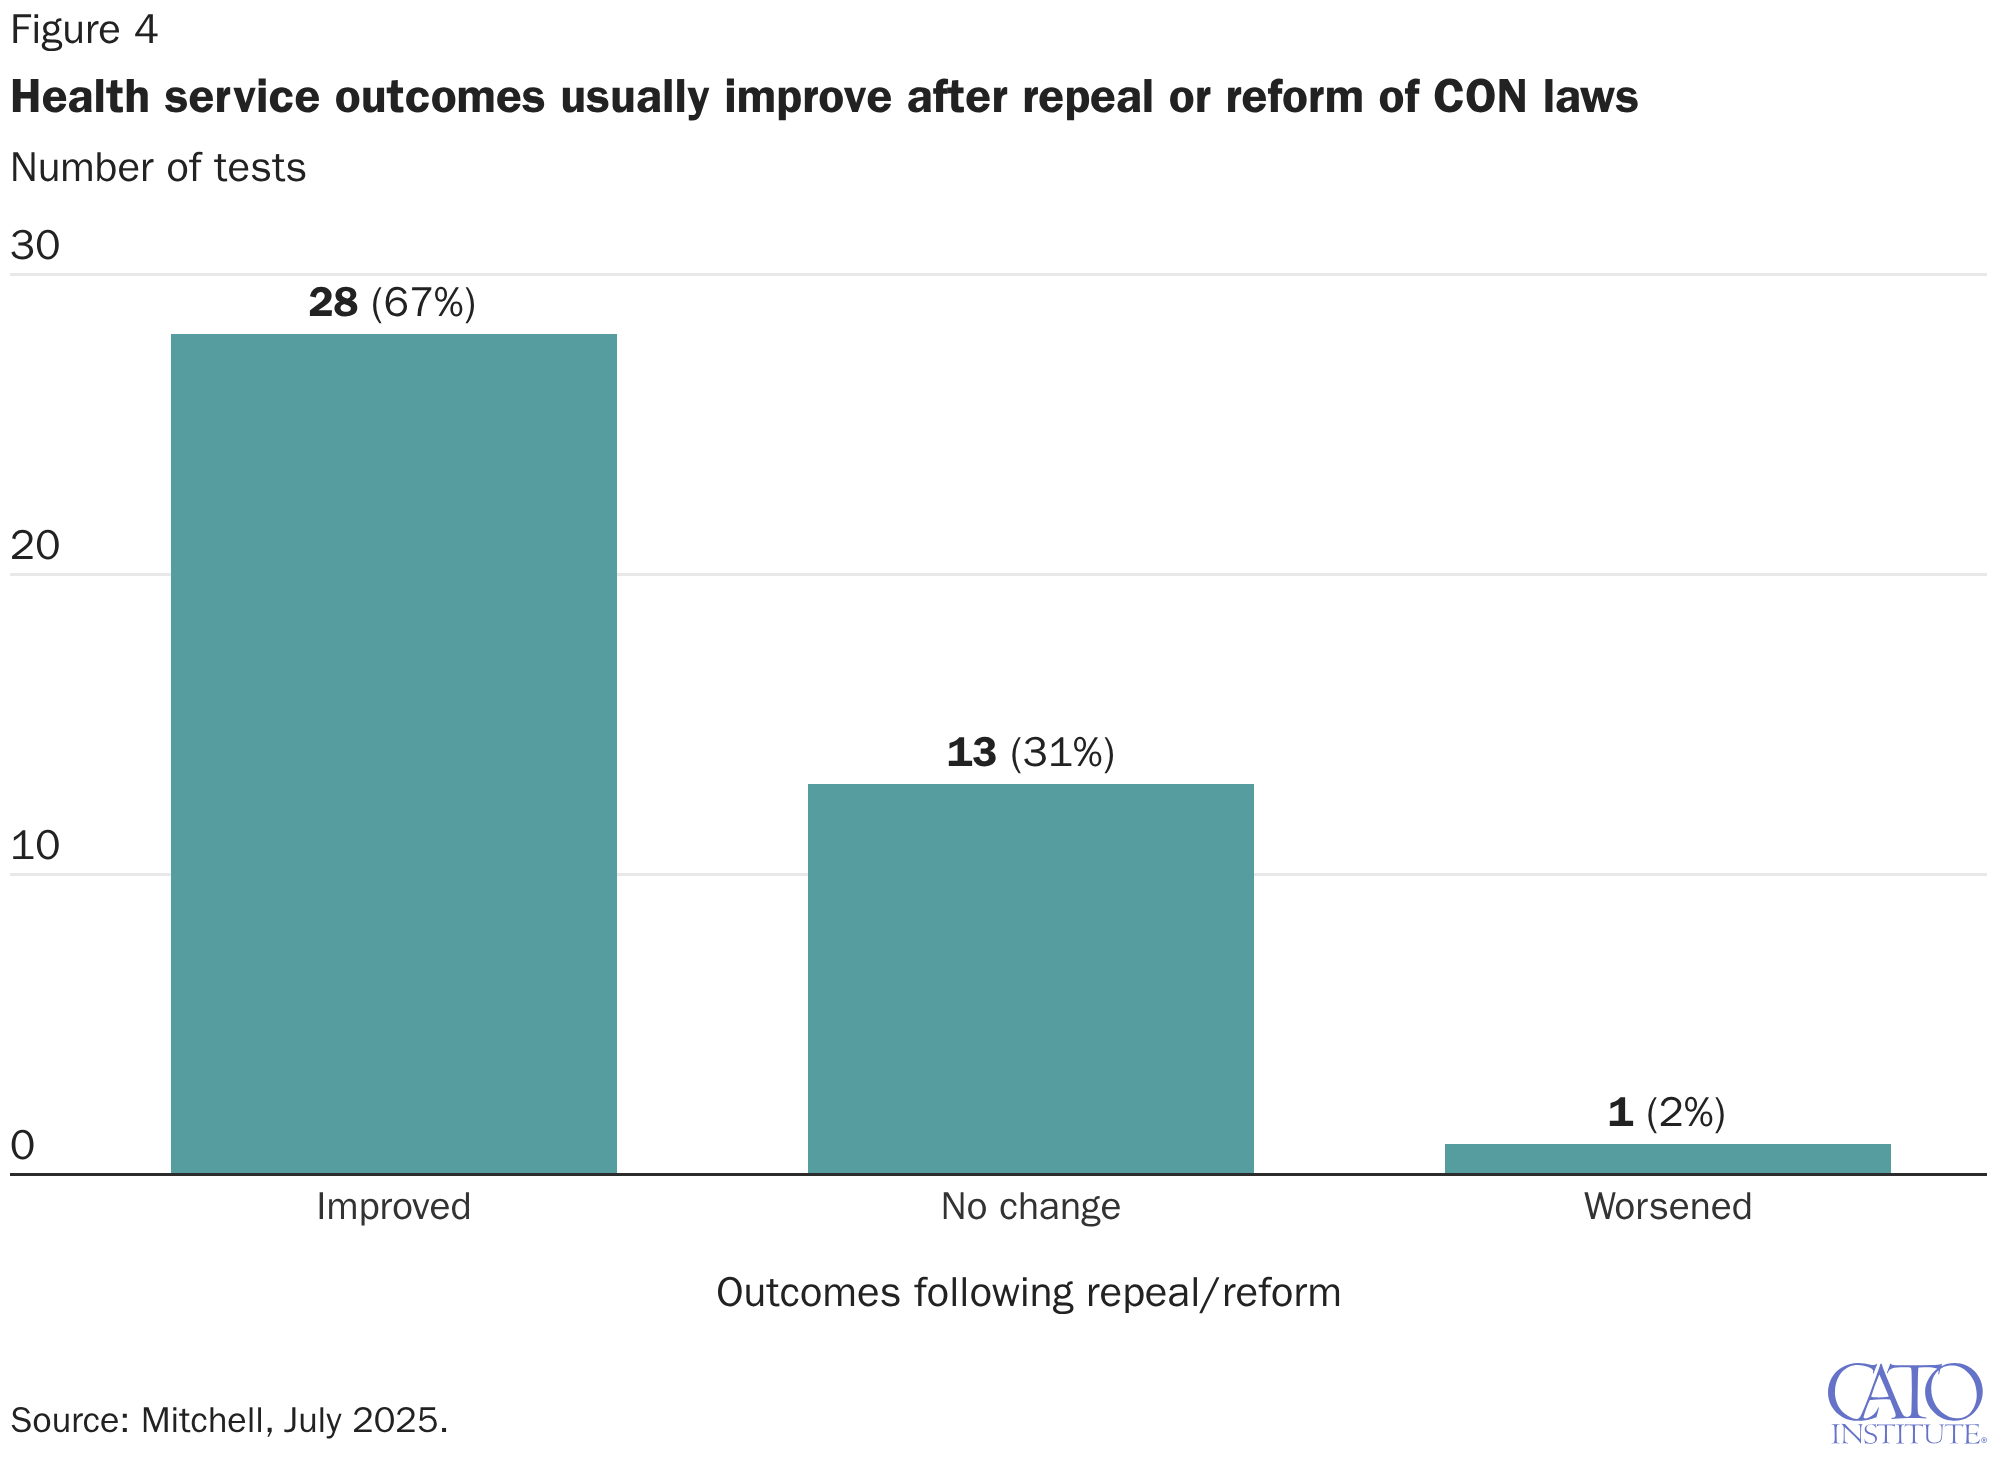
In summary, there is little evidence that outcomes worsen following the repeal or reform of CON laws. At worst, some outcomes, such as expenditures, are unchanged. At best, patients can expect to gain greater access to lower-cost and higher-quality care.
CON Laws Hurt Rural States the Most
Health care access tends to be more limited in rural communities. Compared with urban centers, these areas have fewer primary care providers, fewer specialists, and fewer health care facilities. CON laws seem to exacerbate these problems. Empirical studies focused specifically on rural areas have concluded that CON laws tend to suppress the number of hospitals accessible to residents of rural areas. Recent studies looking at the number of hospitals in several rural states after reforms had been enacted found that after CON laws were repealed, the number of hospitals in both rural and urban areas saw a substantial increase.28
To illustrate that more concretely, Figure 5 shows the total number of hospitals per 100,000 people in rural counties.29 In the following county-level analysis, which uses data from 2024, “rural” is defined by using the US Department of Agriculture’s “Rural-Urban Continuum Codes” (RUCC). Our analysis is focused on counties with a RUCC of 8 or 9—the two most rural categories. Both have an urban population of fewer than 5,000 people. A score of 8 indicates that the county is adjacent to a metro area, meaning it both physically adjoins a metro area and has at least 2 percent of its employed labor force commuting to central metro counties. A score of 9 is assigned to counties that do not meet either of those adjacency criteria.
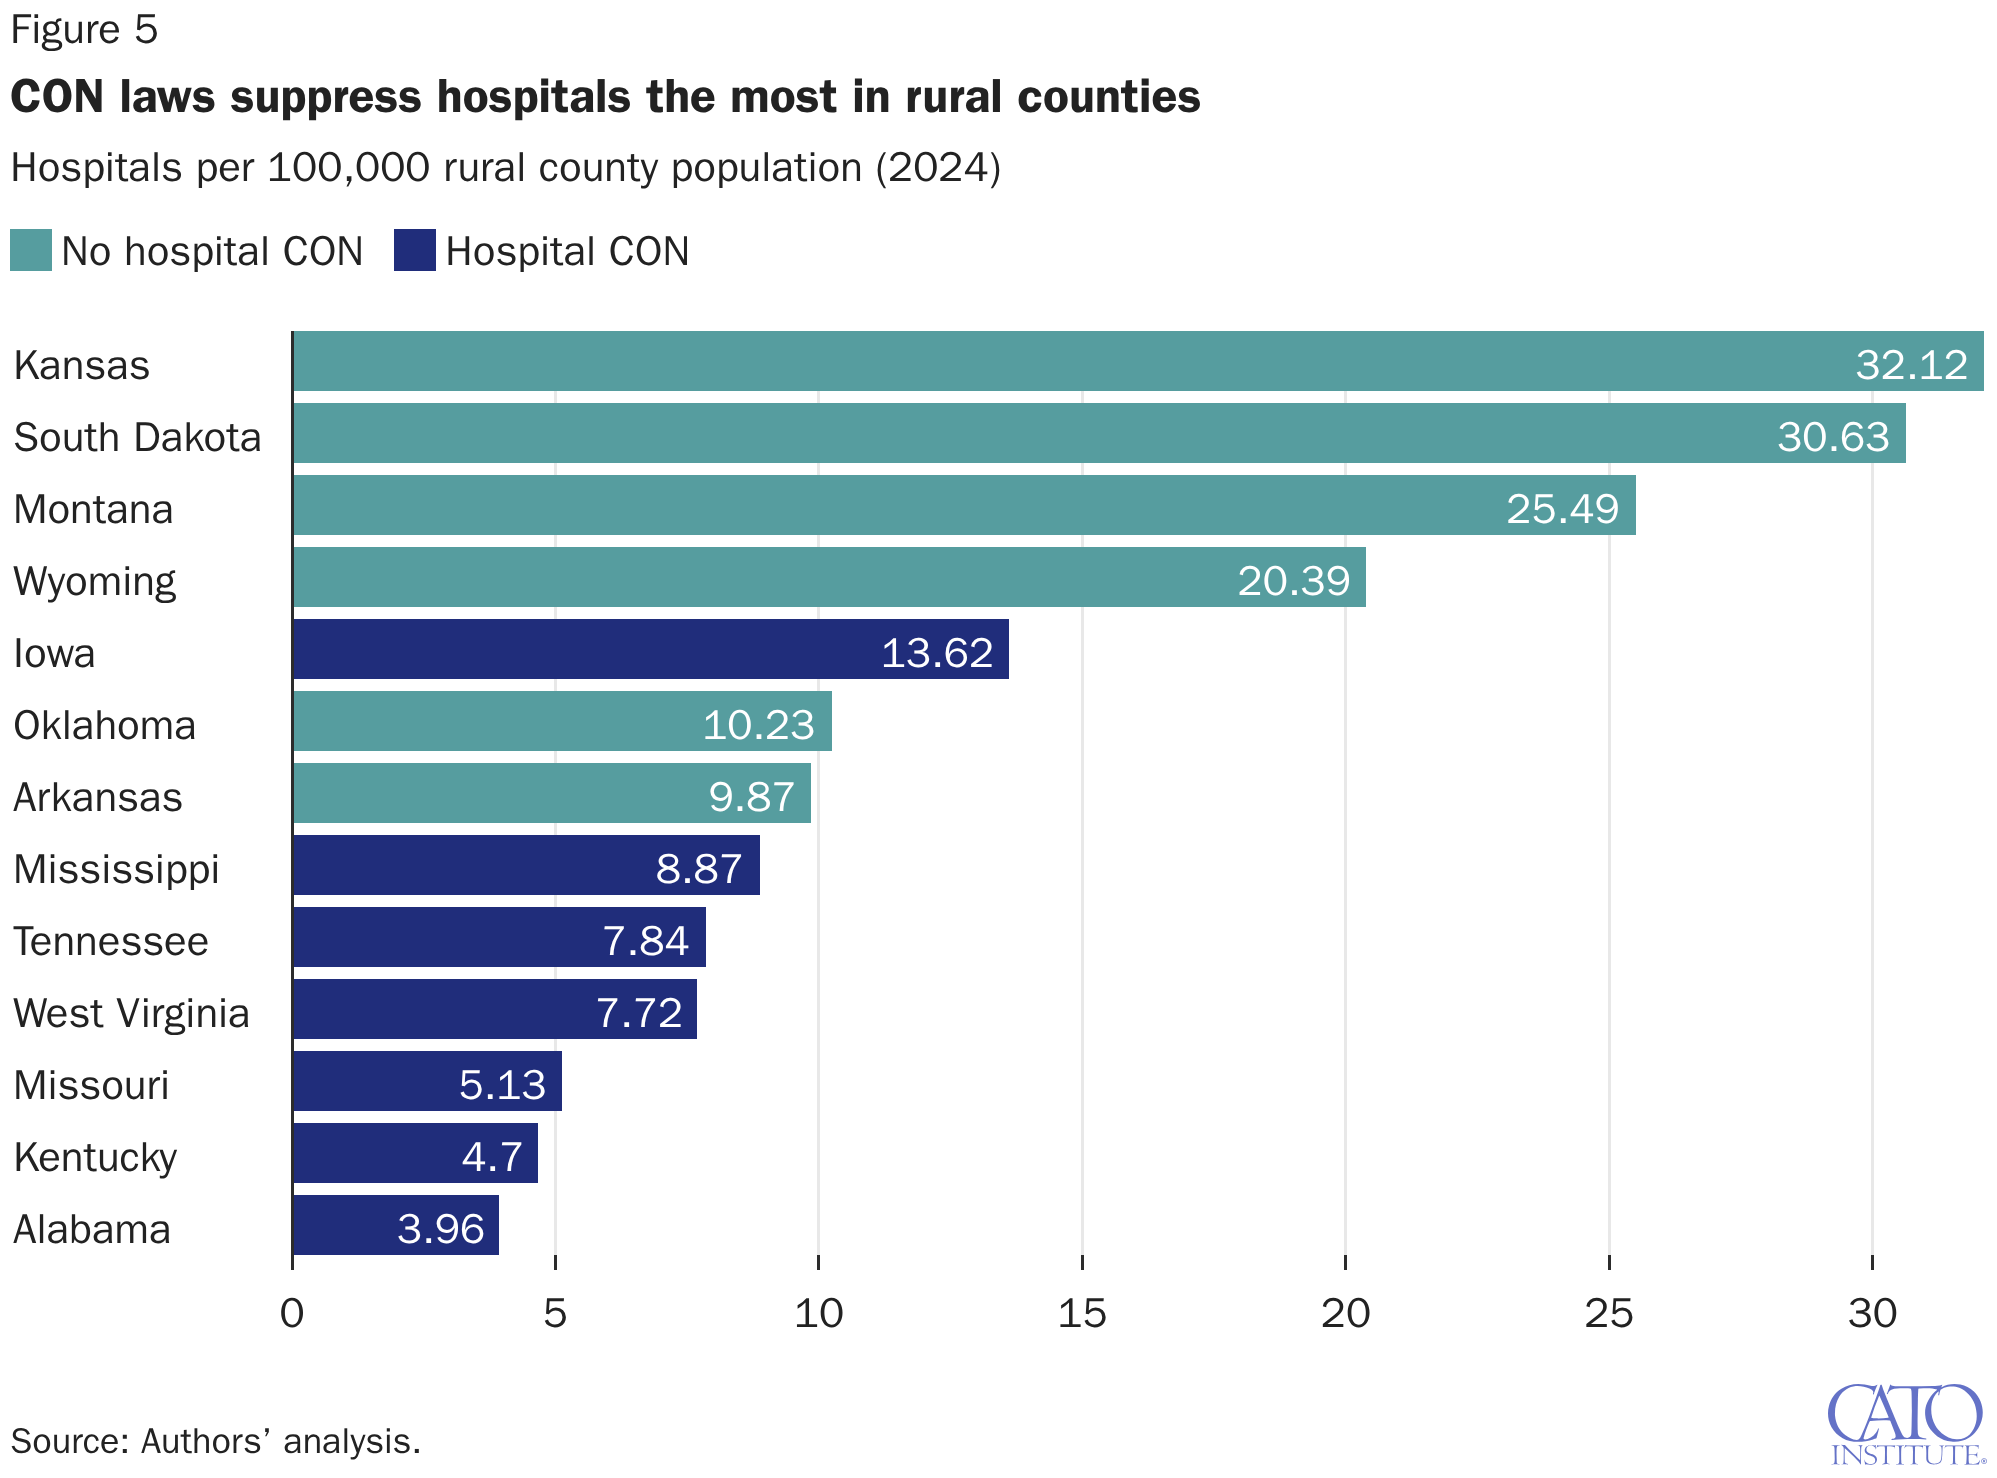
We also narrow our focus to states that are less wealthy than average in terms of median household income. All of the counties studied here are in states that rank in the bottom two quintiles of median household income. The income filter is important here: Some states (e.g., Maine and New Hampshire) are rural by RUCC scale standards but are considered higher-than-average on the median household income scale. Those states are excluded from this analysis as the focus on rural areas in the policy and research discussion tends to be on communities that are both rural and relatively poorer.
The green bars represent states that do not have CON laws for new short-term hospitals (or similar facilities), and the blue bars represent those that do. The pattern is stark: Most rural counties in states without hospital CON laws have substantially more hospitals per capita than most rural counties in states with these types of CON laws. Every non-CON state in the analysis has more rural hospitals per capita than every CON state, with the exception of Iowa. In the average non-CON state included here, there are 21.5 rural hospitals per 100,000 rural population. In the average CON state included here, there are just 7.4 rural hospitals per 100,000 rural population.
Less Access to Health Services in CON States
The gap between CON and non-CON states in terms of availability, access, and variety of services is not limited to hospitals. As depicted in Figure 6, across four distinct service categories, states without a service-level CON requirement consistently offer more services per capita than states with a service-level CON in place.30
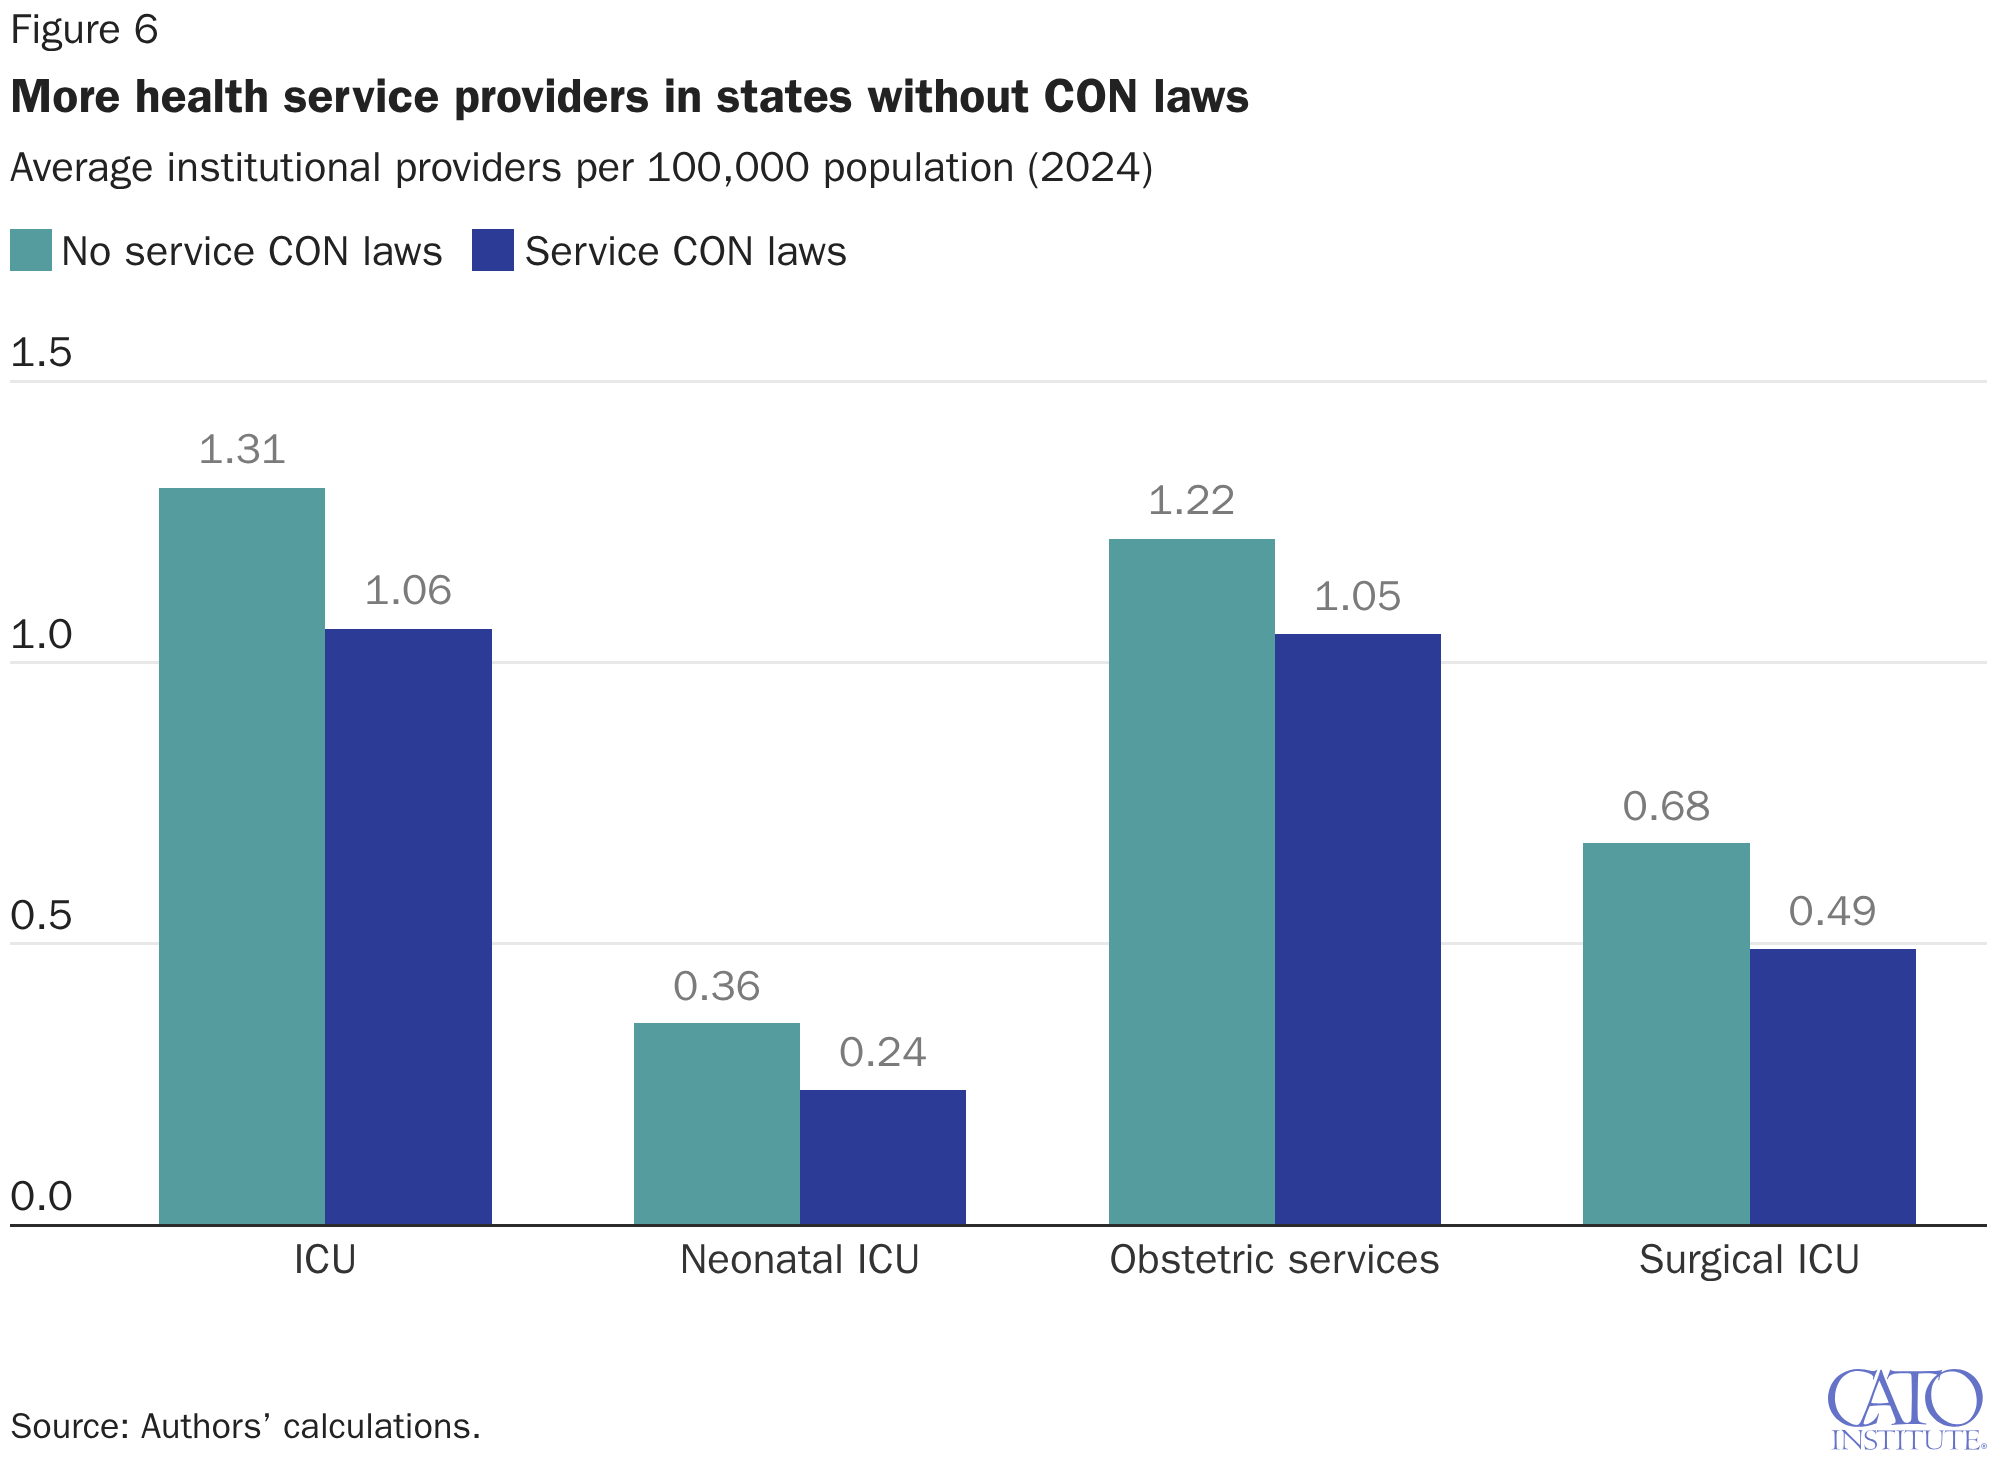
The results are consistent across all four categories. States without service-level CON requirements have about 24 percent more intensive care unit (ICU) capacity per capita, 50 percent more neonatal ICU capacity, 16 percent more obstetric services, and 37 percent more surgical ICU capacity.
Home Health and Hospice
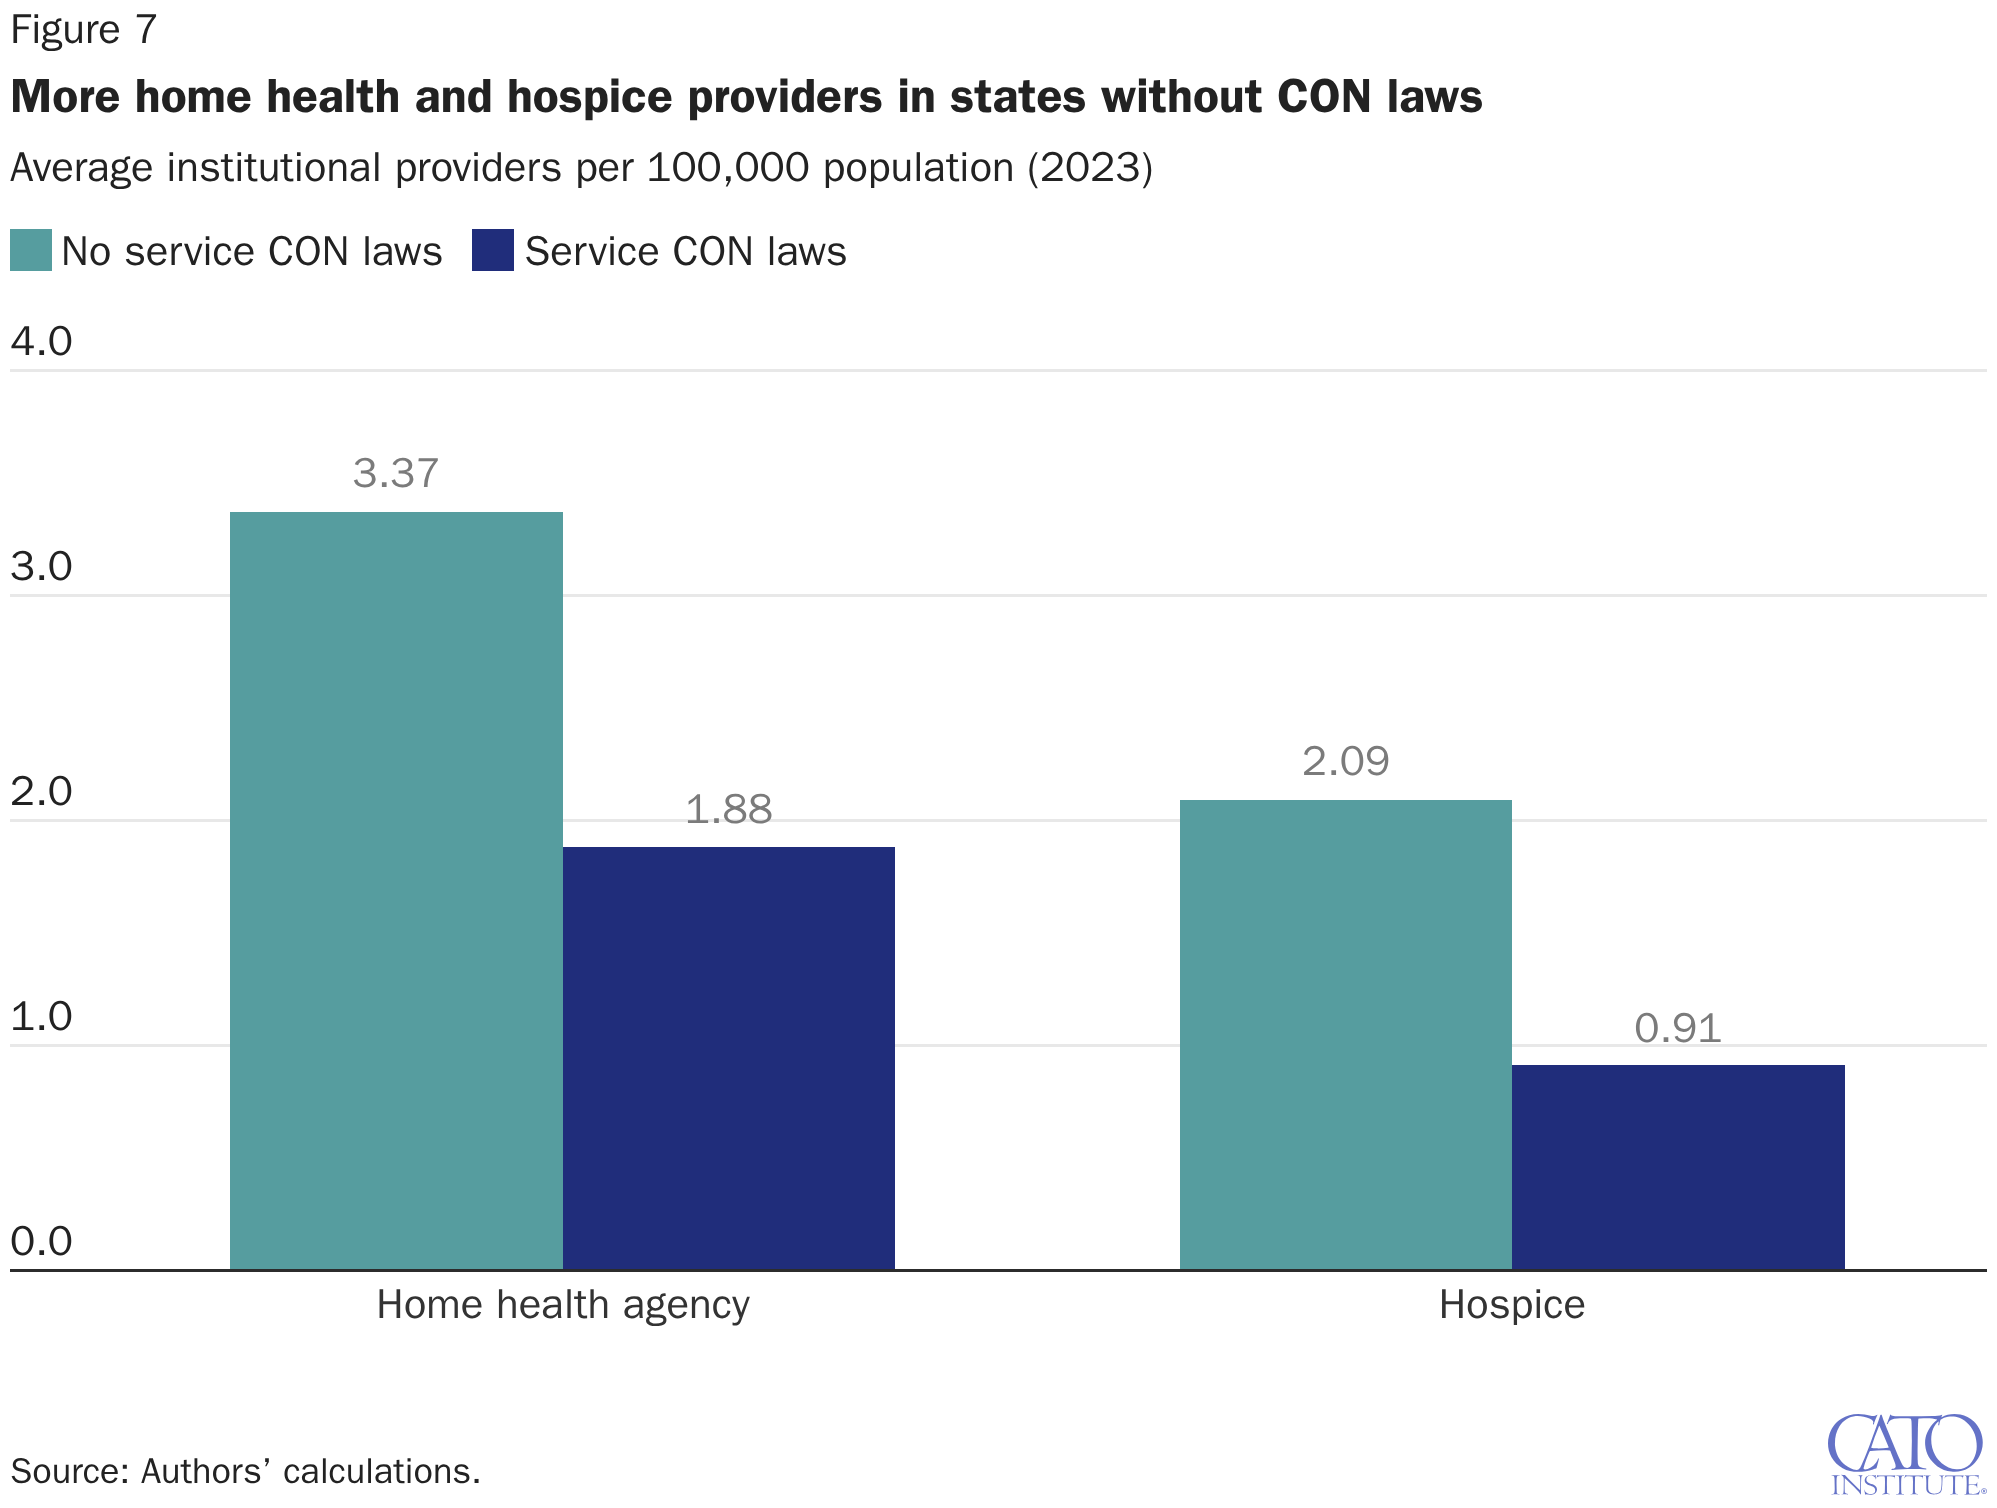
Two of the most striking gaps appear in home health and hospice services—care categories that are critical for elderly patients and those with serious illness. Figure 7 shows that home health agencies in states without a service-level CON requirement average 3.37 active providers per 100,000 people compared to just 1.88 per 100,000 in states with a home health CON—a nearly 80 percent gap.31 Hospice providers show an even larger disparity: States without a hospice CON average 2.09 per 100,000 versus 0.91 in states with one—more than a two-to-one difference.
Diagnostic Imaging: CT Scanners and MRI Machines
The same pattern, depicted in Figure 8, appears in diagnostic imaging.32 Both CT scanners and MRI machines are among the most commonly CON-regulated technologies, and both show substantial gaps in availability between states that regulate them and states that do not.
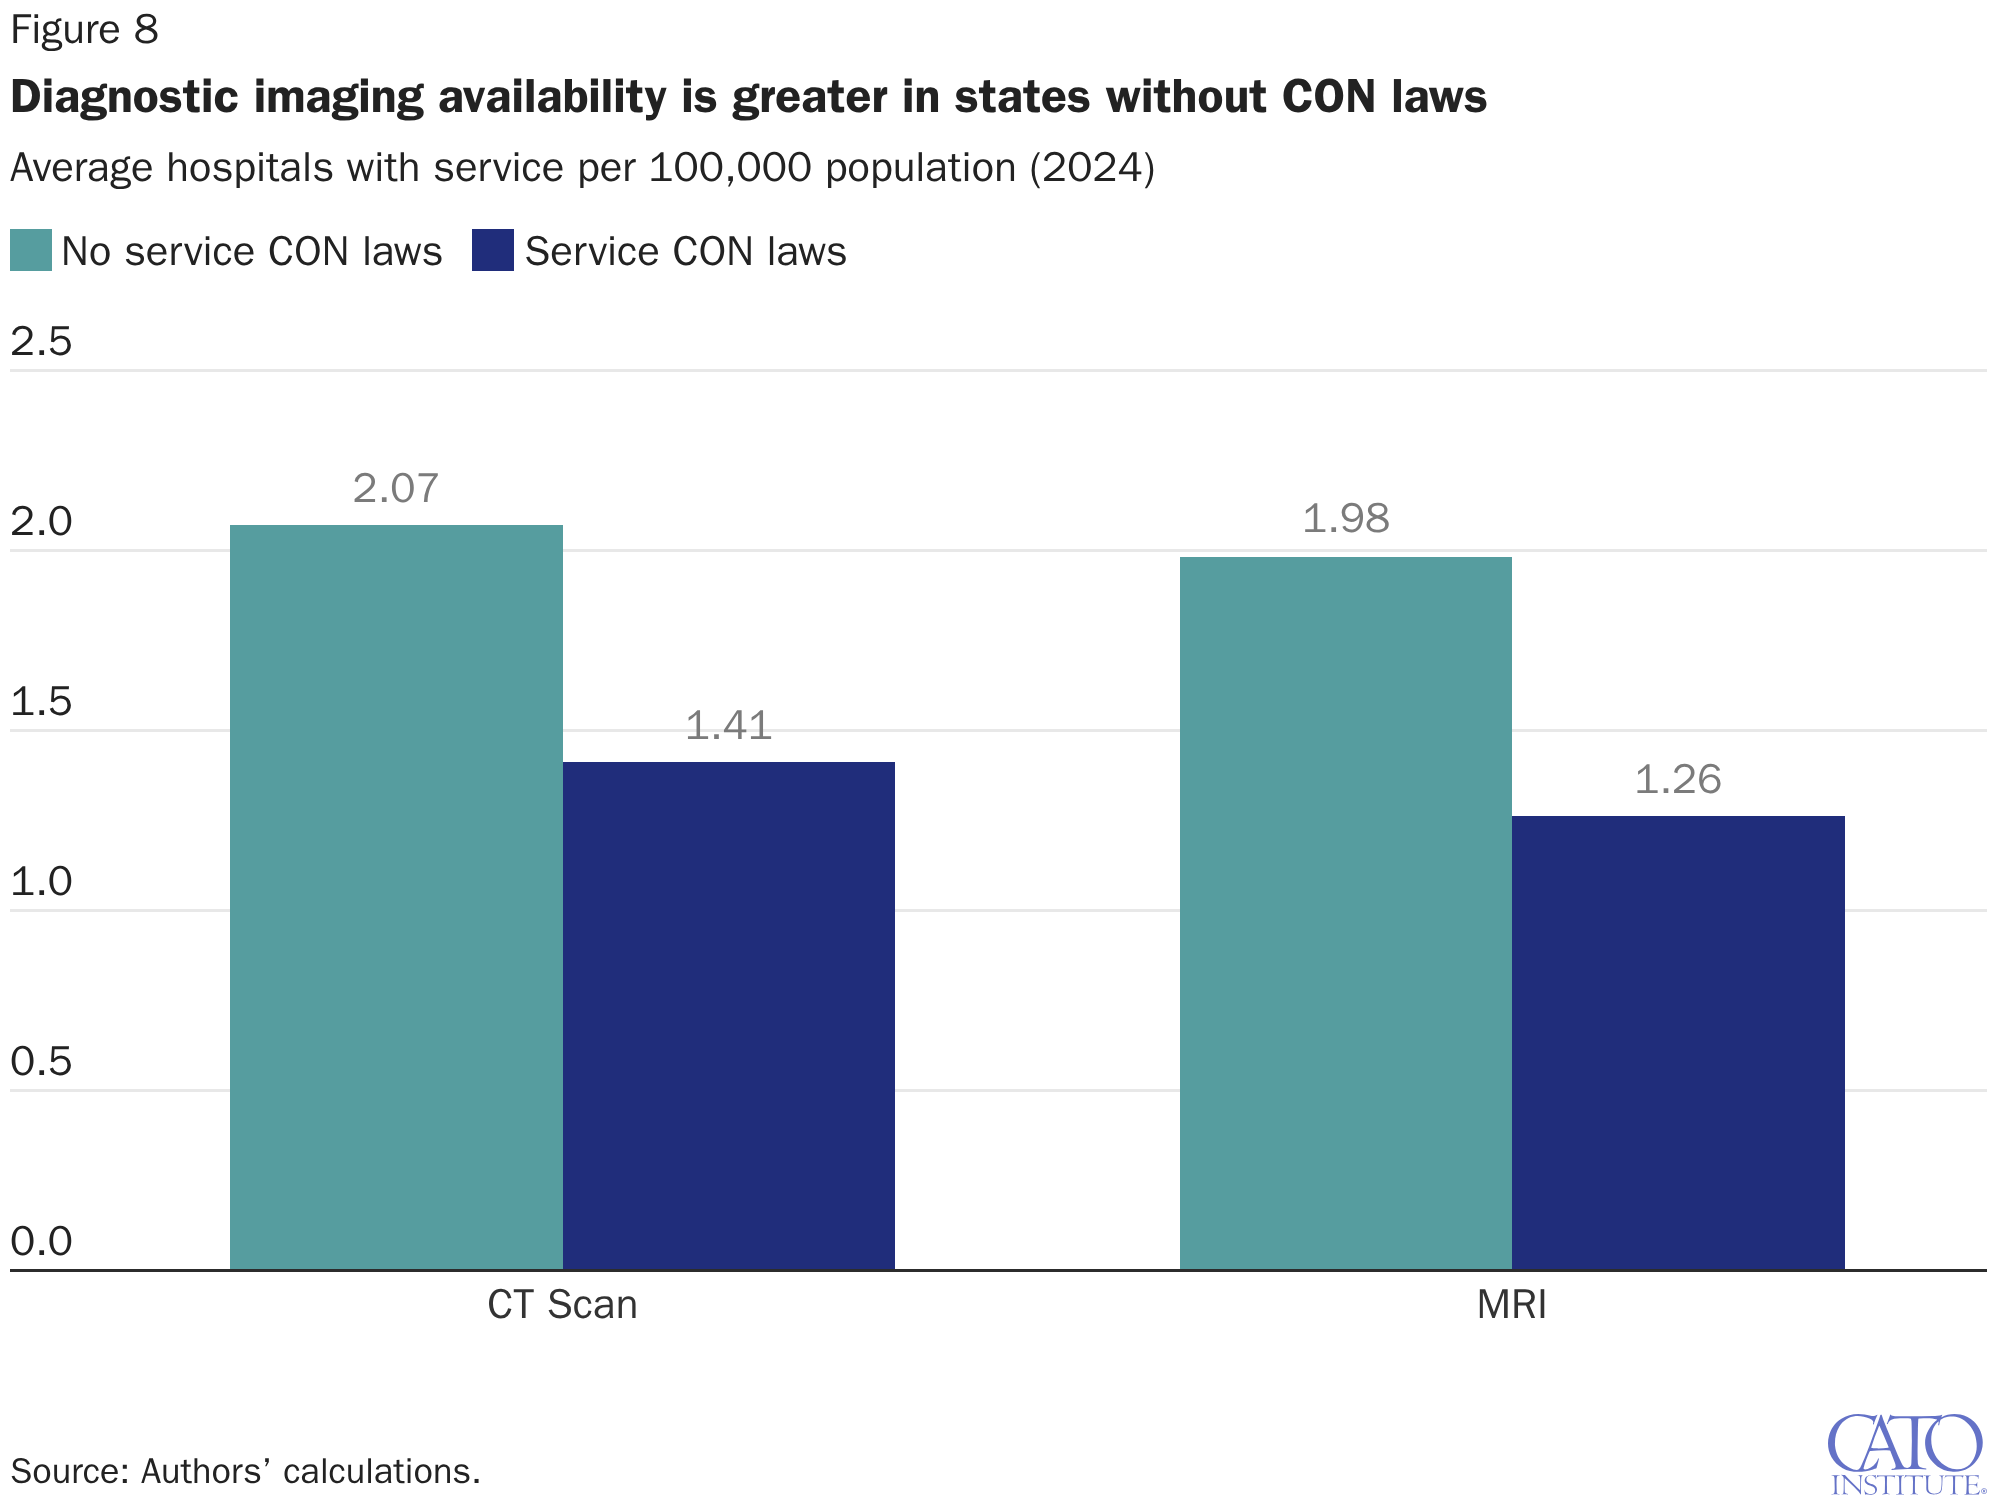
States without a CT scanner CON average 2.07 hospitals with CT capability per 100,000 people versus 1.41 in states with a CT CON—a 47 percent gap. The MRI gap is even wider: States without an MRI CON average 1.98 hospitals with MRI services per 100,000 compared to 1.26 in states with an MRI CON—a 57 percent gap.
Conclusion
By now, economists and health care experts have conducted hundreds of peer-reviewed assessments of CON laws. The overwhelming weight of evidence suggests that the rules limit access, undermine quality, and raise the cost of care, demonstrating what standard economic theory predicts. These rules do not protect patients or payors; instead, they protect incumbent providers from competition, limiting patient access to higher-quality, lower-cost care. Reform of CON laws—including outright elimination of them—should be foremost on the mind of state policymakers seeking to expand health care access and encourage the affordability of vital health services.

About the Authors


This work is licensed under a Creative Commons Attribution-NonCommercial-ShareAlike 4.0 International License.