There is large empirical economics literature that attempts to causally explain how different cultural traits affect economic output. The most import trait in the culture literature is generalized trust, which is “the subjective probability with which an agent assesses that another agent or group of agents will perform a particular action.” In a forthcoming paper, we argue that the trust literature is not worthy of your trust as it is beset by serious data and methodological problem that undermine its core results.
This post takes a different approach. Here, we want to see whether an immigrant-induced cultural difference on the Public Use Microdata Area (PUMA) level is related to earned income. Our idea is based on a figure from the congestion parameter in a wonderful recent paper by Michael Clemens and Lant Pritchett. The cultural difference measure comes from the Western Educated Industrialized Rich Democratic (WEIRD) scale, which measures how culturally different native-born Americans are from people in different countries based on their answers to 80 different World Values Survey (WVS) questions on morality, religion politics, social expectations, ingroup and outgroup attitudes, and child-rearing philosophies. The higher the score is on the WEIRD scale, the more culturally distant the respondents are from native-born Americans. For instance, Canadians have a cultural difference of 2.5 while Egyptians score a 24 (we adjusted the WEIRD Index to a 0 to 100 scale instead of their original 0 to 1 scale).[1] Native-born Americans have a cultural difference of zero because they are not culturally different from native-born Americans.
We calculated the WEIRD scale measure for each PUMA as a population average based on the country of origin for the population. To construct this measure, we calculated the weighted average WEIRD score based on respondents from the ACS microdata for each PUMA. PUMA respondents who are from a country not included in the WEIRD scale are dropped from the sample entirely to remove the most severe issues with sample-selection bias. The WEIRD scale only compares the cultural difference between native-born Americans and citizens of 75 other countries, where the majority of immigrants in the United States came from during the 2013–2017 period. The earned income data come from the American Community Survey for those years.
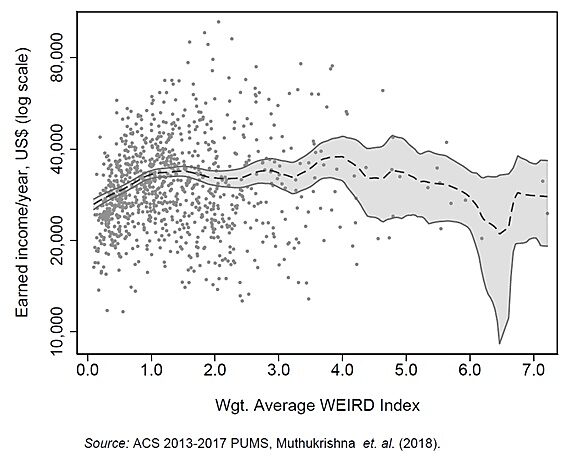
Figure 1 establishes the simple relationship between logged income per capita in each PUMA and how culturally different the population of that PUMA is compared to native-born Americans. The shaded area in Figure 1 is the 95 percent confidence interval (CI). It shows a tight positive relationship between a PUMA’s cultural difference and income at the lower levels of the WEIRD scale. The 95 percent CI widens significantly in PUMAs with greater cultural difference and becomes difficult to interpret as there are fewer PUMAs where local culture was significantly different due to immigration. However, it is clear that immigration-induced cultural differences on the PUMA level are not correlated with lower income.
Figure 1
WEIRD Scale of Cultural Difference and Earned Income
The WEIRD scale has many of the data weaknesses that hobble the trust literature, including its reliance on the WVS, so it merely suggestively estimates the relationship between immigrant cultural distance from native-born Americans and income on the PUMA level. Figure 1 is not a causal relationship, by any means, but it does not show problems except when the CI is so vast as to be virtually meaningless based on a single PUMA data point with a WEIRD score of slightly over 6.
[1] We adjusted the WEIRD Index to a zero to 100 scale from their original 0 to 1 scale for ease of interpretation.

