In the wake of the 2020 election, some Republicans took heart in the apparent shift of some Hispanic voters toward Trump relative to 2016. As I wrote elsewhere, the size of this shift is probably not large (bad exit poll data obscures this) and it still resulted in less Hispanic support than was earned by George W. Bush in 2004. Ethnic attrition also makes it difficult to judge the ethnic and racial support for presidential candidates as the descendants of immigrants, especially if born to an inter-ethnic or inter-racial couple, are much less likely to self-identify as Hispanic, Asian, or with other racial or ethnic origins. Thus, Trump’s support among second, third, or higher generation Hispanics could be even higher than the ethnic responses to exit polls suggest.
Another way of looking at the shift in support for Trump is to examine county level voting outcomes. Trump did win some counties in the Rio Grande Valley of Texas that he would not have won without a significant shift in the Hispanic vote in his direction. But Hispanics are only part of the immigrant population in the United States and, surprising to many, the majority of Hispanics living here are not immigrants, but native-born Americans. We should therefore expect that, over time, nativist policies and talking points would negatively affect Hispanic voters less and less as they and their descendants more fully assimilate into American culture and think of themselves primarily as patriotic Americans. There are also many immigrants from Asian, Africa, and Europe who were also affected by Trump’s immigration policies who get lost in the discussion over Hispanic voting patterns.
This blog post looks at the change in the county level vote share for President Trump from 2016 to the 2020 election, with a particular focus on the share of the county population who are naturalized citizens in all counties in the United States. Naturalized citizens are immigrants who have become American citizens and who can therefore vote in American elections. To the extent that immigrants would or could directly affect American elections, naturalized citizens are the voters who would do so. The 2020 county level election results data come from Fox News, the 2016 election results come from the MIT Election Data Lab, and the demographic data are from the 2014–2018 ACS 5‑year estimates.
Figure 1 shows the relationship between the 2016 and 2020 vote share for Trump on the county level. The 2016 and 2020 Trump vote share is correlated with a coefficient of +0.96 that is significant at the 1 percent level. In other words, a county’s vote share for Trump in 2016 is highly correlated to a statistically significant extent with the county’s vote share for Trump in 2020. Data points further to the right of the dashed line show more of a shift toward Trump, data points to the left show more of a shift toward the Democrats. It’s also important to realize that this shows a shift in the share of the vote, so although it looks like the shift for counties toward Trump was very large, those shifts were in some smaller population counties and obscure the overall shift toward Biden. For instance, the biggest county level vote share shift was in Graham County, Arizona where Trump’s vote share increased from 40 percent in 2016 to 72 percent in 2020. But Graham County is small, with a population slightly under 38,000 in our sample, so large shifts in small counties didn’t make the difference state-wide in Arizona. So far, Figure 1 is not surprising.
Figure 1
County Level Vote Shares for President Trump, 2016 and 2020
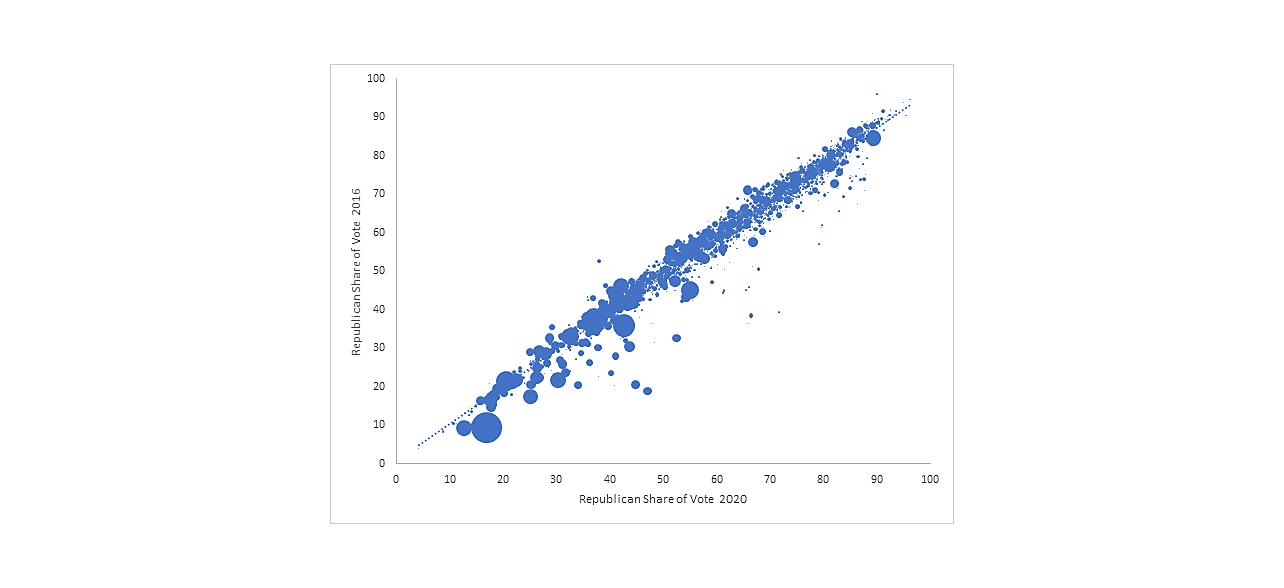
Sources: Fox News, MIT, American Community Survey.
Figure 2 shows the relationship between the shift toward Trump from 2016 to 2020 and the naturalized immigrant share of a county’s population. The correlation coefficient is a statistically insignificant ‑0.038. In other words, there was no meaningful shift in the county-level immigrant citizen vote share. Trump did neither worse nor better than he did in 2016. Interestingly, this statistically insignificant results can be entirely explained by Miami-Dade County, Florida. Excluding Miami-Dade County from the regression shows that counties with more naturalized citizens were more likely to be less supporting of him in 2020 everywhere else in the country with a correlation coefficient of ‑0.067 that is significant at the 5 percent level. Without the naturalized American voters in Miami-Dade county, who account for 30 percent of that county’s population, counties with new Americans would have been more likely to vote against Trump in 2020 than they did in 2016.
Figure 2
Naturalized Share of the Population and Vote Share Shift Toward Trump
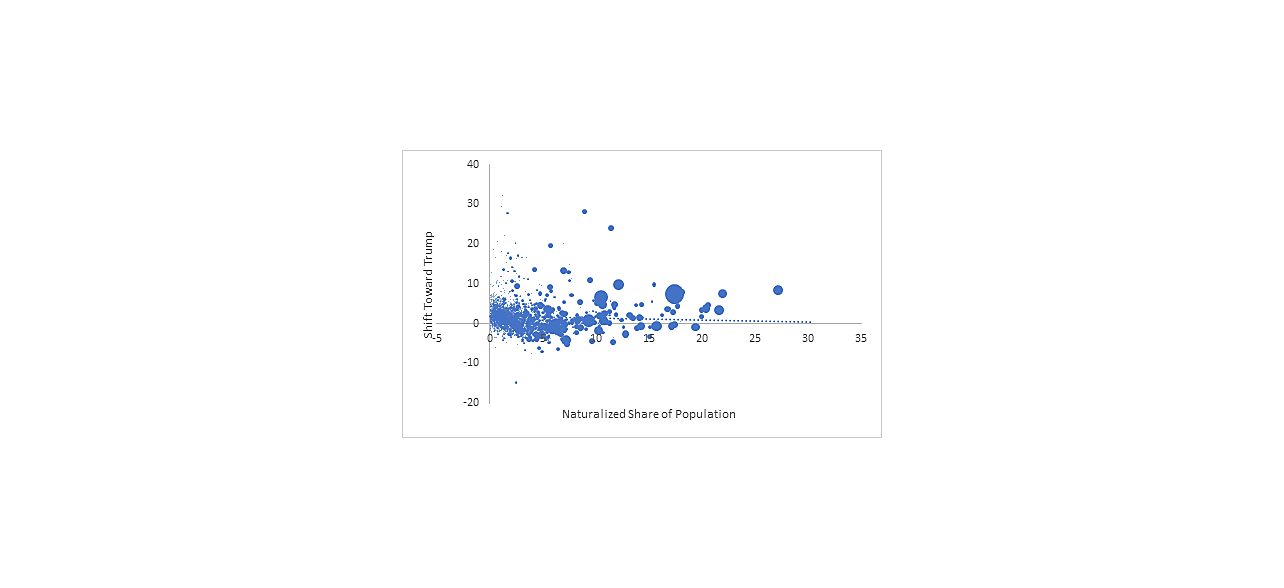
Sources: Fox News, MIT, American Community Survey.
The naturalized immigrant population in the entire country is just over 7 percent. Looking entirely at the 121 counties where the naturalized immigrant share of the population is at or above the nationwide level shows that they shifted slightly toward Trump in 2020, to 39 percent up from 37 percent in 2016 (Figure 3).
Figure 3
County Level Vote Shares for President Trump in Counties with High Naturalized Immigrant Population Shares, 2016 and 2020
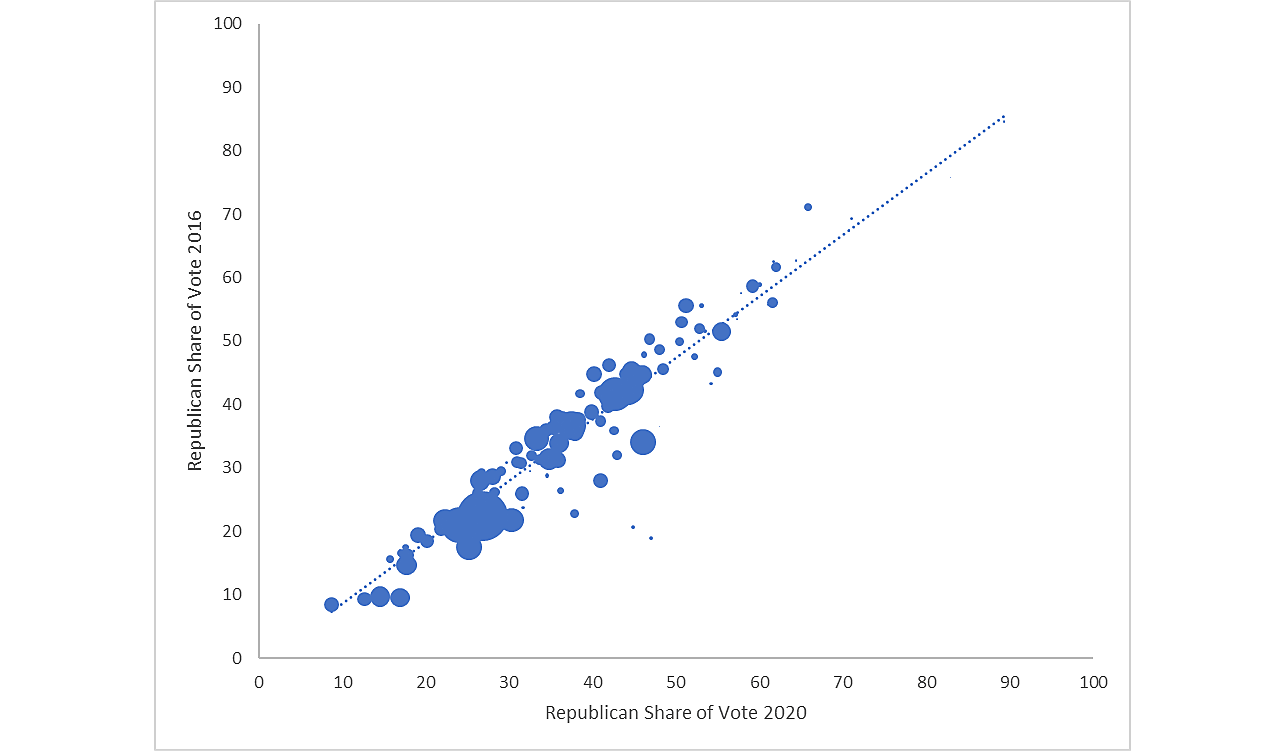
Sources: Fox News, MIT, American Community Survey.
There are a few lessons here. First, counties that voted for a candidate in one year are likely to vote for that candidate the next year and to a similar extent. No surprise there. Second, counties with naturalized American citizens didn’t become more anti-Trump if Miami-Dade is included. Third, the big shift toward Trump in Miami masks the nationwide shift against Trump in counties with more naturalized Americans. Excluding Miami-Dade County shows a general shift against Trump in counties with more naturalized Americans that is significant at the 5 percent level.
Caution is always warranted in interpreting county-level electoral results like these, so please don’t confuse this analysis with one that uses microdata, but it sure looks like the anti-socialist naturalized American voters in Miami-Dade voted differently in 2020 than other naturalized Americans. They lived in a county that still voted for Biden but that swung hard toward Trump by over 12 points.
