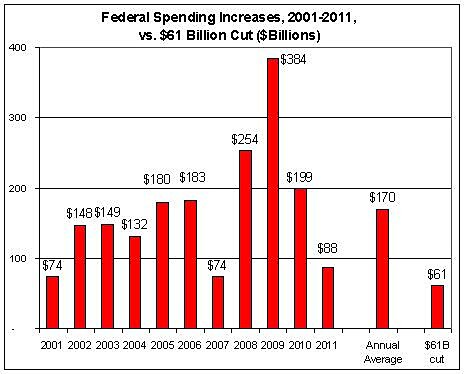
Republicans and Democrats are currently battling over $61 billion, or less, in federal spending cuts for the remainder of the current fiscal year. The chart below puts that figure in perspective. It shows the annual increases in total federal outlays each year over the last decade.
The average annual increase in federal spending over the last decade was a huge $170 billion, which is almost three times larger than the proposed $61 billion cut. In 2009, federal spending leaped $384 billion in a single year, or six times more than this year’s relatively tiny cut.
(The data are from the CBO. I’ve taken TARP spending per CBO out of the figures for 2009–2011 because it distorts the actual spending path. In particular, 2009 outlays included $151 billion in TARP, but outlays in 2010 and 2011 reversed out $135 billion of that, because the program ended up costing much less than originally expected.)

