Chairman Whitehouse, Ranking Member Grassley, and Members of the Committee: Thank you for inviting me to testify today. The views I express in this testimony are my own and should not be construed as representing any official position of the Cato Institute.
I will make three main points in my remarks.
First, the 2017 Tax Cuts and Jobs Act (TCJA) was a success. It put money back in Americans’ pockets and supported the long climb out of the great recession.
Second, the U.S. federal budget deficit is not primarily caused by tax cuts. Instead, unsustainable spending explains current and future deficits.
Third, the topic of this hearing is about the appropriate size and scope of government—a topic on which reasonable people can disagree. However, if Congress decides that current spending programs do not need to be curtailed, it should also be honest with the American people. Big government is expensive and will require significantly higher taxes on everyone, not just the rich.
The Tax Cuts and Jobs Act1
The 2017 TCJA was more than just a tax cut; it was the most significant reform to the U.S. tax code in 30 years—since the Reagan-era 1986 tax reform. In addition to cutting individual and corporate tax rates, the reforms made it easier for millions of Americans to pay their taxes, simplified family benefits, and overhauled the international tax system, among many other reforms. As a result, the law increased the share of taxes paid by higher-income taxpayers and successfully boosted economic growth, investment, and wages.
Some of the most significant changes in the law included:
- Lower individual income tax rates and thresholds. More than nine out of 10 taxpayers received a tax cut or saw no change in their tax bill. According to the Tax Policy Center, only 4.8 percent of taxpayers were projected to see a tax increase, and more than 80 percent of taxpayers benefited from a tax cut.2
- Nearly doubled standard deductions of $12,000 for single filers, $24,000 for married couples filing jointly, and $18,000 for head of household filers in 2018. Doubling the standard deduction and curtailing the value of some itemized deductions moved more than 29 million taxpayers from the more complicated itemized system to the standard deduction.3
- New $10,000 cap on the state and local tax (SALT) deduction and a $250,000 reduction (to $750,000) to the cap on the mortgage interest deduction for new mortgages. The phase-out of itemized deductions (Pease limitation) and other smaller itemized deductions are eliminated.
- Doubled child tax credit to $2,000. The phase-out threshold for the tax credit for married joint filers increased from $110,000 to $400,000. The refundable portion of the credit increased from $1,000 to $1,400. Added a new $500 non-child dependent credit and repealed personal and dependent exemptions.
- Increased the individual alternative minimum tax (AMT) exemption from $86,200 to $109,400 for married filers. In 2018, the new exemption phased out starting at $1 million, up from $164,100.
- Lowered the federal corporate income tax rate to 21 percent, down from 35 percent.
- Expanded full expensing for business investments with asset-class lives of 20 years or fewer.
- Added a new 20 percent deduction for certain non-salary pass-through business income. The deduction phases out for certain service providers with incomes that exceed $157,500 for single filers and $315,000 for married couples filing jointly.
- Repealed the domestic production activities deduction, repealed the corporate AMT, and overhauled the international tax rules.
The TCJA Cut Taxes for Most Americans
Only 17 percent of Americans surveyed in a 2019 NBC News/Wall Street Journal poll thought their taxes would go down because of the TCJA.4 After more than a year of misleading reporting about the tax reform, The New York Times admitted in a 2019 headline, “Face It: You (Probably) Got a Tax Cut.”5
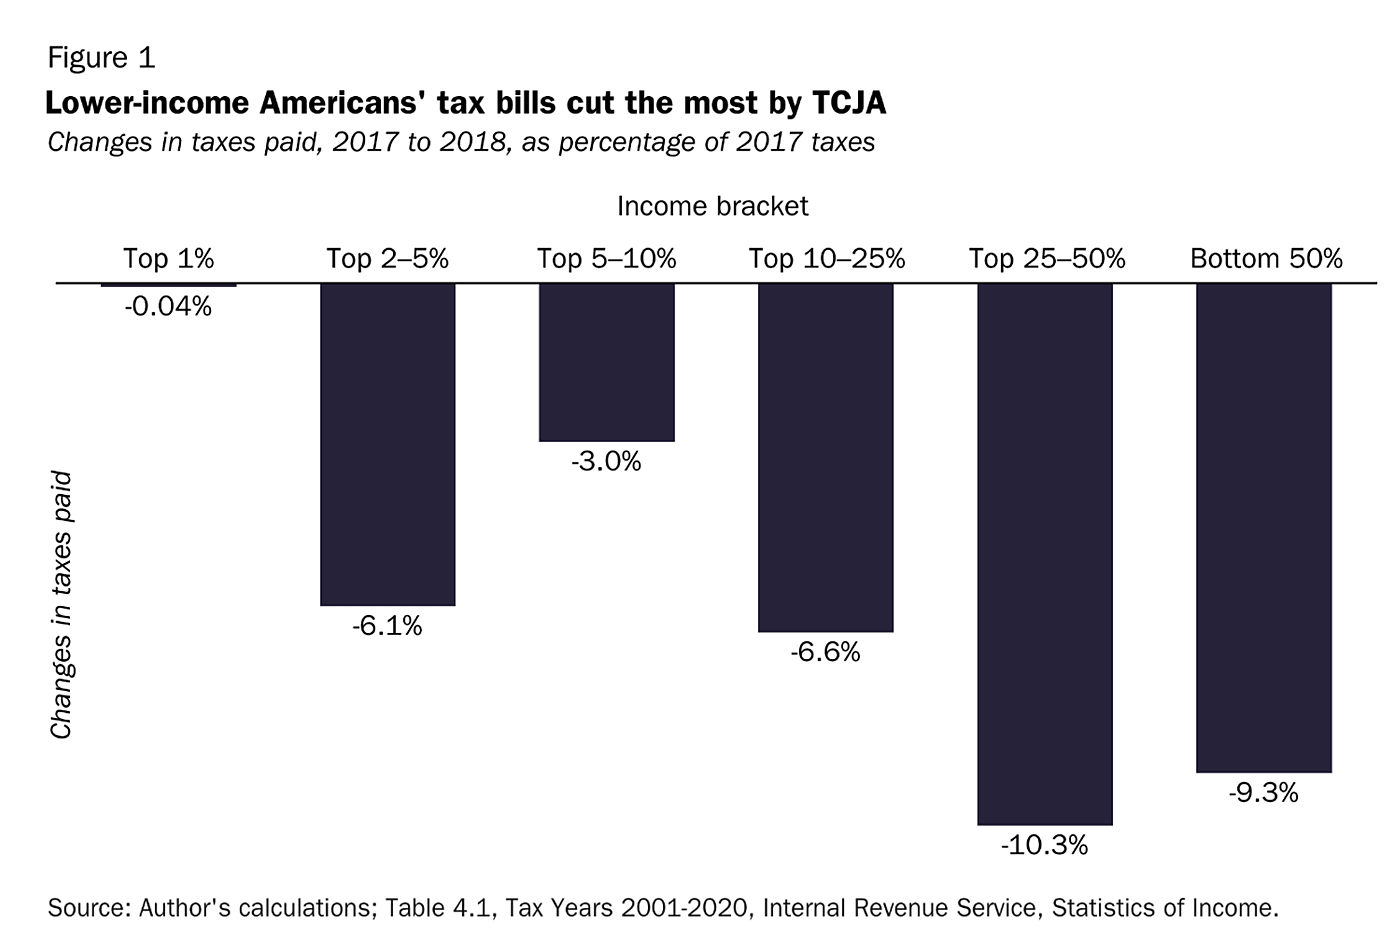
IRS data from tax years 2017 and 2018 in Figure 1 shows that the average change in taxes paid as a percentage of taxes paid in 2017 was largest for the lowest-income Americans and smallest for the top 1 percent, measured by adjusted gross income (AGI). The lowest income 50 percent of Americans benefited from a 9.3 percent reduction in their tax bill. The highest income 1 percent of taxpayers saw just a 0.04 percent tax cut. After 2017, higher-income taxpayers now pay a larger share of all taxes. By this metric, the income tax system was made more progressive. The top 1 percent of taxpayers paid 40 percent of income taxes in 2018 and 38 percent in 2017.
The Joint Committee on Taxation (JCT) distributional tables from 2017 tell a similar story. In calendar year 2019, taxpayers making between $20,000 and $50,000 were estimated to see the largest tax cuts, between 10.0 percent and 13.5 percent.6 In the same year, 76.6 percent of the dollar value of the tax cut went to people making less than $500,000 a year. Similarly, of the total $1.5 trillion tax cut, 77.4 percent ($1.1 trillion) of the ten-year revenue reduction was for individual taxpayers.7 Businesses received a $329 billion tax cut, but even these changes benefited workers because labor bears between 75 percent and 100 percent of the corporate tax’s revenue cost.8
Critics of the law claim the opposite; they claim that the TCJA was a regressive change that primarily cut taxes for the wealthy and large corporations. They point out that the dollar value of the tax cut per taxpayer and the tax cut measured as the change in after-tax income skewed toward higher-income taxpayers. This is simply a mathematical fact of reforms that cut marginal tax rates for all income groups in an already highly progressive tax system. For example, in 2017, the lowest-income half of taxpayers paid, on average, just 3.1 percent of all income taxes. Without using the tax code to increase transfers, it is impossible to significantly cut the dollar value of taxes for people who pay very little or are already net beneficiaries of the tax code.
The latest IRS data show that in 2020, the top 1 percent of income earners—those earning more than $550,000—earned 22.2 percent of all U.S. adjusted gross income while paying 42.3 percent of all federal income taxes. The top 10 percent earned 49.5 percent of all income and paid 73.7 percent of all federal income taxes. Those who pay the most taxes and pay the highest effective tax rates will also see commensurate benefits when rates are lowered. This does not mean that middle-class Americans were left out of the reforms.
Rolling the tax code back to pre-2017 would mean higher taxes on basically every American family. President Joe Biden recognizes this fact in his 2024 budget proposal by saying he “will work with the Congress to address the 2025 expirations [of the 2017 tax cuts,]…opposes increasing taxes on people earning less than $400,000 and supports cutting taxes for working people and families with children to give them more breathing room.”9
Tax Cuts and Economic Growth
In addition to the individual tax changes, the 2017 tax cut was intended to boost business investment and support the long-running post-financial-crisis economic expansion. The primary permanent component of the law is the 21 percent corporate income tax rate, lowering it from 35 percent, one of the world’s highest corporate income tax rates.10 The lower rate was paired with business expensing to allow businesses to write off the full cost of investments through the end of 2022 (2021 for R&D expenses). Unfortunately, losing the full investment deduction during a time of high inflation will significantly increase the cost of new investments in the years to come.11
Expensing and lower business tax rates are the primary drivers of projected increases in economic growth following the 2017 reforms. In a neoclassical model of the economy, the amount of labor (workers) and capital (tools, equipment, and buildings) determine the gross domestic product (GDP) or the size of the economy. Tax cuts are generally modeled as increasing the capital stock by lowering effective tax rates on investments and increasing labor supply by lowering marginal income tax rates. More capital and more total hours worked mean more GDP.
Permanent changes in the tax code only temporarily increase the rate of growth of new investments, which increases the growth rate of GDP. Once a new “steady state” for the economy is reached, it returns to its previous trend but at a higher level. This model predicts that tax cuts will temporarily increase growth rates for capital investment and output, leaving a permanently larger capital stock and economy.
The additional investment allows workers to be more productive by working with more tools and more efficient tools. As worker productivity increases, wages rise to compensate for the additional output per hour of work. Although this is generally modeled as a longer-run effect, forward-looking businesses can revise their labor market expectations and accelerate benefits to labor. Especially in a tight labor market, earnings growth should be realized more quickly as companies compete for scarce talent and workers exercise bargaining power to capture productivity increases.
Using different versions of this model, a diverse and bipartisan group of researchers estimated that the TCJA would increase the country’s capital stock and boost GDP by between 0.7 percent and 1.7 percent. The estimates vary in magnitude depending on the model’s specific assumptions and how the results are presented, but almost all agreed that the reform would produce positive changes in investment and GDP.
- The Congressional Budget Office (CBO) concluded that the “changes are expected to encourage saving, investment, and work.” And that “in CBO’s projections, the act boosts average annual real GDP by 0.7 percent over the 2018–2028 period.”12
- “According to the Tax Foundation’s Taxes and Growth Model, the plan would significantly lower marginal tax rates and the cost of capital, which would lead to a 1.7 percent increase in GDP over the long term, 1.5 percent higher wages, and an additional 339,000 full-time equivalent jobs.”13
- The Tax Policy Center estimated, “the legislation would boost US gross domestic product (GDP) 0.8 percent in 2018 and would have little effect on GDP in 2027 or 2037.”14
- The Heritage Foundation estimated that “long-run gross domestic product will increase by 1.67 percent over the pre-reform baseline.”15
The Economic Record
The economic record of how the 2017 tax cuts actually affected the economy was contemporaneously confounded by other positive developments, such as federal regulatory reforms, and countervailing changes, such as President Trump’s aggressive and destabilizing anti-trade agenda. Moreover, beginning in the first quarter of 2020, the COVID-19 health and economic crises make any long-run assessment of the policy changes all but impossible.
However, in the immediate aftermath of the 2017 reforms, there were key signs that the tax cuts worked as they were projected. For example, real year-over-year non-residential business fixed investment outpaced CBO projections through 2018 before trade uncertainty rose.16 Other measures of business activity showed similar positive trends in early-2018, such as new manufacturers’ orders of non-defense and non-aircraft capital goods and small business optimism.17
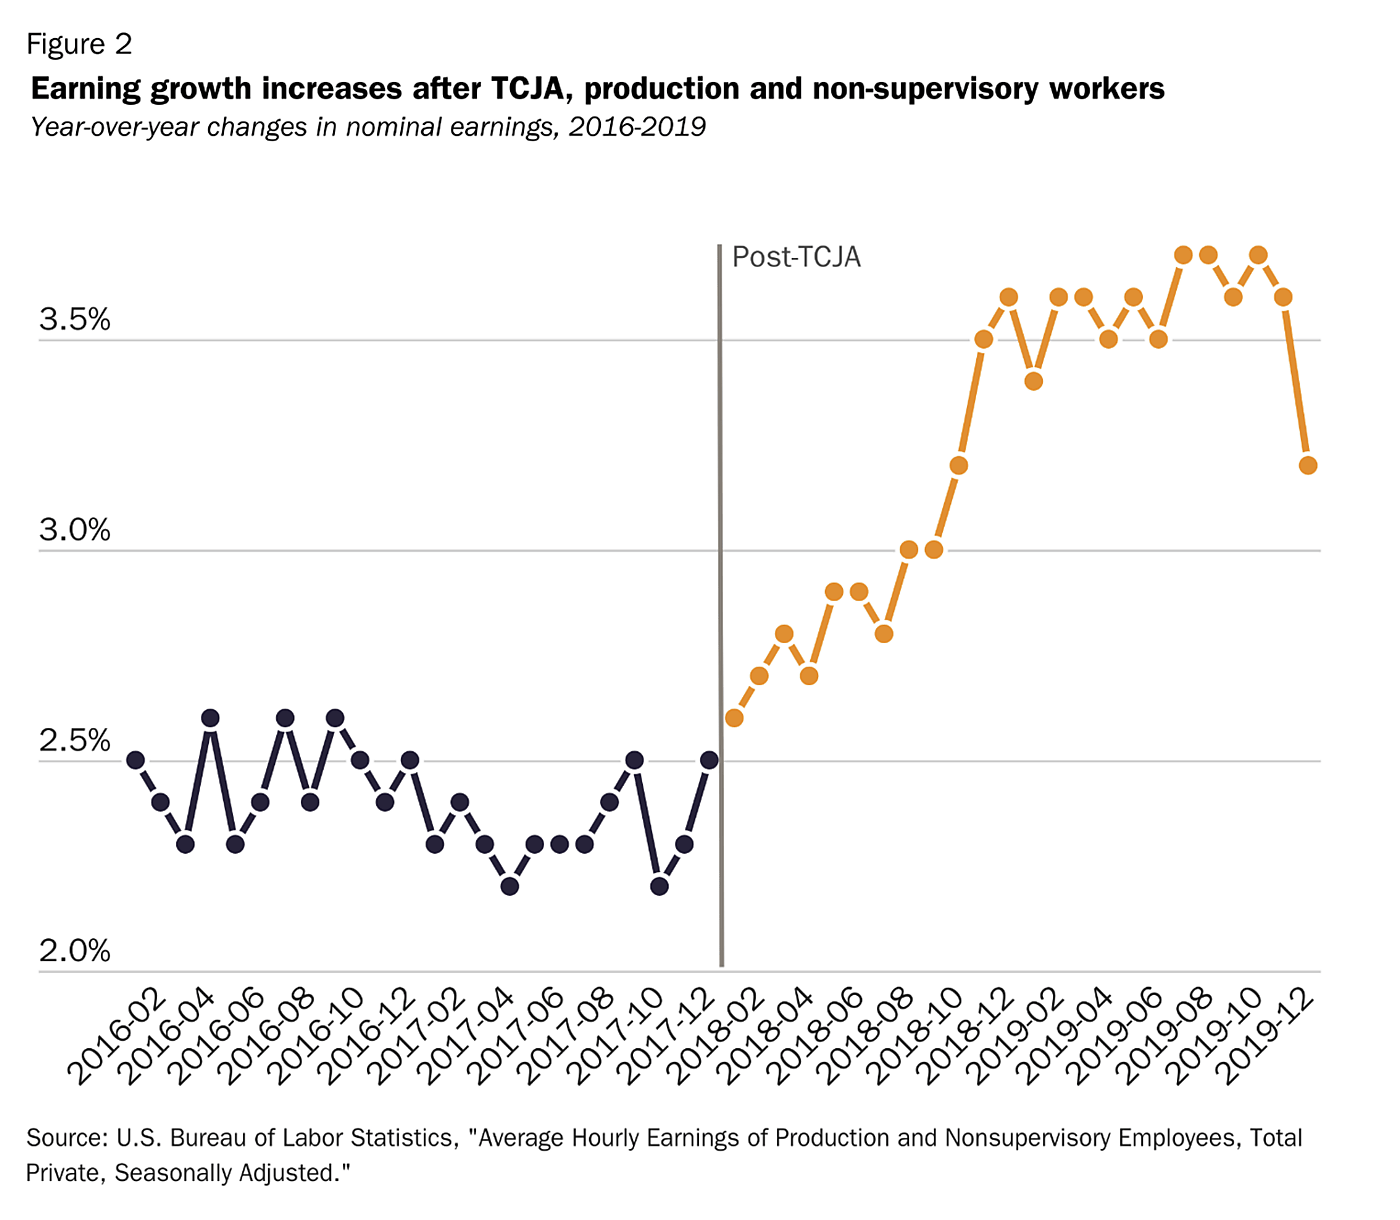
Following the 2017 tax cut, there are also clear indications that the labor market improved considerably. A significant increase in wage growth marked the beginning of 2018. Figure 2 shows that nominal year-over-year average hourly earnings for production and non-supervisory workers declined slightly through 2016 and 2017, averaging 2.4 percent. Following the tax cuts, wage growth for production and nonsupervisory workers increased to 3.7 percent by October 2019. Because of these gains, the average production and nonsupervisory worker received about $1,400 in above-trend annualized earnings in April 2020.
Other measures of income showed similar shifts in trend. Census Bureau data show that real median household income reached an all-time high in 2019, growing by $4,400 (a 6.8 percent year-over-year increase). Between 2017 and 2019, income inequality declined as income growth among lower-income and minority households outpaced other groups.18 There was also a significant and sustained increase in job availability and job mobility after 2017.
In 2018, many businesses shared their tax windfalls with workers through bonuses and other investments. The Economic Report of the President counted more than 645 companies that explicitly announced bonuses or increased retirement contributions due to the 2017 tax cuts, benefiting more than 6 million workers.19 A separate analysis found that firms with the largest expected tax savings were likelier to announce bonuses and increase investment.20
These economic benefits are also supported by a deep academic literature that links tax changes to corresponding changes in GDP, investment, and wages.21 For example, Christina and David Romer estimate that a tax cut equal to 1 percent of GDP increases GDP by more than 3 percent after 2.5 years and increases investment by as much as 11 percent.22 The link between tax increases and slower economic growth is also robust. William McBride concludes, “nearly every empirical study of taxes and economic growth published in a peer reviewed academic journal finds that tax increases harm economic growth.”23 In another literature review, Valerie Ramey shows that a majority of academic estimates indicate that tax increases reduce GDP by two or three times the increase in revenue.24
Is the Deficit Caused by Tax Cuts?
The annual federal budget deficit and the accumulated debt result from Congress spending more than they are willing to raise in taxes. Since the early 2000s, when the U.S. federal government last had a budget surplus, Congress has kept taxes from increasing too far above their historical average level of 17.4 percent of GDP. Unfortunately, Congress has not kept automatic spending increases from mounting. Instead, Congress has added significant new spending on top of automatic increases.
In 2022, federal revenue as a percent of GDP was at a two-decade high, and this year’s revenue as a share of the economy will be a full percentage point above the historical average or 17.4 percent. Figure 3 shows historical and projected revenue and outlays from 1970–2033.25 Over the next decade, revenues will remain above the historical average. Outlays are projected to continue to climb from their current highs.
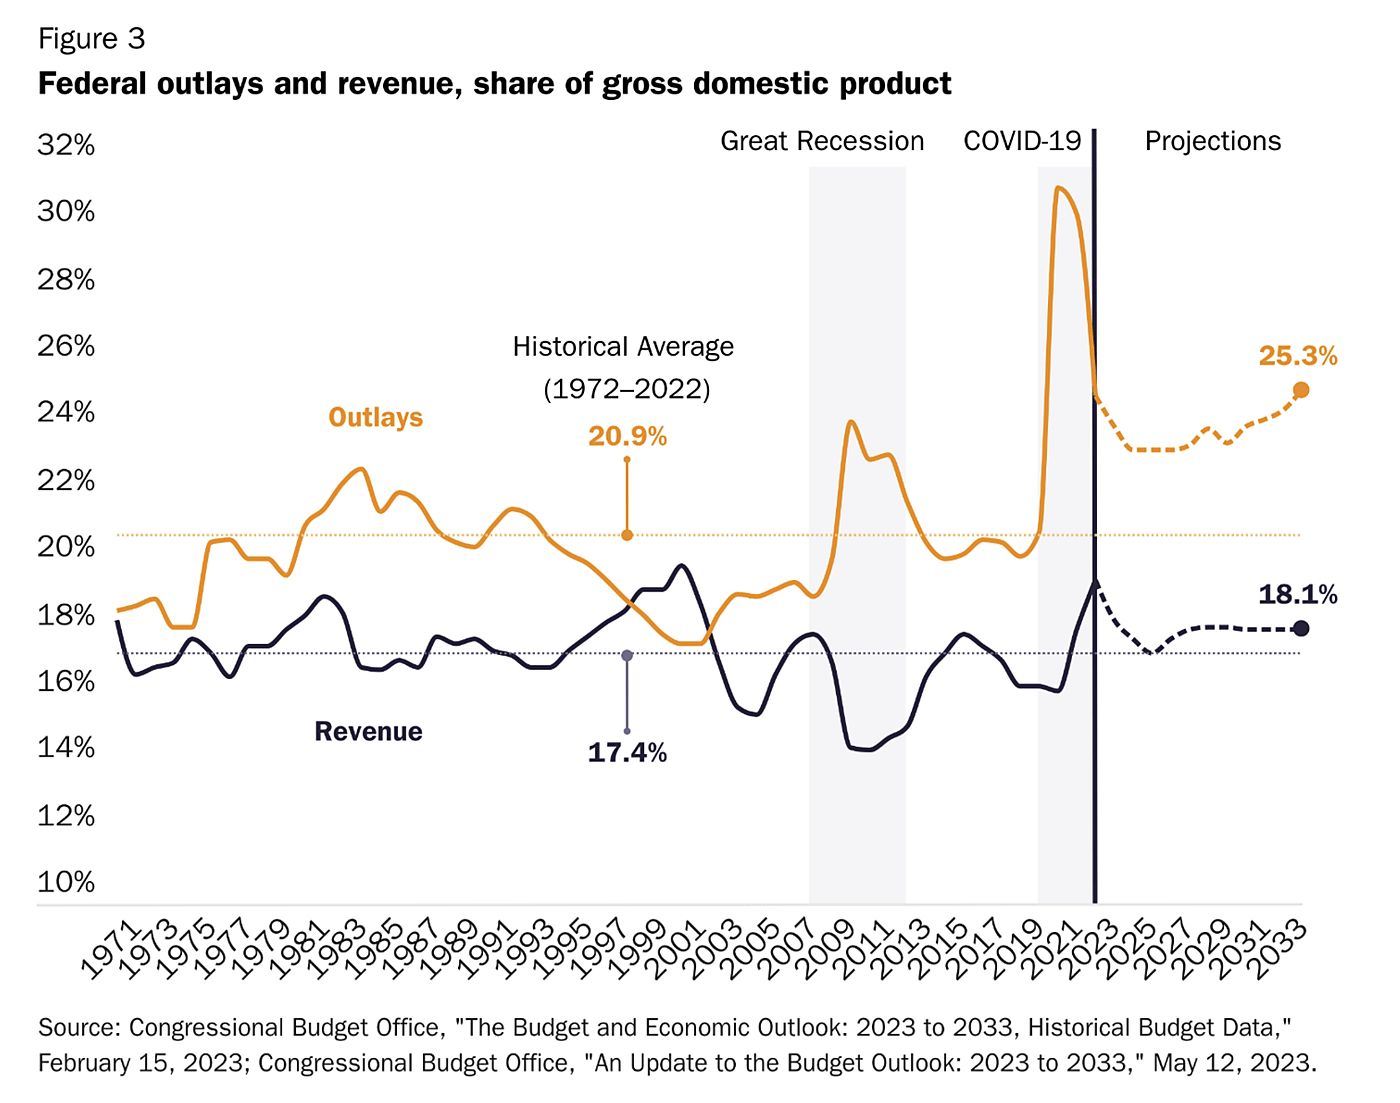
In its longer-term projections, CBO shows that spending and revenues both continue to climb beyond 2033—spending just grows much faster. In the February 2023 long-term budget outlook, CBO projects spending to rise from almost 24 percent of GDP in 2023 to 30 percent of GDP in 2053. Revenues are projected to rise from 18 percent of GDP in 2023 to 19 percent in 2053, well above the pre‐2017 50‐year historical average.26 Over the 30 years, the largest source of additional tax revenue is real bracket creep, accounting for almost 60 percent of the higher revenues in 2052 and twice as much revenue as the expiration of the 2017 tax cuts.27 Health and retirement spending are the primary drivers of spending growth.
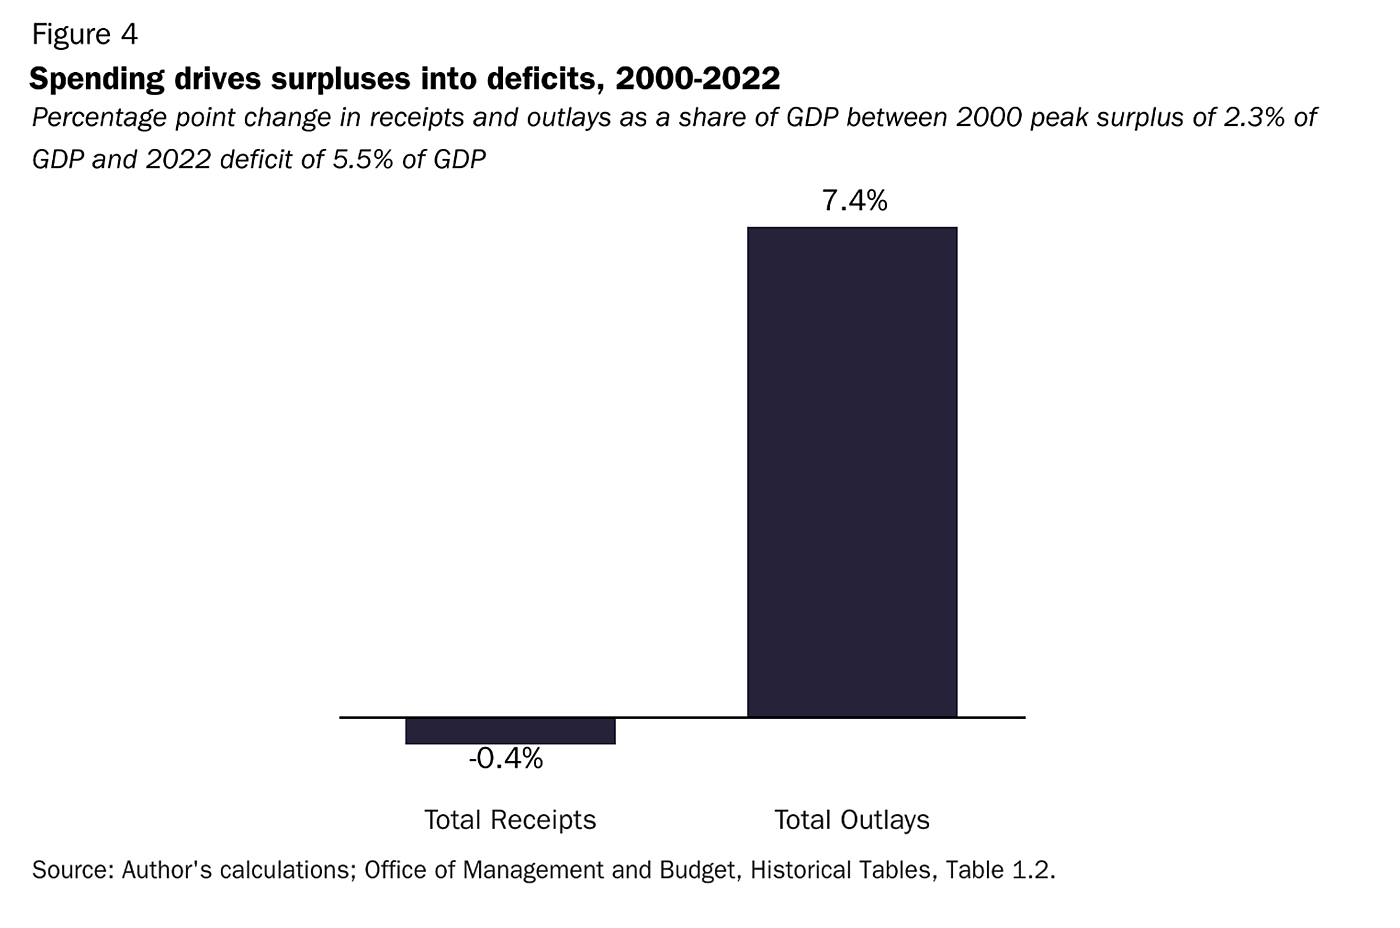
Current data show that if the Treasury collected as much revenue as it did in 2000 when it had a 2.3 percent budget surplus, it would still have a budget deficit of about 5.1 percent of GDP. Between 2000 and 2022, total federal outlays as a percent of GDP increased by 7.4 percentage points, from 17.7 percent to 25.1 percent, according to Office of Management and Budget data.28 Figure 4 shows that total receipts fell by 0.4 percentage points during the same period, from 20.0 percent to 19.6 percent. In 2000, the federal government had a budget surplus of 2.3 percent of GDP; by 2022, the surplus had turned into a deficit of 5.5 percent of GDP.
Deficits and the TCJA
Although the 2017 tax cuts are accounted for in Figure 4, there is still a debate over their impact on the current deficit. The $1.5 trillion reduction in revenue did add to the debt but is not driving the projected unsustainable increases in the deficit.
One way to think about the fiscal cost of the TCJA is that it corrected automatic tax increases by moving the trajectory of large and growing deficits up by between one year and two years. In 2017, CBO projected revenues as a share of the economy would climb to 18.4 percent by 2026 (a full percentage point above the historical average). The first post-2017 CBO baseline showed revenues dipping to 16.5 percent in 2019 and then quickly climbing back to their historical average before the 2026 expiration and automatic tax hike.29 Thus, the tax cuts corrected for projected automatic growth in tax revenues. In June 2017, the CBO projected that the federal government would reach an annual budget deficit of $1 trillion in 2022.30 In April 2018, the CBO projected $1 trillion deficits in 2020. The larger deficit reflected the effects of the tax cuts and the 2018 budget deals, which increased federal spending by more than $500 billion in 2019.31 Combined, higher spending and tax cuts moved large and growing deficits up by about two years.
Another, different way to think of the TCJA’s fiscal cost is that it was a small one-time increase to the debt but not a significant ongoing addition to the deficit. According to a Tax Foundation estimate from 2017, the tax cuts would only reduce revenues temporarily. By 2024, due mainly to additional economic growth, the tax cuts begin to raise more yearly revenue than before the reform.32 However, breaking even in one year does not mean the additional $448 billion in projected new debt will be quickly paid down by a larger economy. If the law is made permanent, there will be additional costs.
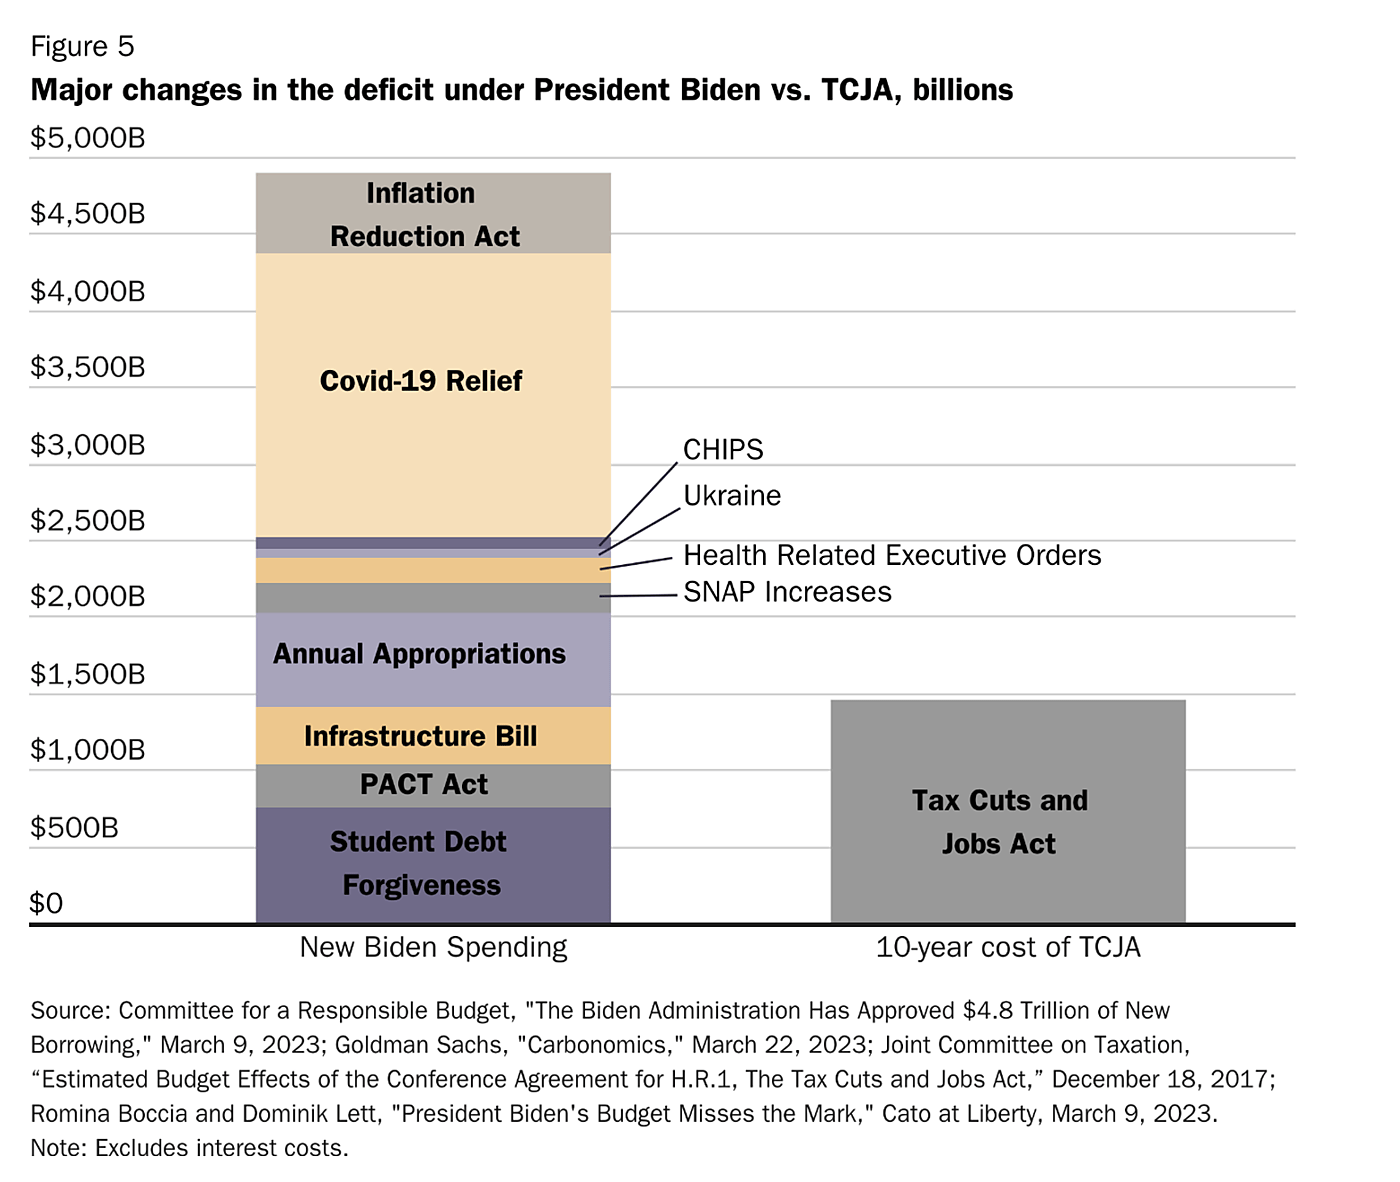
Lastly, it is helpful to put the size of the TCJA’s revenue reduction in the context of current fiscal challenges. For example, next year’s projected one-year deficit of $1.5 trillion will be larger than the ten-year revenue reduction of the TCJA. Similarly, Figure 5 shows that President Biden has added more than $4.9 trillion in new projected borrowing, more than three times the 10-year revenue reduction of the TCJA.33
If you think that the government is not entitled to confiscate an automatically increasing share of private resources and the money people earn is, by default, theirs and not the state’s, then the federal deficit must be caused by rapidly increasing spending and not the lack of slightly less rapidly increasing tax revenue.
Spending is the Real Tax Rate
Blaming deficits and debt on tax cuts is simply a proxy argument over the appropriate size of the government. Should the government control almost half of all private resources, with an economy-wide tax rate of 45 percent or higher, as in France and Denmark? Or should we aim to constrain government spending, leaving more resources in the hands of individual citizens? The United States is a low-tax country compared to similar countries around the world. In 2021, the United States collected about 26.6 percent of GDP in taxes across all levels of government. The Organisation for Economic Co-operation and Development (OECD) average is 34.3 percent.
As Milton Friedman observed, spending is the true tax rate.34 So, if Congress wants to keep the United States a relatively low-tax country, spending will need to come down to meet revenues. On the other hand, if Congress decides that our current spending levels and projected spending increases are appropriate, taxes will eventually need to increase to match spending levels.
Low taxes benefit American workers and employers at all income levels. In 2019, I estimated that a worker making about $40,000 in the United States would pay $6,000 more in taxes if he moved to the average European country where higher taxes are necessary to fund bigger welfare states. A higher-income person earning about $100,000 would pay more than half of their income in taxes and $16,000 more than a similar person in the United States.35
Every other large modern welfare state funds its higher levels of government spending with high taxes on a broad swath of the population. This is not because politicians in those countries do not want to tax the rich; it is because there is not enough money at the top of the income distribution to fund their desired spending levels.
This is true in the United States too. IRS data show that if Congress confiscated every dollar earned by individuals and businesses past their first $500,000, it would still not cover the cost of next year’s projected $1.5 trillion deficit—unrealistically assuming no behavioral or other economic effects from taxing 100 percent of additional earnings.36
Broad-based tax increases are also no guarantee of lower deficits and debt. Historically, new or increased taxes to remedy fiscal imbalances deepen and prolong economic recessions and do not reduce debt-to-GDP ratios.37 More often than not, higher taxes are associated with new spending in excess of the revenue raised.
What if We Had a Twentieth-Century Tax Code?
The United States has a long history of large and small tax cuts. It is easy to forget what taxes for middle-class Americans would have looked like had Congress not taken up periodic tax cuts. Significant tax cuts occurred in the 1920s, 1960s, 1980s, 2000s, and 2010s.38 Historically, tax cuts have increased economic efficiency by reducing biases against work and investment in the tax code and made corrections for projected revenues above the historical average, protecting middle-class taxpayers from significant tax increases and largely eliminating income tax bills for Americans with below-average incomes.
If Congress rolled the tax code back to the early 2000s, American families would pay significantly higher taxes. In 2000, the lowest income tax rate was 15 percent, up from 12 percent today. Marginal tax rates were also higher across the board, and the top rate was 39.5 percent, compared to 37 percent today.39 The Child Tax Credit was only $500 per child, down from $2,000 today, and marriage penalties were higher across more income tax brackets.40 The AMT would be paid by more than 35 million taxpayers, up from 200,000 taxpayers today, and the estate tax would capture 100 times more estates which would pay nine times as much under the death tax.41 The 2000 estate tax exemption was $675,000. In 2023, the exemption is $12.9 million.42
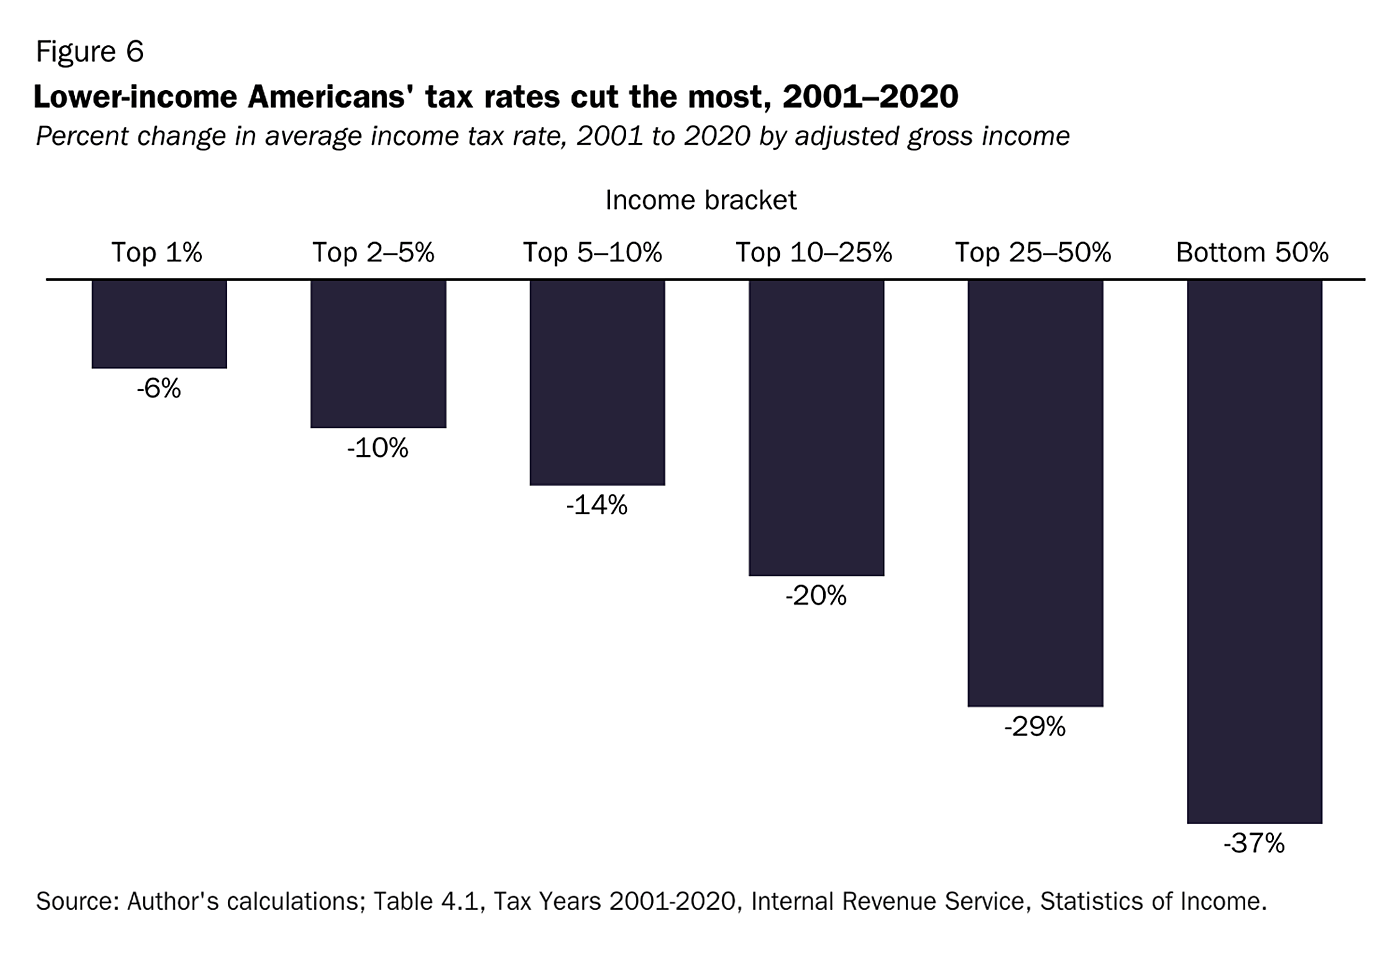
Since 2001, the earliest we have consistent IRS data, average income tax rates have fallen for all five income groups. Figure 6 shows rates have fallen the furthest for those with the lowest income, declining from 4.9 percent in 2001 to 3.1 percent in 2020, a 37 percent decline. For the top 1 percent, average tax rates fell from 27.6 percent in 2001 to 26.0 percent in 2020, a 6 percent decline. During this same time, the share of income taxes paid by the top 5 percent increased from 52.2 percent to 62.7 percent, while the share paid by all other taxpayers declined.
I look forward to answering your questions.
About the Author


This work is licensed under a Creative Commons Attribution-NonCommercial-ShareAlike 4.0 International License.