Introduction
Chairman Warren, Ranking Member Kennedy, and Members of the Committee, thank you for the opportunity to testify at today’s hearing. My name is Norbert Michel, and I am Vice President and Director for the Center for Monetary and Financial Alternatives at the Cato Institute. The views I express in this testimony are my own and should not be construed as representing any official position of the Cato Institute.
In the wake of the COVID-19 pandemic and the government shutdowns, the United States experienced the largest increase in inflation it had seen since the 1970s. Nearly all Americans, including both consumers and workers, have been harmed to some degree by this increase. The primary causes of this inflation spike were profligate fiscal and monetary policy, enacted before the economy had recovered from widespread supply disruptions from the pandemic and the government shutdowns. These policies left many American households with unusually high disposable income. For instance, per capita disposable personal income increased 13 percent from January 2021 through March 2021, far greater than the average first-quarter increase (0.43 percent) during the last decade.1
Given that this increase was largely due to deficit-financed federal spending, many people (correctly) feared higher inflation would soon result because of the classic “too many dollars chasing too few goods” phenomenon.2 Unfortunately, that prediction came true. Yet, when inflation took off, many policymakers appeared surprised, and they blamed the increased price level on more sinister factors, such as corporate greed, price gouging, and industry consolidation.3
A Summary of U.S. Inflation Data
To help decipher between the possible explanations for the recent increase in inflation, the next section of this testimony provides a summary of what happened to inflation and food prices. It uses the Consumer Price Index (CPI) and its components, as reported by the Bureau of Labor Statistics (BLS).4
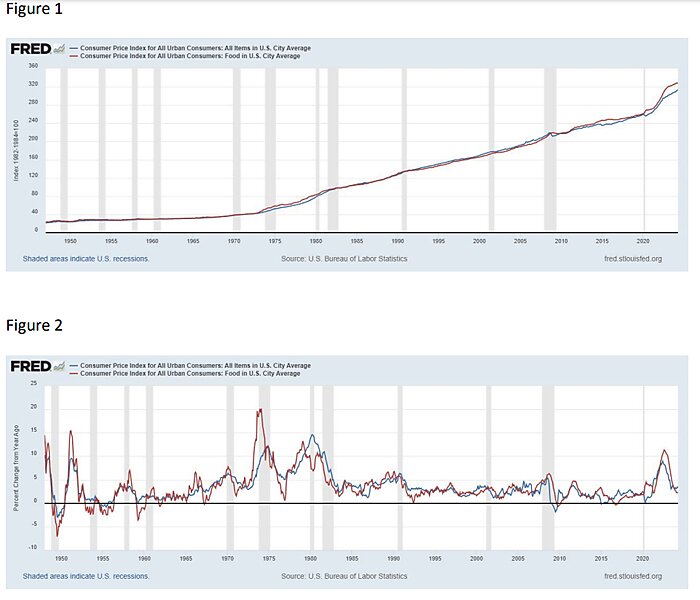
- As seen in Figure 1, using the CPI measures reported by the BLS, the overall rate of inflation and the rate of growth in food prices are highly correlated through time. They exhibit a correlation coefficient of 0.99 from 1947 to 2024 (the full post World War II era/the full BLS data series).
- Yet, food prices are a component of the overall CPI, a common measure of inflation—they are not, themselves, synonymous with inflation.
- For the CPI, the average monthly change between 1947 and 2024 is 0.2901 percent, with a standard deviation of 0.34. For food prices, the average monthly change between 1947 and 2024 is 0.2897, with a standard deviation of 0.56.
- Thus, food prices tend to be more volatile than the overall price level.
- Figure 1 also shows that the long-term trend for each series increased in 1973, and the trend was relatively smooth until 2020, when it increased above its previous trend.
- The average monthly change for the sub-period 1973 to 2019 is slightly higher than for the full series. Between 1973 and 2019, the average monthly change for the CPI is 0.3213 percent, with a standard deviation of 0.34. For food prices, the average monthly change between 1973 and 2019 is 0.3201 percent, with a standard deviation of 0.46.
- The average monthly change for the sub-period 1983 to 2019, a period which begins after the 1970s inflation spike, is slightly lower and less volatile than for the full series. Between 1983 and 2019, the average monthly change for the CPI is 0.2198 percent, with a standard deviation of 0.25. For food prices, the average monthly change between 1983 and 2019 is 0.2203 percent, with a standard deviation of 0.24.
- Following the COVID-19 pandemic and the government shutdowns, the United States experienced an unusually large spike in inflation (following a three month decline in the price level), its first since the 1970s. As has been well-chronicled, this increase caused a great deal of economic pain for many Americans. This increase in inflation dates from June 2020 through June 2022.
- Prior to the increase in the CPI, the index declined for several months—in March, April, and May of 2020, the monthly CPI declined.5
- From June 2020 through June 2022, the monthly change for the CPI is 0.57 percent, with a standard deviation of 0.29. For food prices, the average monthly change is 0.52 percent, with a standard deviation of 0.39.
- These month-to-month changes were above average, and they resulted in annual (year over year) inflation rates higher than anything seen in the United States since the 1970s. (See Figure 2.)
- These rates, while not the best gauge for the current direction of the price level (at any given point in time), reflect how difficult inflation has made the lives of many Americans.
- Though it is often ignored, mechanically, the initial inflation spike during 2020 would have resulted in above-average annual inflation rates for an extended period even if the monthly rate of inflation had declined for many subsequent months.
- For example, even if the price level had remained flat for almost one full year after the initial spike, the corresponding monthly changes would have remained above average because the initial spike was so high. If, for instance, the month-to-month rate remained 0.1 percent through August 2023, the year-to-year inflation rate would not have dropped below three percent until May 2023.6
- Though it is often ignored, mechanically, the initial inflation spike during 2020 would have resulted in above-average annual inflation rates for an extended period even if the monthly rate of inflation had declined for many subsequent months.
- Between 1973 and 2019, the average annual inflation rate (12-month periods, calculated each month) for the CPI is 3.97 percent, with a standard deviation of 3.03. For food prices, the average annual change between 1973 and 2019 is 3.989 percent, with a standard deviation of 3.45.7
- From June 2020 through May 2023, the average annual inflation rate for the CPI is 5.18 percent, with a standard deviation of 2.73. For food prices, the average annual change is 6.59 percent, with a standard deviation of 3.08.
- From June 2023 to May 2024, however, the annual rates have declined—to 3.32 percent for the overall CPI, and to 3.34 percent for food prices. These annual rates are, in fact, below average for both the full post World War II period and the 1973 to 2019 period.
- Still, the month-to-month changes in the CPI portray a more accurate picture of how long inflation has been within a normal range.
- Between July 2022 and April 2024, the average month-to-month change for the overall CPI is 0.27 percent, below the average for the full series (0.29 percent) and the 1973 to 2019 period (0.32 percent). The month-to-month change in food prices (0.34 percent) remains slightly above the average for the full series (0.29 percent) and is essentially the same as the average for the 1973 to 2019 period (0.32 percent).
- When considering the typical variation in the month-to-month change in food prices, for either the full post World War II period or the post 1973 period, the month-to-month change in food prices between July 2022 and April 2024 is well within the range of food price increases Americans normally face.
- Thus, while Americans are still (rightly) upset about higher prices, they have, since the middle of 2022, been experiencing rates of inflation (and changes in food prices) that are no different than the changes they typically experienced between 1973 and 2019.
- Regardless, the worst of the initial spike occurred in the first quarter of 2021, and the spike subsided beginning in July 2022.
- The BLS’s most recent CPI release shows a change in food prices of zero for April 2024. For the preceding 6 months (March to October, in reverse chronological order), the rate of increase in food prices was 0.1, 0.0, 0.4, 0.2, 0.2, and 0.3, respectively.8 Only the increase of 0.4 percent (in January) could be considered above normal. However, when considering the typical variation in the month-to-month change in food prices, even the January increase is within the typical range of food price increases that Americans have experienced during the post World War II era.9
The Recent Controversy
Despite most of the inflation metrics being well within the normal range of monthly increases during the last several months, because the monthly changes were a bit higher than many economists expected, there has been a great deal of debate over whether inflation is truly heading in the right direction or is, at least, low enough. It remains true, though, that the recent changes in the overall CPI have been mainly driven by increases in one or two categories of goods, like the CPI changes throughout much of the post COVID-19 period. In fact, those categories of goods often varied within their normal ranges, and other statistical factors (such as lagged recognition of values) suggest that even those “higher than expected” increases were not problematic.10 Nonetheless, the debate continues.
Increased industry concentration (a higher fraction of overall output being produced by a smaller number of firms) and corporate market power (firms’ ability to persistently charge prices above their marginal costs) are generally poor explanations for inflation. The inflation spike in the United States from June 2020 through June 2022 is no exception. First, it does not follow that any firm (or group of firms) will have increased market power when industry concentration increases. Moreover, industries tend to become more concentrated when an innovative firm captures a larger market share because it is more productive and able to charge lower prices.11Aside from whether such firms charge lower prices, this type of concentration is generally not a cause for concern because when such companies succeed, they spur other companies to enter the market, thus reducing future concentration and earning some of the profits available in the industry.12
Evidence also shows that industry concentration and market power have not been increasing in all markets and seem to have decreased at the local level in many markets. In general, national concentration levels appear to have been driven by large firms expanding into new local markets. Broadly, this phenomenon appears to have caused local concentration levels to fall as consumers in local markets gained more options.13 Moreover, while concentration levels tend to be correlated with productivity and output growth, they tend to be uncorrelated with price changes and wage payouts.14
As my colleague Ryan Bourne has described, even under the best of circumstances, national concentration measures do a poor job of explaining market power.15 Regardless, the price increases of individual (or small groups of) companies reveal little about inflation, the economy’s overall price level. Similarly, pointing to increased corporate markups reveals next to nothing about inflation.16 Firms respond to market conditions, including higher input costs, and try to maximize their profits by charging prices that will not reduce their market share.
The idea that corporations decided to charge high prices to earn abnormally high profits (price gouging), thus causing the post-COVID-19 spike in global inflation (the so-called “greedflation” theory), appears to have been fueled by a recent International Monetary Fund (IMF) report.17 Even though the authors of the report were explicit that their analysis represented an “accounting identity [which] does not allow for causal interpretation,” multiple media outlets used the IMF report to bolster the greedflation theory.18
Attributing the inflation increase to corporate greed in this manner is both wrong and counterproductive. As the IMF authors explain, their accounting identity is not an explanation for inflation, it is merely an accounting exercise to break down inflation into its constituent components. In other words, attributing inflation to greed in this manner is wrong because the accounting identity cannot explain why these components are above or below their normal thresholds; it can only explain which components are above or below their normal thresholds.
The faulty attribution is also exposed by examining the 1970s inflation spike, the one that the IMF report attributes mostly to labor cost.19 That is, if corporate greed caused the post-COVID inflation spike, then worker greed (receiving higher wages) must have caused the 1970s inflation spike. These explanations are equally wrong.
Many factors drive supply and demand for products, thus leading to relative price changes. Moreover, many exogenous factors (including supply shocks from wars) cause macroeconomic price level changes. Still, the kinds of accounting identities in the IMF report tell us nothing about the causal factors behind either relative price changes or price level changes. Additionally, attributing inflation to greed in this manner is counterproductive because it risks enacting policies that fail to address the underlying causes of inflation, possibly worsening inflation and further reducing Americans’ welfare.
Another problem with the greedflation story is that it ignores the long term trend in the price level and the decline in the price level that occurred before the post-COVID inflation spike. That is, if corporate greed explains the spike in inflation that occurred in June 2022, then it begs the question: Why were corporations less greedy from 1983 to 2019, when inflation averaged only 2.67 percent, and altruistic from March 2020 to May 2020, when the CPI declined?
Finally, federal policymakers must also address why the U.S. fiscal and monetary systems are designed to prevent deflation and produce, instead, a positive inflation rate of 2 percent. If members of Congress believe that inflation is caused by corporate greed, surely, they would prefer a system designed to produce a negative rate of inflation. Or, perhaps, members believe that 4 or 5 percent inflation reflects too much greed, but 2 percent inflation reflects just enough greed. Either way, members should explain their position.
Conclusion
For the entire post World War II era, federal policymakers have insisted that government spending would stimulate the macroeconomy by raising aggregate demand (total spending), putting upward pressure on prices and profits, thus causing businesses to supply more goods and services to meet the increased demand. In other words, it would boost the economy. Members of Congress who refuse to attribute the June 2020 to June 2022 spike in inflation to the increased government spending that followed the COVID shutdowns are implicitly arguing that the boost in aggregate demand that followed had nothing to do with higher prices and profits. Of course, if companies were to suppress prices and profits, the basic economic theory that calls for stimulative policies in the face of economic slowdowns no longer holds. If, however, the accepted view of fiscal policy does hold, the current projected path of government spending suggests that inflationary pressures will not dissipate with fiscal reforms.20
Thank you for the opportunity to provide this information, and I welcome any questions that you may have.

About the Author


This work is licensed under a Creative Commons Attribution-NonCommercial-ShareAlike 4.0 International License.