In February 2018, the Office and Management and Budget released an obscure report estimating the costs and benefits of a recent 10-year stretch of federal regulation. In response, one public interest group trumpeted with evident glee that the report showed that federal regulation offers “returns on investment that would make Fortune 500 companies jealous.”
The report in question was the 2017 Report on the Benefits and Costs of Federal Regulations (officially known as the Draft 2017 Report to Congress on the Benefits and Costs of Federal Regulations and Agency Compliance with the Unfunded Mandates Reform Act). It was another iteration of a report that has been produced for nearly 20 years as a result of a likewise obscure law, the 1999 Regulatory Right-to-Know Act. That law mandates that the OMB submit to Congress an annual accounting statement and associated report containing an estimate of the total annual costs and benefits of federal regulatory programs in the aggregate, by agency and agency program, and by major rule.
Without fail, in each report issued since 1999, the OMB has proclaimed that the benefits of federal regulation vastly exceed the costs by a large margin. The last report, issued only in draft form, was the first and only such report issued by the Trump administration and it covered President Barack Obama’s last year in office as well as previous years. It reported benefits between $287 and $911 billion (in 2015 dollars), at a cost of between $78 and $115 billion. While there are some caveats that the OMB notes in the fine print (for example, fewer than 1% of regulations issued each year have cost and benefit estimates associated with them), most journalists and politicians don’t read the fine print. As a result, it’s common to hear progressive legal scholars and journalists make claims that the OMB report shows “total benefits that are approximately seven times as great as total costs,” or that the “average return on investment in a major rule is about 600 percent.”
Are such claims credible? Are U.S. citizens really getting such fantastic returns from their government, as has been regularly reported for years? Or is this just more of the same political spin we’ve come to expect from Washington?
This article will try to answer those questions. It turns out that the combined benefit and cost estimates in the OMB report are an illusion. They are based on estimates that display faulty economics, uncertain and hastily conducted science, incomplete analysis, and worse, altogether missing analysis. Furthermore, the report is not so much an original source of research as a compilation of a body of work from different federal regulatory agencies. This results in a “garbage-in, garbage-out” problem that is broader in scope than just the OMB’s annual report; all executive regulatory agencies are producing unsound analysis to varying degrees.
Those problems are nothing new and are widely known among regulatory experts. Nonetheless, administrations of both political parties have continued to issue the report, likely because every president wants his regulatory program to be perceived as a success. Yet, President Trump has broken precedent, having not issued a report since early 2018. The question now is what will take its place, as the Regulatory Right-to-Know Act is still the law of the land.
Incoherent Discount Rate Pracices
In 2003, the OMB issued government-wide guidelines on sound regulatory impact analysis (RIA) practices. Those guidelines, known as Circular A‑4, have generally been viewed as an improvement over previous practices in that they help generate uniformity in economic analysis practices across the government.
But uniformity can be a double-edged sword. It can be a good thing if the goal is to spread best practices of top-performing agencies to lower-performing agencies, but there is also a danger that flawed practices could become standardized and spread across the entire government. This appears to be precisely what has happened in the context of A‑4’s recommendations on discount rates.
Because benefits and costs of regulations often accrue over different time spans, many economists believe a discount rate is necessary to identify what those streams are worth in the present. The OMB guidelines specifically recommend that agencies use a 7% “base-case” discount rate, which is supposed to approximate the “opportunity cost of capital.” The opportunity cost of capital describes the returns a capital asset would generate over time, which the OMB believes to be about 7% a year on average. When money that would have been invested in capital is forced to be spent complying with regulations instead, those forgone returns will never be realized (i.e., a cost). Similarly, government regulations can stimulate investment at times, and the returns to new investment should be accounted for as well (i.e., a benefit).
However, a problem arises when the benefits from complying with a regulation involve, for example, extending human life or some other nonpecuniary social objective. The returns to investing in many social priorities, like health, safety, or the environment, do not grow at a 7% annual rate. In fact, they may not grow at all.
For this reason, the OMB also recommends using a lower discount rate that corresponds not to returns on capital, but instead reflects the belief that “society” would rather have something immediately rather than wait. The OMB suggests that the alternative value appropriate for social discounting is 3%.
But the OMB allows analysts to apply the same discount rate to capital investment and social benefits and costs. This practice biases analysis in favor of regulations. Why? Because an analysis would erroneously show no difference between a capital investment of, say, $1 million and a comparable social investment; meanwhile, the former would grow much faster in value. In such cases, the analysis has not adequately accounted for how the future returns stemming from these different kinds of investments are entirely different.
Inappoprioate End-of-Life Valuation
To the OMB’s credit, in a section titled “Assumptions and Uncertainties” in its more recent annual reports, the agency makes clear that “an important source of uncertainty in the case of health and safety regulations is how to value a regulation’s expected reduction in risks to life.”
Indeed, mortality risk reductions are the primary benefit making up the billions in economic benefits asserted by the OMB. However, one of the main reasons this is a source of uncertainty is because so many of the projected benefits from federal rules are anticipated extensions of the lives of the very elderly. These benefits represent extremely short extensions of life and, to be fair, there is no academic consensus among economists as to how these should be valued.
Each year, the OMB usually notes that a disproportionate share of the estimated benefits in its annual report are related to the Environmental Protection Agency’s air quality regulations. For example, in the most recent report, the OMB stated that “EPA rules account for over 80 percent of the monetized benefits and over 70 percent of the monetized costs. Of these, rules that have a significant aim to improve air quality account for over 95 percent of the benefits of EPA rules.”
The report goes on to note that “the large estimated benefits of EPA rules issued pursuant to the [Clean Air Act] are mostly attributable to the reduction in public exposure to fine particulate matter (referred to in many contexts as PM2.5).” In other words, just one pollutant is behind much of the headline-grabbing benefit estimates for federal regulations. But, as George Washington University professor Susan Dudley has noted in these pages, a 2011 analysis from the EPA reveals that “the median age of the beneficiaries of these regulations is around 80 years old, and the average extension in life expectancy attributable to lower PM2.5 levels is less than six months.” (See “OMB’s Reported Benefits of Regulation: Too Good to Be True?” Summer 2013.) The most recent OMB report similarly states, “EPA’s analysis shows that the median age of individuals experiencing reduced mortality is around 75 years old.”
Typically, when placing a dollar value on a human life, as federal agencies do, the government uses a value for a roughly median-aged person. Today, a common number to use is around $10 million. This value, formally known as the value of a statistical life (VSL), is popular among economists, and it is how mortality risk benefits in the OMB report are calculated. But economists also acknowledge that in some situations, like those related to particulate matter mortality where life might be shortened by a matter of months, the full VSL value is clearly unwarranted.
Vanderbilt economist Kip Viscusi, a well-known expert on mortality risk valuation, acknowledges that “in the case of attaching benefit values to very small impacts … use of [a smaller number] is appropriate for promoting efficient risk levels.” Specifically, Viscusi endorses using the value-of-a-statistical-life-year (VSLY), which is usually on the order of several hundred thousand dollars and is applied to each year of remaining life.
While both the VSL and the VSLY have their own issues, we only note that analyses that attach very large benefit values to rules affecting life extensions of the elderly overstate the benefits to society.
Uncertain Underlying Risk Studies
The benefit estimates for many health and safety rules are also problematic because of questions about the quality of the studies that underlie the estimates, as well as errors that are made when economists attempt to combine those pieces of evidence to produce an aggregate economic analysis. A few examples help to illustrate this problem:
In 1998, Lancet published a study of 12 people who received the measles, mumps, and rubella vaccine and claimed they developed intestinal problems and autism. Despite just 12 anecdotes, six peer reviewers gave a positive nod to the study’s publication. The study was also partially funded by some of the parents involved in a lawsuit against vaccine manufacturers. Twelve years after publication, it was finally withdrawn. But this hasn’t stopped Robert F. Kennedy Jr., chairman of the advocacy group Children’s Health Defense, along with show business celebrities Jessica Biel and Jenny McCarthy, from continuing to insist that the vaccines are dangerous. No conclusions about causation should ever have been made from such a small, biased study.
Similar problems plague the studies that underlie benefit estimates in RIAs. For example, in 2016 the EPA finalized a rule that set a limit for exposure to formaldehyde, a byproduct of pressed wood used in manufacturing. The regulatory limit it set is more than 50 times lower than the median concentration that people — in fact, all animals — exhale with each breath from normal endogenous metabolic processes. The EPA’s model did not make allowances for a threshold below which no health hazards ensue. That model, called a linear no-threshold model, is the default model for many of the EPA’s risk assessments, including all cancer risk assessments. (See “The Troubled History of Cancer Risk Assessment,” Spring 2019.)
Perhaps the biggest problem, and one that is extremely hard to address, is that there is a bias against publishing findings that do not show any effect, a so-called “negative study.”
The EPA and Department of Energy continue to insist that radon-222 is dangerous at 4 picocuries (pCi) per liter. They recommend that homes and buildings be tested and, if found to contain more than that amount, be “remediated” by blocking the gas or piping it out. Millions of dollars are spent doing so each year. Yet, a recent study concluded that there were unlikely to be any cancers below 27 pCi per liter. The government’s model neither accounts for a threshold nor the possibility of a beneficial (hormetic) effect, which would have been more appropriate for exposures to low doses of ionizing radiation. (See “Time for Radiation Regulation to Evolve,” Fall 2019.)
Relatedly, there may also be problems from regulating PM2.5. Tony Cox, currently chairman of the EPA’s Clean Air Scientific Advisory Committee, suggests that particulate matter may have either a threshold or a hormetic point where there are actually benefits from low levels of exposure. These levels may even have been reached by current regulatory standards.
Many epidemiology studies, like those that are used to estimate benefits for Clean Air Act rules, also tend to over-claim by asserting dangerous causation even though there is only an association. Psychiatrist and bioethicist Peter Rabins of Johns Hopkins University notes that many researchers studying health and disease find it difficult not to report causation even when the data do not support it. As Albert Einstein College of Medicine epidemiologist Geoffrey Kabat points out, these exaggerated claims of causation can, in turn, give rise to “ ‘information cascades’ — highly publicized campaigns that can sow needless alarm and lead to misguided regulation and policies.” (See “Following the Herd,” Winter 2003.)
Data Issues
Data can be insufficient or unreliable. Insufficient data can occur when sample sizes are too small from which to draw conclusions (like in the vaccine case above). In some cases, the exposure examined in a study is too far in the past to account for all the confounding factors people have been exposed to in the years since exposure.
Then there are data that are unreliable. For example, nutrition data rely on people trying to recall what they have eaten. University of Alabama, Birmingham researcher Ed Archer has investigated these data and found that 60% of people don’t report eating enough food to stay alive. Stanford professor John Ioannidis and colleagues found epidemiologic studies of both nutrition and environmental contaminants to be weaker than other fields.
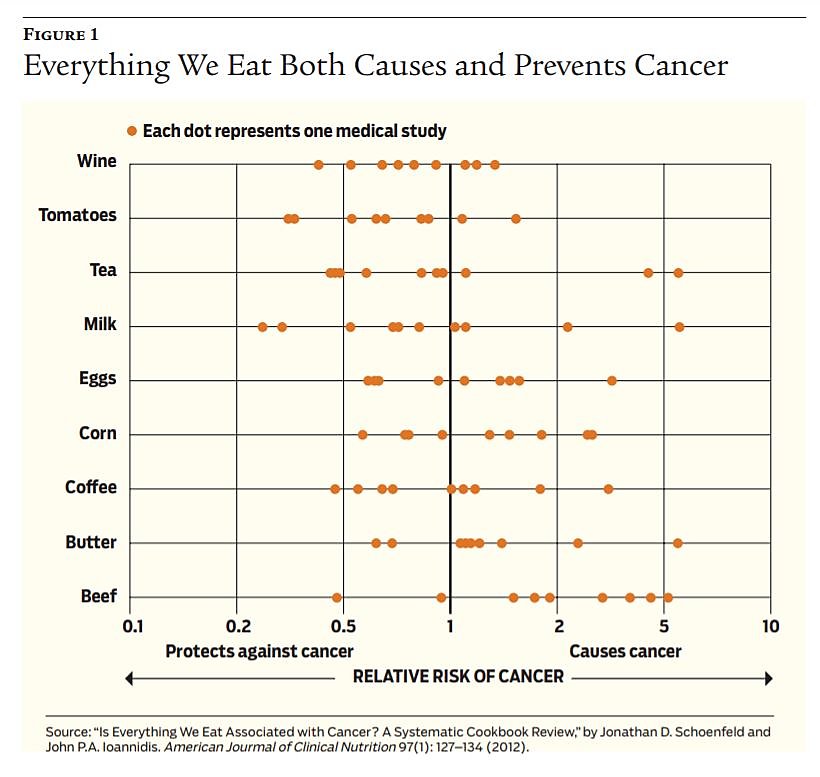
One recent controversy involving epidemiological trials emanated from a meta study published in the Annals of Internal Medicine in 2019 that concluded that the evidence that people should cut back on eating red meat is limited. Because it is nearly impossible, or at least prohibitively expensive, to conduct randomized trials over a decade, most of the evidence the authors examined, and most of the recommendations to limit consumption of red meat, came from cohort studies, which often rely on people’s memories. It may be perfectly true that consumption of red meat will increase risk, but proving causation with such cohort studies is extremely difficult. (See Figure 1.)
Perhaps the biggest problem, and one that is extremely hard to address, is that there is a bias against publishing findings that do not show an effect, a so-called “negative study.” Because of this bias, researchers often discard such results even though they are useful to science and public policy. What researchers often do when they find a negative result is to go back to the data to find any association, called “p-hacking.” Had negative findings been published, they might be more common than positive studies. Unfortunately, publishing negative studies or acknowledging the weaknesses of positive studies doesn’t help to get research funding, make reputations, or secure tenure. It may also violate researcher, funder, or publisher preferences because of ideological or political bias.
Finally, a problem noted in the literature is that many scientists are not well-trained in statistics. In fact, many of the papers that show large effects actually have weak statistical evidence.
All of these issues lead to the problems recently uncovered in which many scientific studies cannot be replicated. For example, a study in Nature looked at 53 landmark cancer studies and was able to replicate just six of them. Ioannidis and Glenn Begley of the university-backed medical research firm BioCurate examined reproducibility of preclinical studies and found, for example, that 16 of 18 studies could not be reproduced from the raw data; another study identified 90 papers that were not reproducible. One 2016 analysis reported that 90% of researchers who were respondents to a recent survey in Nature agreed that there is a “reproducibility crisis” in science.
Combining the Science for Benefits Analysis
Obviously, not all scientific studies have problems and sometimes imperfect science is all that policymakers have available. But the problem for economists is that they must be able to determine which studies belong in an RIA. Kabat notes that assessing the total error associated with an individual scientific study cannot “be done easily by someone who lacks the skills and training of a scientist familiar with the subject matter and the scientific methods that were employed.” But even for trained scientists, there are many issues with published scientific papers that are difficult, if not impossible, to detect.
At some point, an economist doing a benefit assessment will have to summarize the science on the regulatory question. Suppose an agency wishes to regulate coffee because it may cause cancer. From 2010 to 2019, California required a warning on coffee for just that reason. A Google Scholar search for articles on “coffee, cancer” reveals 450,000 articles. Suppose the average paper is about 2,500 words; the total word length for all those papers would be over 1 billion words. At an average reading speed of 250 words per minute, these papers would take about 67,000 hours to read — nearly eight years of round-the-clock reading. Of course, that’s just the start, as one would also have to figure out which studies are scientifically valid, adding tremendously to the task. Kabat points out, “Only by examining the full range of studies on a given question and considering their attributes (sample size, quality of the measurements, rigor of the statistical analysis) and strength and consistence across different studies, can one form a judgment of the quality of the evidence.”
A New OMB Report to Congress
Arguably, the Trump administration’s new Regulatory Reform Status Reports, which provide updates on the administration’s deregulation efforts under Executive Order 13771, are maintaining compliance with the Regulatory Right-to-Know Act. Even while there are some improvements in these new reports relative to past practices, they remain fairly brief and, like the old OMB reports, miss large swaths of the regulatory state.
Here we offer a few recommendations as to what a new and improved OMB annual report on regulations should include. First, any new report should include a more comprehensive description of the regulatory state and its growth. It should provide counts of the number of annual final rules, the number of significant rules, the number of economically significant rules, and the number of guidance documents, all listed by department or agency.
Additionally, benefit–cost analysis has value first and foremost as a decision-making tool, but it will inevitably miss the long-run consequences that matter most for citizen well-being. The OMB, perhaps in concert with the Council of Economic Advisers or the Small Business Administration (which has produced credible estimates of the aggregate costs of regulation in the past) should estimate the cumulative effect of regulation on the economy, incorporating insights from the burgeoning literature of how regulations affect economic growth.
The “regulatory budget” — a cap on the total cost of regulatory compliance — set by the Trump administration should be maintained and agency compliance with the budget should continue to be reported. The suggestions above could serve as supplements that build and improve upon the current reports.
While the old OMB reports to Congress were misleading in terms of their topline numbers, they still contained valuable information that is worth continuing to report. For example, regulations whose primary effect was on government’s finances were listed and estimates of their budgetary effects were provided. The compliance cost estimates from RIAs associated with economic regulations may also be fairly reliable, unlike cost and benefit estimates associated with social regulations. Such information should be included in future versions of the report.
None of this argues against the use of benefit–cost analysis for regulations. There are numerous instances where, as a result of analysis, individual regulations were improved by changing regulatory options to increase benefits, reduce costs, and in some cases stop inefficient regulations altogether. But combining these analyses to report on a year’s “successes” is unwarranted.
Conclusion
All in all, the experience with the OMB report is probably best described as a good idea that simply didn’t pan out. This article has offered a path forward that would maintain compliance with the Regulatory Right-to-Know Act but would discard those aspects of previous reports that defied credulity.
While the old reports could be described as a cynical exercise in political opportunism, there remain reasons to be optimistic about the future. The Trump administration has made some meaningful progress on regulatory review in recent years. The real question is whether a second term of the Trump administration or a future Democratic administration will have the courage to build on that progress and take improvements to the next level.
Readings
- Getting Risk Right, by Geoffrey C. Kabat. Columbia University Press, 2017.
- “Is a Ceiling on Regulatory Costs Reasonable?” by Richard Pierce. Regulatory Review, September 30, 2019.
- Pricing Lives: Guideposts for a Safer Society, by W. Kip Viscusi. Princeton University Press, 2019.

This work is licensed under a Creative Commons Attribution-NonCommercial-ShareAlike 4.0 International License.