Wealthier countries have larger governments. The question is, why?
One explanation is that many of the goods that governments spend money on are, in technical terms, superior goods, meaning that when you are wealthier, you buy more of them as a percentage of your income. Others posit that public investments in education and health contribute to economic growth by improving productivity, which in turn increases gross domestic product per capita. Alternatively, wealthier countries are able to “buy” more of something called “state capacity,” which is what academics call the ability of governments to accomplish what they set out to accomplish. Half of this is clearly a good thing because it means higher quality courts and legal systems. But the other side of state capacity is fiscal capacity, which is the ability of governments to raise tax revenue, and thus grow the government through that mechanism.
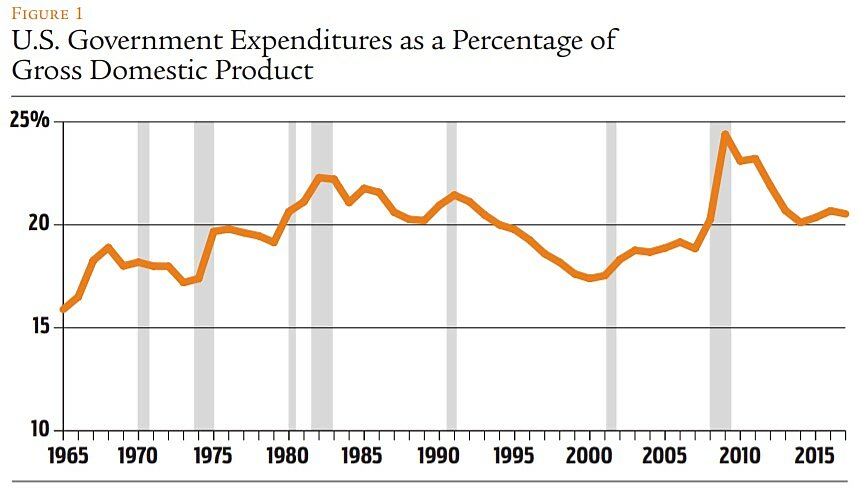
Wagner’s Law, named for turn-of-the-20th century economist Adolph Wagner, posits a direct correlation between a society’s wealth and the size of its government. If Wagner’s Law generally holds, it could lead to a certain amount of defeatism among free-marketers and other advocates of smaller government. Over the long term, total government spending has comprised a growing percentage of U.S. gross domestic product, as depicted in Figure 1. Inevitably increasing public spending is one possible reading of Robert Higgs’s “ratchet effect” found in his classic work Crisis and Leviathan, where crises ratchet up the size and scope of government under “emergency” provisions, but public spending never returns to pre-crisis levels once the emergency ends. More recently, Will Wilkinson of the Niskanen Center proclaimed, “There’s simply no path here to smaller government [for the United States].”
But Wagner’s Law, if stated as literally true and inevitable, is wrong. There are periods of time in which national income increases but government spending as a percentage of GDP falls, as reflected in the early- to mid-1980s and mid- to late-1990s in Figure 1. The issue, then, is of degree: how frequently can government spending fall in the long run in wealthy countries, and by how much?
International data / To get a sense of how often wealthy countries violate Wagner’s Law over time, one can look at how often governments cut the size of their states in the very long run. I did this using data from the most recent Economic Freedom of the World report published by the Fraser Institute (along with other Economic Freedom Network think tanks, including the Cato Institute). The specific data I examined were:
- government consumption—that is, government spending on goods and services used for direct satisfaction—as a percentage of all consumption
- transfers and subsidies as a percentage of economic output
- government investment—that is, government spending on productive assets—as a percentage of all investment
Country tables in the current edition of the Economic Freedom of the World report provide data for the years 1980 and 2015, so those are the years I compared for this research.
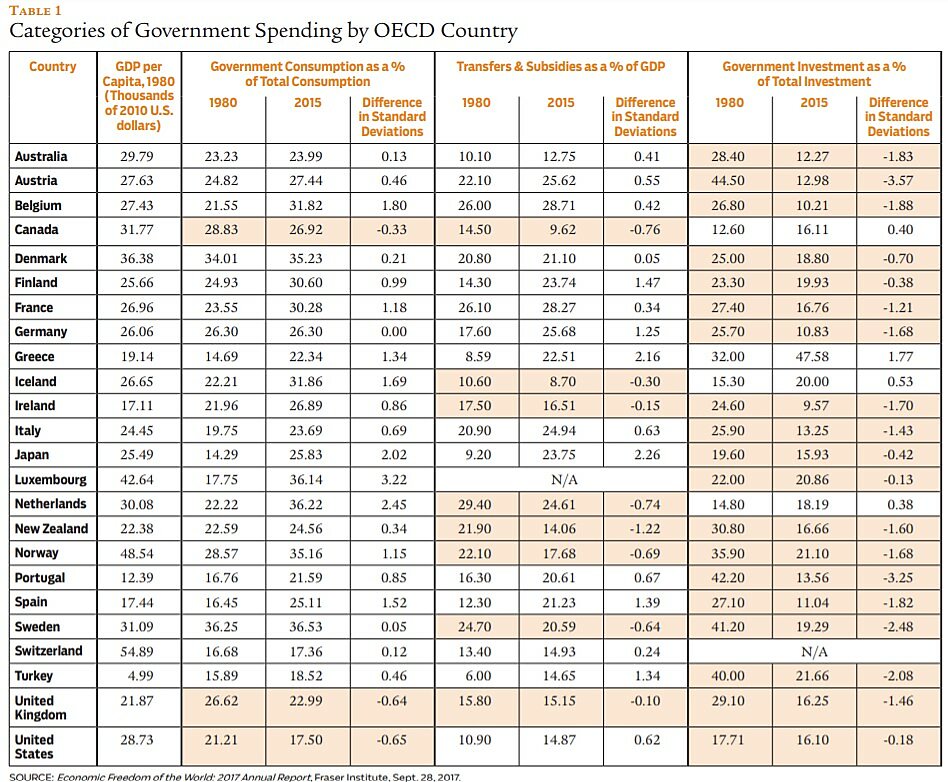
Table 1 lists the 24 members of the Organization for Economic Cooperation and Development in 1990, along with their GDP per capita in 1980 (in 2010 U.S. dollars). Three sets of columns give the three measures of government spending listed above in both 1980 and 2015. If the strong version of Wagner’s Law were to hold, the 1980 figures would always be smaller than their 2015 counterparts. Government consumption and spending on transfers and subsidies are the clearer tests of the hypothesis, although all three measures should be given some weight if Wagner’s Law is to mean that increases in the size of government are inevitable.
These measures of government spending differ in terms of how much they each vary across countries. A change of five percentage points represents a greater change for one type of government spending than another. To better express how big the changes that occurred in government spending from 1980 to 2015 really were, I calculated the standard deviation of each variable in 1980. I then divided the change from 1980 to 2015 by this standard deviation. For example, in Belgium, government consumption as a percentage of total consumption increased from 21.55% in 1980 to 31.82% in 2015. As the standard deviation among these countries in 1980 was 5.72%, Belgium’s 10.27% increase corresponds to 1.80 standard deviations.
Table 1 highlights the countries and variables that declined from 1980 to 2015. It does indeed seem difficult to cut government consumption. Of the 24 countries, only three—Canada, the United Kingdom, and the United States—cut government consumption over this time period. The cuts in the UK and the United States were not at all trivial, though, amounting to more than half a standard deviation apiece. Still, if this were the entire story for government spending, it would give some credence to the defeatist story regarding government spending.
However, between 1980 and 2015, eight of the 23 countries for which complete data are available cut their transfers and subsidies as a percentage of GDP, and a significant majority—19—cut their government investment as a percentage of total investment. Of those latter countries, 14 cut government investment by more than a standard deviation. The only country that increased government investment by at least a standard deviation was Greece.
What caused this decrease in spending is rather obvious: the West decided to stop playing soft socialism at the so-called “commanding heights” of the economies and privatized a number of government functions. That very recent historical episode, in which nearly every advanced economy in the world washed its hands of so much state ownership, certainly appears like it should count as a cut to the size of government.
Why did it happen? / There may be some amount of substitution between these three areas of government spending, of course. Only one country, the UK, cut its spending across all three areas. Canada is one of a handful of countries that cut its transfers and subsidies to a nontrivial degree and also cut its government consumption, but its government investment ticked upward. So how should we interpret these numbers?
First, it is absolutely not true that there are inevitable barriers to reducing government investment. And there is plenty of opportunity for more reductions: public–private partnerships, which promise to shift many of the tougher issues regarding infrastructure to the private sector, are only now beginning to get off the ground. Even in the United States, which never went to the soft socialist extremes that much of Europe did, there are plenty of opportunities to privatize infrastructure—especially in airports, a step already taken in many areas of the world.
Second, despite the headwinds of rising entitlements for the elderly across all advanced economies, there are several examples of countries that have managed to cut transfers and subsidies over the last 35 years.
Third, cutting government consumption may offer a tougher task, but there are clear policy proposals to do so on the table right now. These include the termination of various privileges enjoyed by public sector unions, which in turn could lead to expenditure cuts. But it would be somewhat surprising if government consumption is the higher-hanging fruit in comparison to transfer payments, given the demographic challenges that face nearly all of these countries.
Another point of interest is that countries with a legal system originating in Britain—in this sample, Australia, Canada, Ireland, New Zealand, the UK, and the United States—are disproportionately represented among the countries in cutting spending over this time period. The importance of legal origins in determining institutional quality and outcomes is a recent finding in social science, and it is possible that this is another instance of that effect coming into play. If this is the case, this is another factor supporting the prospects of U.S. cuts in government spending.
Conclusion / There is little reason for small-government advocates to be pessimistic about the prospects for reducing government size. Government investment has fallen tremendously throughout the West, and transfers and subsidies seem to fall if there is the political will for it. The category of government spending that has been more stubborn in the recent past is government consumption, but this is with two caveats: it actually fell in the United States between 1980 and 2015, and there are rather clear-cut ways for dealing with this particular set of issues, including mitigating the effects of public sector unions. While ultimately there may be more important priorities than reducing the rate at which government spending grows, the idea that government spending cannot ever be reduced is not supported by the analysis.
The late public choice economist Robert Tollison once said, “We’re all part of the equilibrium.” By that he meant that even though it may not look like public policy think tanks and other academic institutions have much of an effect on policy, their actions contribute to whatever public policy equilibrium we experience. This notion is supported by recent research on the effects of op-ed writing on public opinion. It would be safe to assume that if free market intellectuals cease to make the case for less government spending, we should expect more government spending in the future than we would have otherwise.
Readings:
- “Foreigners Show Airport Privatization Works,” by Nick Zaiac. American Institute for Economic Research, Jan. 1, 2018.
- “Investment in Human Capital,” by Theodore W. Schultz. American Economic Review 51(1): 1–17 (1961).
- “The Economic Consequences of Legal Origins,” by Rafael LaPorta, Florencio Lopez-de-Silanes, and Andrei Shleifer. Journal of Economic Literature 46(2): 285–332 (2008).
- “The Long-Lasting Effects of Newspaper Op-Eds on Public Opinion,” by Alexander Coppock, Emily Ekins, and David Kirby. Quarterly Journal of Political Science 13(1): 59–87 (2018).
- “What If We Can’t Make Government Smaller?” by Will Wilkinson. Defending the Open Society (Niskanen Center), Oct. 19, 2016.

This work is licensed under a Creative Commons Attribution-NonCommercial-ShareAlike 4.0 International License.