Of all commercial renewable generation technologies, offshore wind is the costliest, far more so than solar photovoltaics and onshore wind. The newest incarnation of offshore wind—floating turbines that can be sited in deep water—are more expensive still. Although offshore wind is supposed to benefit from more prevalent ocean breezes, it remains, like land-based wind and solar power, an intermittent source of electricity. Hence, as offshore wind comprises a larger share of total electricity capacity, it requires ever more backup generation or storage to compensate.
Offshore wind’s high cost and intermittency raise a simple question: Why have renewable energy advocates and policymakers in many Atlantic Coast states, as well as those on the West Coast, placed such emphasis on this technology? One justification, like all forms of renewable energy, is that offshore wind will reduce U.S. greenhouse gas emissions. Whether that is true remains an open, empirical question. Offshore wind’s high costs, which require substantial—and increasing—taxpayer and ratepayer subsidies, will raise electricity rates and reduce electricity consumption. Even offshore wind manufacturers such as German-based Siemens Energy admits this. By itself, reduced electricity consumption may reduce greenhouse gas emissions slightly, as will offshore wind replacing lower-cost natural-gas-fired generation. However, any such reductions will be so small as to have no measurable effect on climate.
The second—and far more prominent—justification given for offshore wind is that it will create entirely new “green” industries to manufacture, install, and maintain turbines, and expand existing industries needed to provide inputs to the new green ones. Advocates claim this will increase economic growth and create thousands of new jobs in states pursuing the technology. This claim is false.
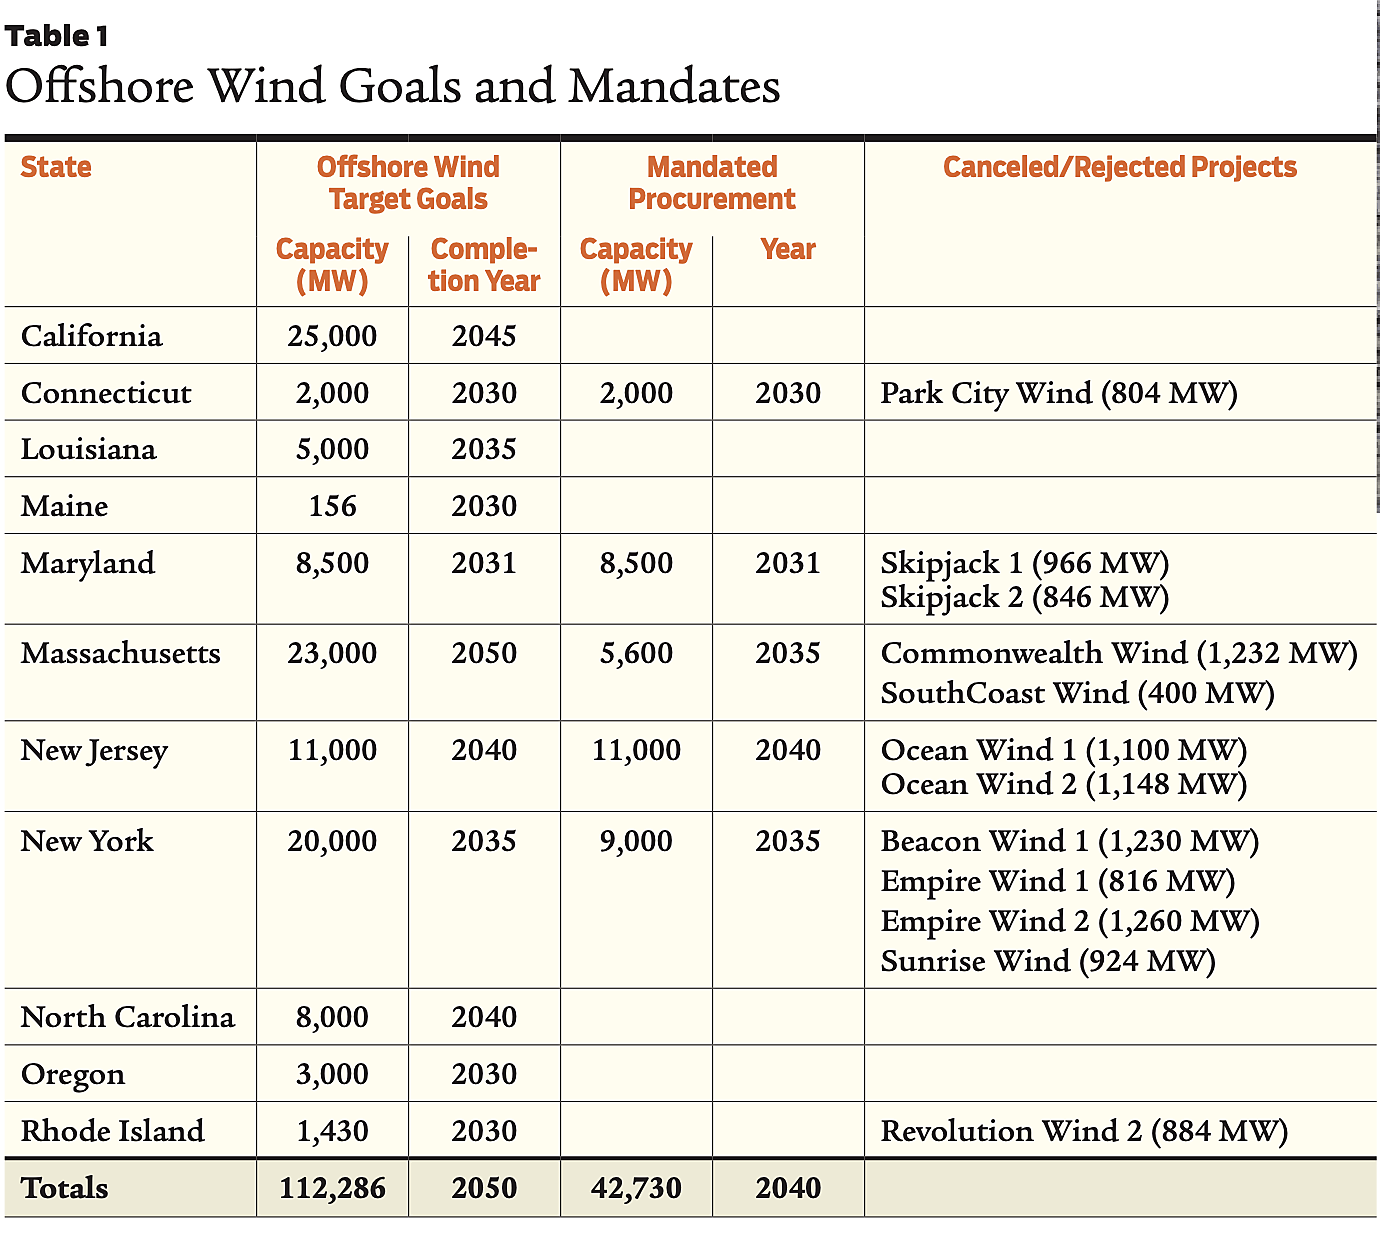
As shown in Table 1, 11 coastal states have embraced offshore wind via gubernatorial executive order, legislation, and aspirational goals. Of those, five Atlantic Coast states—Connecticut, Maryland, Massachusetts, New Jersey, and New York—have offshore wind mandates totaling almost 43,000 megawatts (MW).
The mandates were all enacted, either through legislation or executive order, before the COVID pandemic, when inflation was minimal and interest rates were near zero, where they had remained since the Federal Reserve’s quantitative easing that began in late 2008 in response to the global financial “meltdown.” But those financial conditions have now changed, severely worsening the already dismal economics of offshore wind generation. As a result, several proposed projects have either been rejected or canceled. For instance, Denmark-based wind generator Ørsted canceled its Ocean Wind 1 and 2 projects in New Jersey, even after being awarded an additional $1 billion in tax credits that were supposed to be returned to that state’s electric ratepayers. The firm also canceled the contracts for Skipjack 1 and 2 off the Maryland coast. Equinor and BP canceled their joint Empire Wind 2 project. Numerous other projects have requested large increases to their previously agreed-on contract prices.
Auctions and the Winner’s Curse
Through their public utility commissions or, in New York, the New York State Energy Research and Development Authority, the five states with wind mandates have held auctions in which developers submitted bids for specific projects after those developers had secured leases along the outer continental shelf that were held by the federal Bureau of Ocean Energy Management. The project bids all included long-term purchase power agreements (PPAs), all at prices that were far greater than wholesale market prices. Some developers included annual price increases to account for future inflation in their bids; other developers bid fixed prices for the duration of the 20- and 25-year contracts. States also threw in additional incentives. New Jersey, for example, spent almost $500 million to refurbish a port on the Delaware River for use as a construction staging area. New York pledged $700 million to build a port on the Hudson River near Albany, 120 miles north of New York City, along with a wind tower manufacturing facility.
But, as noted, the pandemic and the subsequent massive federal spending spree caused breaks in supply chains and unleashed long-dormant inflation, economically hampering these projects. Moreover, as offshore wind development worldwide has increased, so has the demand for raw materials, especially rare earth minerals used in manufacturing wind turbines, as well as more mundane products like cement and steel. Prices have soared, helped along by China’s dominance of critical mineral supplies and processing.
In addition to the growing cost of materials, the increasing size of the newest and largest turbines to be installed—which weigh over 800 tons and stand 850 feet—require specialized and costly ships like the jack-up rigs used for offshore oil drilling. There are fewer than 10 such ships in the world, most of which are in use in Europe and China. Moreover, the Jones Act, a 1920 protectionist relic, requires that goods shipped between U.S. ports be transported on U.S. vessels. (See “Does the Jones Act Endanger American Seamen?” Fall 2017.) Only one such installation ship, aptly named the Charybdis, is Jones Act–compliant, and it will not be delivered until late this year or early 2025.
The inadequacy of several offshore wind developers’ pre-COVID bids became apparent last summer. The developers of two projects in Massachusetts—Commonwealth Wind, which had offered a first-year PPA price of $59.60 per megawatt-hour (MWh), increasing by 2.5 percent annually for the 20-year contract term, and SouthCoast Wind, which offered a fixed price of $76.73/MWh for all 20 years—asked the state to raise their PPA contract prices to reflect higher development costs. The developers appeared to have succumbed to the well-known “winner’s curse” in which, in their zeal to win, auction bidders end up paying an above-market price for an item they wish to obtain or, as in the case of offshore wind, agree to sell a product at a price that does not reflect their actual costs.
The developers of Commonwealth Wind and SouthCoast Wind petitioned the Massachusetts Department of Public Utilities to void their signed contracts. When that effort failed, the developers eventually reached agreements with the state’s electric utilities, paying over $100 million in total to exit the existing contracts. Both developers intend to rebid the projects, at far higher prices, in subsequent auctions.
Similar failures took place in Connecticut, where the developer of Park City Wind paid $16 million to the state to void its PPA contract. And in New York, the developers of four projects failed to convince the state’s public service commission to raise their agreed-on PPA prices by an average of around 50 percent. As of this writing, the developers of Empire Wind 2 have canceled their contract. The remaining three contracts also are expected to be canceled and, as in Massachusetts, rebid in a future auction.
The True Cost of Offshore Wind Subsidies
The efforts by offshore wind developers to cancel their PPA contracts or increase the above-market prices those contracts reflect have taken place despite the generous federal investment tax credit (ITC) of 30 percent for offshore wind projects. (An additional 10 percent credit is available for projects meeting domestic content thresholds. Developers have lobbied to relax or eliminate the content thresholds to obtain the additional credit based on the alleged economic benefits and, especially, jobs the projects will provide.) However, the above-market PPA prices and the federal ITC subsidies mean that the annual cost to taxpayers and electric ratepayers will be millions of dollars for every job created.
The U.S. Energy Information Administration’s (EIA) 2023 average overnight capital cost (i.e., absent all financing costs) estimate for offshore wind that comes online in 2026 is just over $5,300/kilowatt (kW) in 2022 dollars. The EIA then adds a 25 percent technology factor for the first units constructed because construction costs for such units tend to be underestimated, which raises this average to about $6,700/kW. The EIA also estimates regional differences in the costs, ranging between $6,000/kW and $10,000/kW. For example, the EIA’s estimate for offshore wind in New England is $7,800/kW. The agency’s estimate for the coast of northern California, where floating wind turbines will be required to compensate for the rapid increase in ocean depth, is over $10,000/kW.

Using the EIA’s $5,300/kW value, the 42,730 MW of mandated offshore wind procurements along the Atlantic Coast would have an overnight capital cost of $226 billion in 2022 dollars. The resulting ITC subsidy (ignoring developers’ attempts to qualify for the additional 10 percent credit) would amount to $68 billion. That amount ignores the costs of financing this debt, which given rapid increases in U.S. deficits is likely to be substantial.
An estimate of these financing costs can be developed as follows: Current yields on US Treasury bonds are around 4.3 percent, having been 5 percent recently. As the US deficit—which at 130 percent of gross domestic product is higher than it has ever been—continues to rise, upward pressure on interest rates will continue. (Alternatively, if the Federal Reserve attempts to lower interest rates by increasing the money supply, the value of the US dollar will fall relative to other currencies, increasing costs for materials needed for offshore wind projects.)
If one assumes interest rates on Treasury bonds will remain constant at 5 percent over time, then the finance costs of ITC credits for offshore wind will depend on how long the bonds will be refinanced. At one extreme is an assumption that bonds will be refinanced forever, an assumption that is implausible. At the other extreme is that government spending will be funded solely with higher income taxes, an assumption that is also implausible. Instead, assume that the estimated $68 billion in ITC payments for offshore wind is financed with a one-time issuance of 10-year Treasury bonds. Then, after the bonds mature, the interest and principal will be paid through higher tax collections.
Currently, about 78 percent of all US debt is held by the American public. Interest on Treasury bonds is taxed only at the federal level. The Tax Foundation reports that the top 50 percent of taxpayers account for 98 percent of all income taxes paid and pay an average rate of 14.8 percent. Hence, approximately 11 percent (78 percent × 14.8 percent) of interest payments will be recovered through income tax collections. Consequently, the cost of financing the $68 billion in ITC credits will be ($68 billion) × [(1 + (1 – 0.11) × (0.05))10 – 1] = $37 billion, and the overall cost of the ITC subsidies will be $105 billion. Hence, under these financing assumptions, the ITC subsidy increases by about 55 percent.
Job Creation and Subsidy Estimates
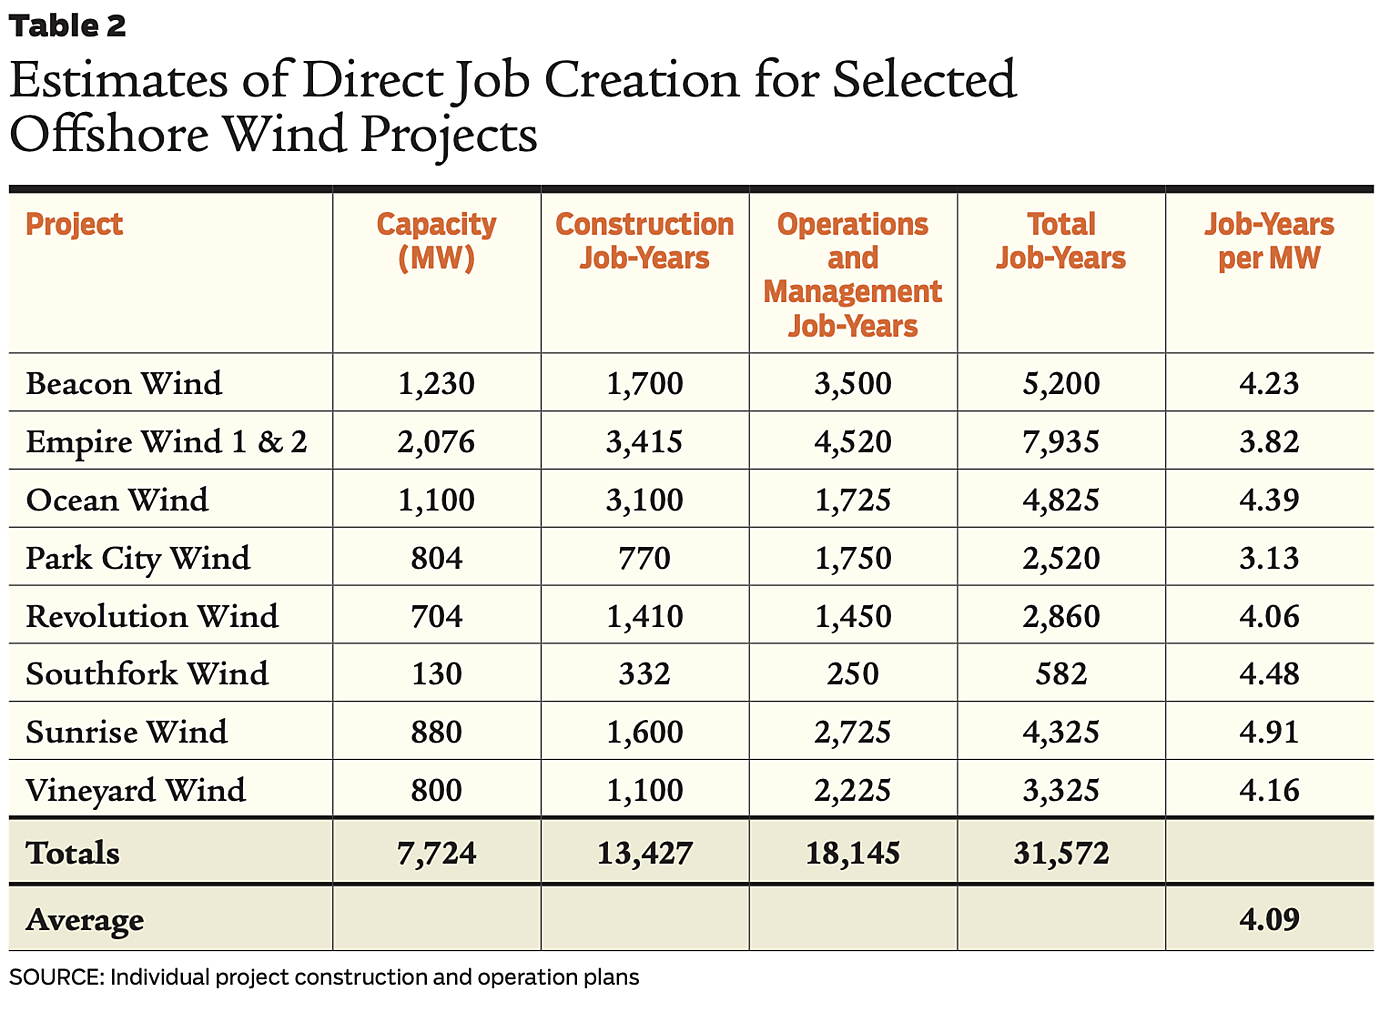
Using information submitted by developers in the required Construction and Operations Plans they must file with the Bureau of Ocean Energy Management, it is possible to estimate the resulting direct jobs that developers claim their projects will create and the resulting costs per job created. For example, in the filing for the now-canceled Ocean Wind 1, Ørsted claimed the project would require an average of 1,550 construction workers for the two-year estimated construction period plus 69 operations and maintenance workers for the project’s estimated 25-year life. In total, this amounts to 4,825 job-years (i.e., full-time equivalent jobs for one year). The developers of Sunrise Wind estimated the project would require 800 construction workers for the two-year construction period plus 109 operations and management workers over the project’s lifetime.
Using the average value for direct job-years per MW shown in Table 2, the 42,730 MW of state-mandated offshore wind would create approximately 175,000 job-years. With a direct ITC subsidy of $68 billion, the direct cost to American taxpayers for each job-year would be $389,000 (in 2022 dollars) per job-year. With additional financing expenses for the ITC subsidies, the cost would increase to over $603,000 (2022 dollars) per job-year, an amount far larger than the wages construction and operations workers will be paid.
Of course, offshore wind subsidies are not limited to the federal ITC of 30 percent (or more). The long-term and above-market PPA contracts are themselves subsidies paid by electric ratepayers. The value of the subsidy for a given offshore wind project will equal the difference between the annual PPA price and the wholesale electric price, multiplied by the quantity of electricity the project generates, per year of the PPA contract term. (This excludes the costs of additional backup generation and storage required to “firm-up” inherently intermittent offshore wind availability.)
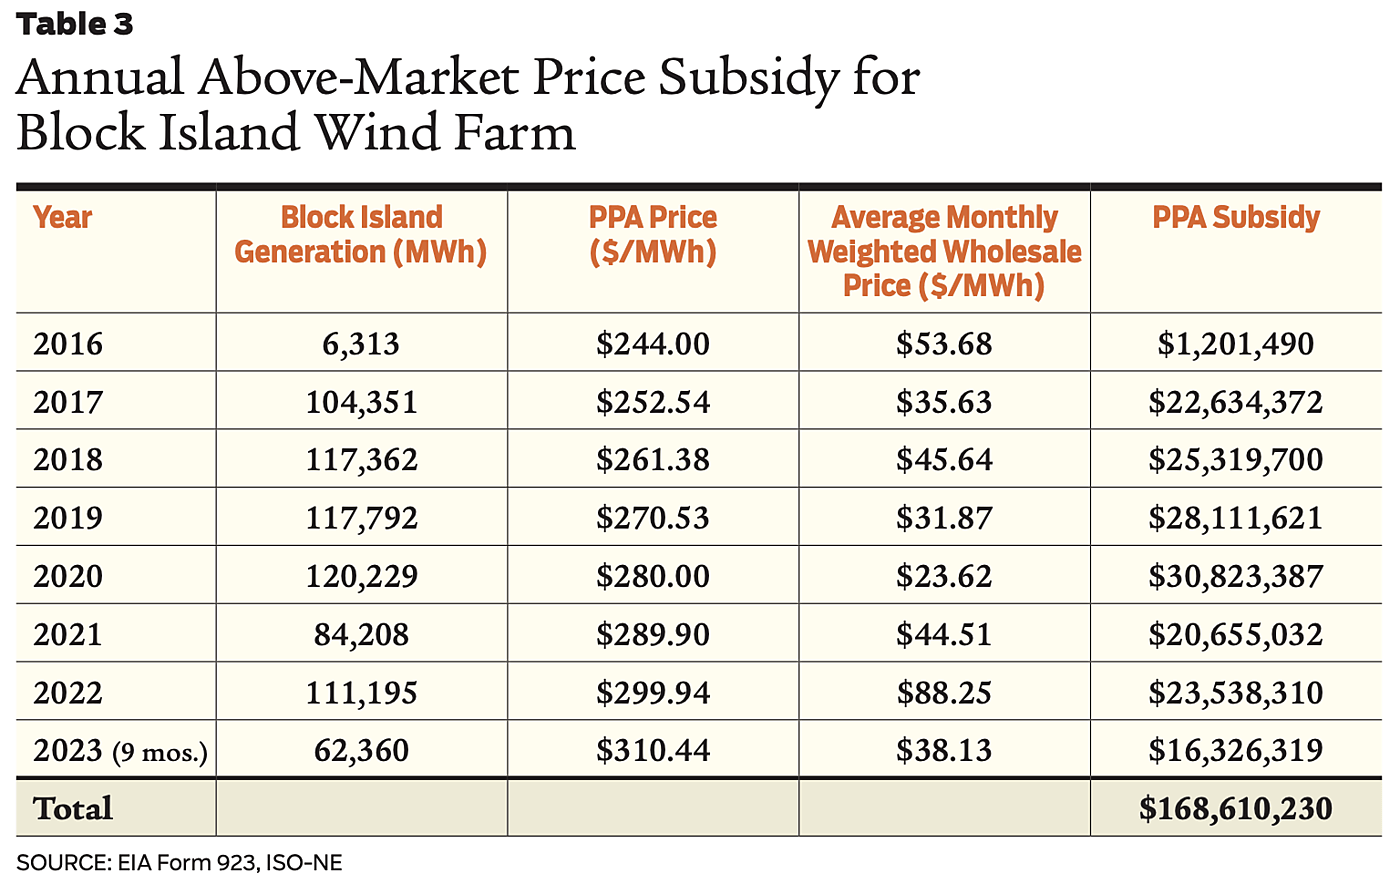
For example, the five-turbine, 30-MW Block Island Wind Farm, which is located off Block Island, RI, has been operational since December 2016 and is the only operational wind farm along the Atlantic Coast. Using the average monthly wholesale electric prices for New England’s independent system operator’s Rhode Island zone and monthly generation data published by the EIA, the annual subsidy for the wind farm can be calculated, as shown in Table 3. Through September 2023, the subsidy totals almost $169 million. Based on total electric consumption in Rhode Island for the first nine months of 2023, the $16.3 million subsidy amounted to an additional 2.9¢/kWh charge for customers. Based on average residential customer consumption of about 5,200 kWh through the first nine months of 2023, the subsidy amounts to an increase of $150 per customer. On an annualized basis, this amounts to a $200 tax on a typical residential customer’s electric bill.
Estimating PPA Subsidies per Job-Year
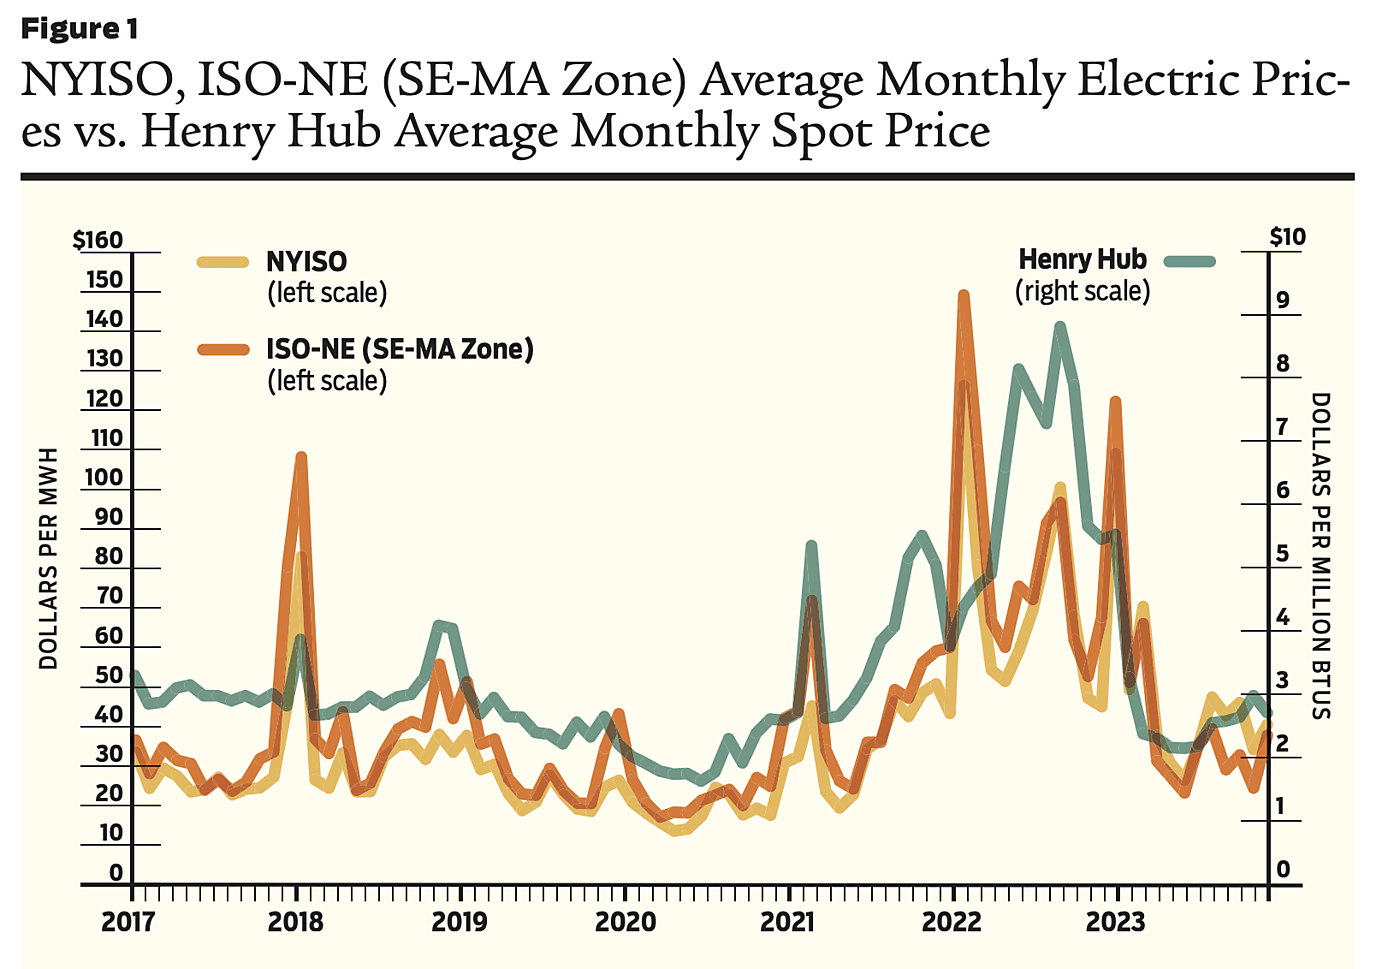
Similar calculations can be made based on the PPA contracts for other offshore wind farms by developing a long-term forecast of wholesale electricity prices. As shown in Figure 1, New York and New England wholesale electricity prices are highly correlated with natural gas prices. The reason for the high correlation is that natural gas generators typically set the market price during most hours of the day.
To forecast future wholesale electricity prices, I used a simple regression model of wholesale electricity prices as a function of average monthly Henry Hub natural gas spot market prices, monthly loads, and a time trend for the 92-month period between January 2017 and November 2023. The resulting price forecasts for the Southeast Massachusetts Zone in New England and New York are shown in Figure 2. These forecasts can then be used to estimate the magnitude of the PPA subsidies for different offshore wind projects.
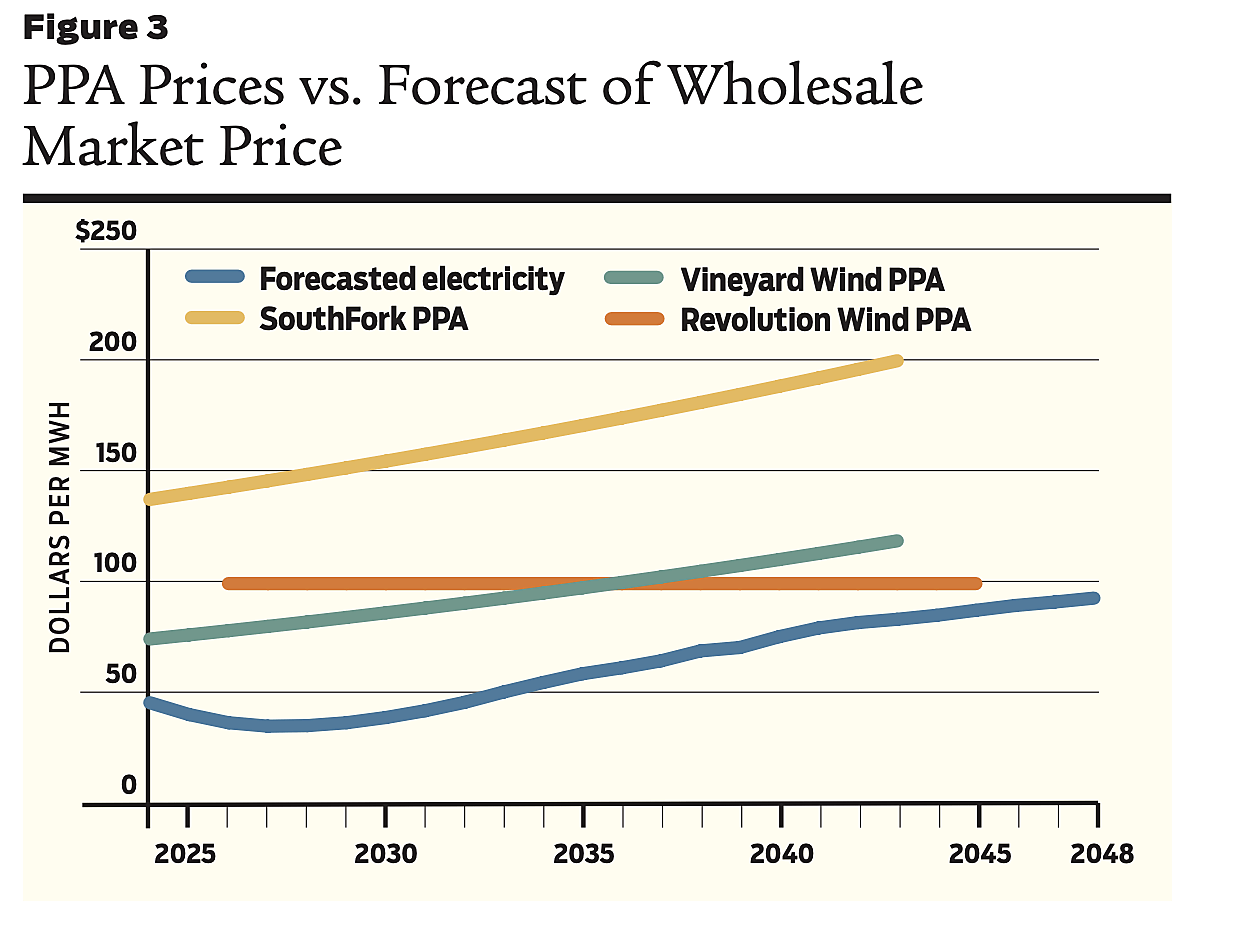
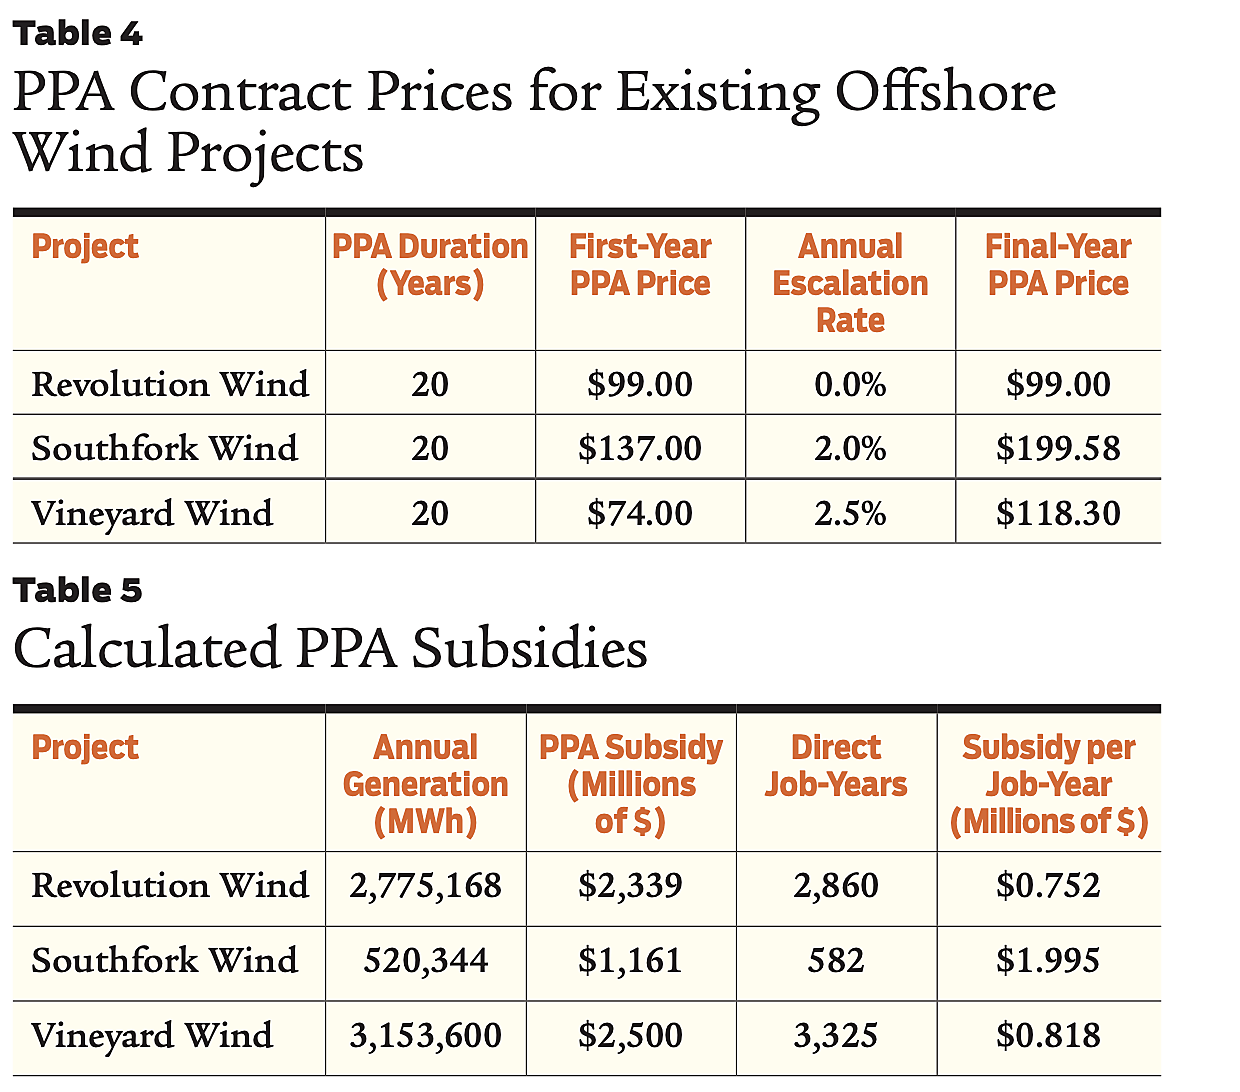
There are only three offshore wind projects that have not either been canceled or sought increases to their PPA contract prices. They are: Southfork Wind, which began operations in December 2023, Vineyard Wind, which is scheduled for completion late this year, and Revolution Wind, which is supposed to be completed sometime in 2025. The PPA contract terms for these three projects are summarized in Table 4. A comparison of the PPA prices relative to the forecast wholesale electric prices is shown in Figure 3.
As Figure 3 shows, the PPA prices for the three projects are all above the forecasted wholesale market prices for electricity for the contracts’ entirety. Based on each project’s expected annual generation (which is based on the EIA’s assumed 45 percent annual capacity factor for offshore wind) and the wholesale price forecast, we can calculate the projects’ total PPA-related subsidies and, using the published job-year values in Table 2, calculate the subsidies per job-year. These numbers are shown in Table 5. The subsidies per job-year that result from the above-market PPA prices range from $750,000 for Revolution Wind to $2 million for Southfork Wind. Although the developers for the other offshore wind projects have announced their intention to rebid their projects at higher prices, as of this writing the results of these new auctions and the agreed-on PPA prices have not been made public. Hence, it is not possible to calculate the PPA-related subsidies for these projects or other projects that have been selected. However, given that the developers of the four New York offshore wind projects requested PPA price increases that averaged almost 50 percent, it is likely that the $2 million subsidy per direct job-year estimate for the Southfork Wind project will be representative of the subsidies for rebid or new projects selected.
Estimating the ITC Subsidies
per Job-Year
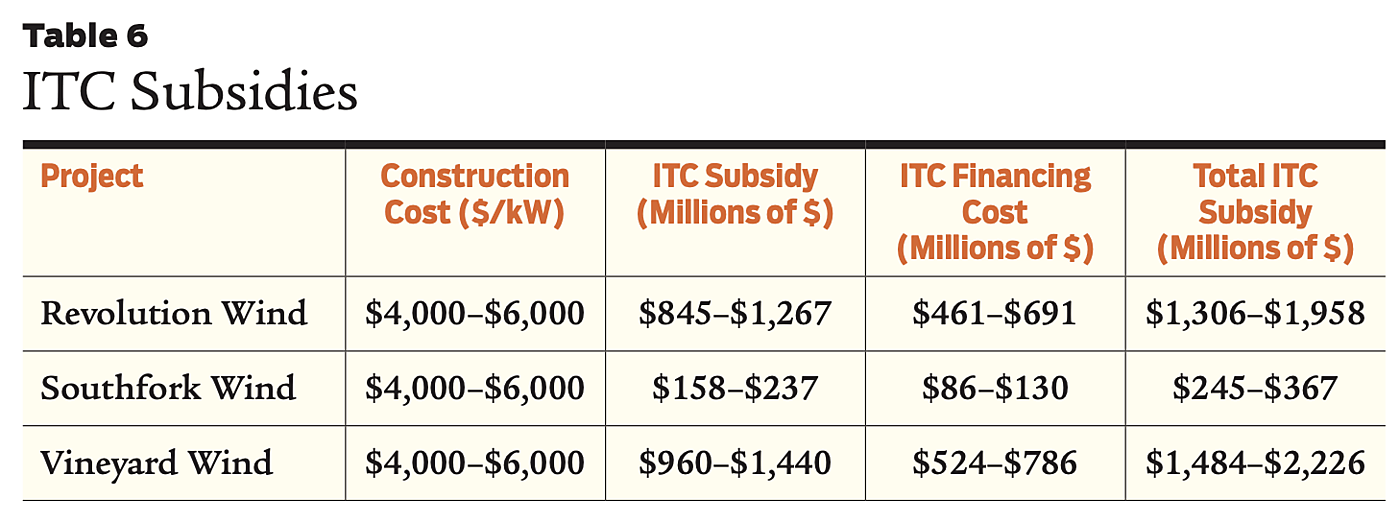
The PPA-related subsidies can be added to the estimated ITC subsidies to calculate the total subsidies per job-year for the three wind projects. Construction cost data for offshore wind projects are not available publicly, so ITC subsidies must be calculated for a range of assumed overnight capital costs based on the EIA’s $5,300/kW value, including the costs of financing the subsidies with 10-year US Treasury bonds at an assumed coupon rate of 5 percent. The low-end overnight capital cost value of $4,000/kW is 25 percent lower than the EIA’s 2022-dollar value, and the high-end capital cost of $6,000/kW is 13 percent higher. Given increasing materials and installation costs, it seems unlikely that overnight capital costs for future wind farms will decrease, much less decrease by 25 percent in real terms. The resulting ITC subsidy amounts are shown in Table 6.
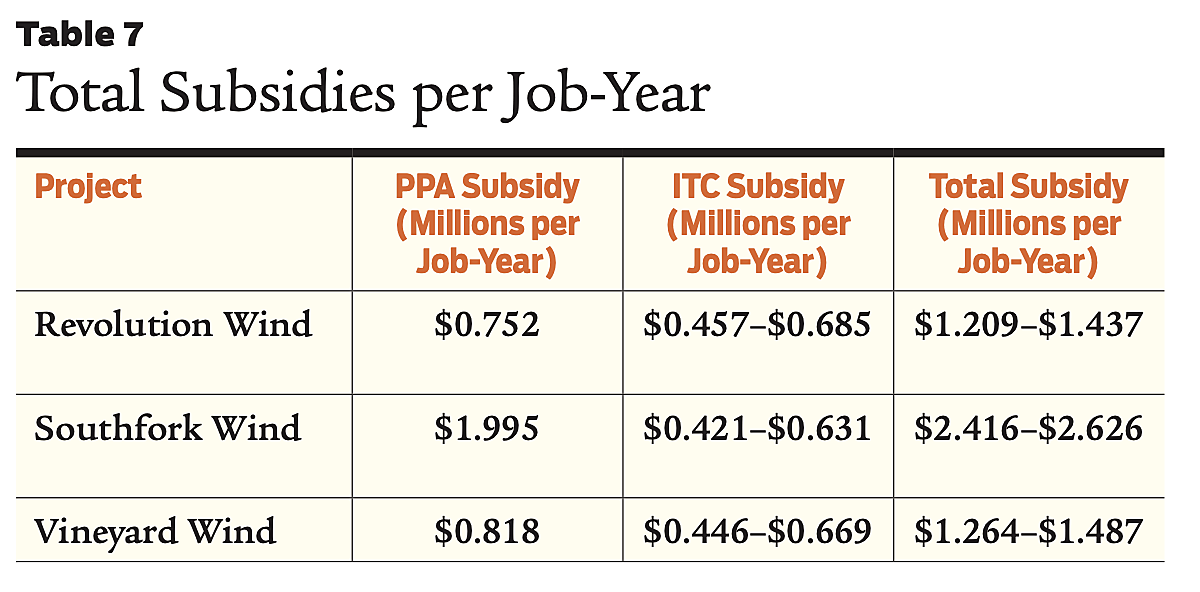
Using the job-year data from Table 2, the resulting ITC subsidies per job-year can be calculated. As shown in Table 7, using the assumed range of overnight capital costs, these range between $421,000 and $685,000 per job-year. Adding those values to the PPA-related subsidies per job-year shown in Table 5, the total subsidies per job-year can be calculated.
As Table 7 shows, the resulting overall subsidies per job-year range between $1.2 million and $2.6 million. Hence, for these three projects, the cost to society for each direct offshore wind job will be many times greater than the actual salaries of the individuals who will be employed.
Supporters of offshore wind may criticize the Table 7 job-year cost estimates for failing to factor in the indirect and induced jobs created. Indirect jobs are those created by increased demand for materials needed in construction and operation. Induced jobs are those that result from the additional spending by consumers. For example, the demand for cement for foundations will require additional output by cement manufacturers, which will mean additional employees. That is an indirect effect. The employees hired by offshore wind developers and the additional employees hired indirectly will spend a portion of their earnings on goods and services, increasing demand and jobs by an additional amount.
The problem with claims regarding the additional indirect and induced jobs that offshore wind development will create, such as those published in offshore wind projects’ filings with the Bureau of Ocean Energy Management, is that they fail to account for the jobs that will be lost because of the increased retail cost of electricity that businesses and households will pay to recover the above-market PPA costs. Higher electric bills mean businesses will have less money available for investment. It may lead to businesses shutting down or relocating to regions with lower-cost electricity, as the deindustrialization taking place in Europe shows. Higher electric bills will also mean households will have less money to spend on other goods and services. Those contractionary effects will exceed the indirect salutary job effects of offshore wind development.
Conclusions
The overarching economic fallacy of justifying green energy subsidies for offshore wind—or any subsidy—based on promises of new jobs is that an investment’s economic value is not measured by the number of jobs it creates. The purpose of investing in electric generating resources and related infrastructure is to ensure that electricity supplies are adequate, affordable, and reliable. The purpose is not to create jobs. If it were, then the highest-value energy resources would be the most labor-intensive ones.
In any industry, employers will hire employees so long as the additional economic value is greater than the cost of hiring them. Creating “make-work” jobs, often called “featherbedding,” increases costs without commensurate benefits and thus reduces economic value. In the case of offshore wind, consumers and taxpayers are being forced to subsidize projects with a system of tax credits, federal and state mandates, and above-market price PPAs that will cost hundreds of billions of dollars. Although these subsidies will create new jobs for developers and their employees, the net effect will be reduced economic growth and fewer jobs, as the experience in Europe shows.
The reason is simple: it is impossible for a system of green energy tax credits and other subsidies to increase economic growth. Forcing consumers and taxpayers to subsidize offshore wind jobs at a cost of several millions of dollars per job each year—far more than the workers will be paid—cannot increase overall economic growth and employment. Europe is learning this lesson through bitter experience. As green energy investments have increased in Great Britain and Germany, electricity prices there have soared, leading to deindustrialization as energy-intensive industries either shut down or relocate to other countries with lower electricity costs.
State and federal politicians and policymakers may wish to ignore basic economic principles in favor of political expediency. However, those principles will not ignore them. Eventually, the profligate spending on costly but low-value offshore wind generation will collapse under its own economic weight. The key unanswered question is this: how high an economic and social price will the United States—and especially coastal states—pay for this folly before that occurs?

This work is licensed under a Creative Commons Attribution-NonCommercial-ShareAlike 4.0 International License.