There is much variation in the unemployment rate across the states. Barely 3 percent of North Dakotans who are looking for work do not currently have a job, yet more than 9 percent of Mississippians, Illinoisans, and Nevadans who want a job do not have one.
There are many reasons why unemployment can vary across states. Unemployment varies across demographic groups—younger people and black people have higher unemployment rates than older people and white people, respectively. As a result, demographic differences across states can be associated with interstate variation in unemployment.
Likewise, there can be state-specific effects that lead to unemployment differences. For example, part of Nevada’s high unemployment rate is likely a hangover from the housing bust in Las Vegas. On the other hand, the oil and gas boom in North Dakota has pushed down that state’s unemployment rate.
It is also possible that the variation in labor market conditions across states is partly attributable to differences in economic freedom. This is the question we examine in a paper that will appear in this October’s Contemporary Economic Policy.
Economic freedom means that workers and entrepreneurs can engage in mutually beneficial dealings without interference from high taxes, big government, and heavy regulation of labor markets. Conveniently, the Fraser Institute’s Economic Freedom of North America (EFNA) reports provide an annual index of economic freedom for each state dating back to 1981. Each state is rated on a scale from 1 to 10, with a higher EFNA rating indicating more economic freedom.
Before turning to a summary of our paper’s statistical analysis, consider Figure 1, which depicts each state’s EFNA rating and its unemployment rate. (The data are for 2010, the most recent year the economic freedom index is available.) As the plotted line indicates, there is a strong negative relationship between economic freedom and unemployment. That the fit is somewhat noisy, rather than being tightly clustered around the plotted line, is not surprising because this simple plot does not control for any of the other factors that might affect unemployment rates.
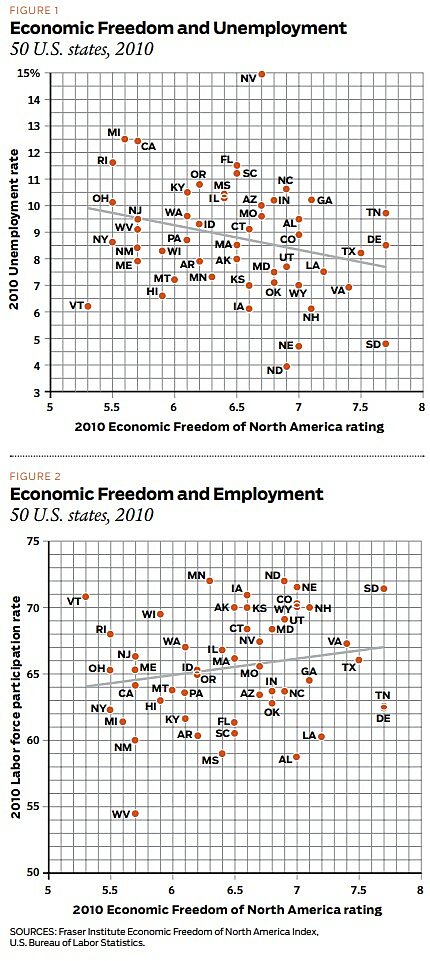
There are some well known limitations to the unemployment rate as an indicator of labor market conditions. For example, people who are no longer seeking work do not count as being unemployed. However, Figure 2 shows that a similar relationship exists between the labor force participation rate and a state’s EFNA rating. The plotted line indicates that more economic freedom is associated with more favorable labor market conditions—in this case, a higher labor force participation rate. (For brevity, we restrict the remainder of our discussion to the relationship between economic freedom and unemployment, but the relationship also exists with labor market indicators such as the labor force participation rate and the employment-to-population ratio.)
In our Contemporary Economic Policy paper, we examine the relationship between economic freedom and labor market outcomes from 1981 to 2009 (the most recent year available at the time we wrote the paper) while controlling for factors including natural resource endowments, demographic differences, and educational attainment. Since there is substantial variation across states in several of these factors, controlling for them is important to be sure that the relationships depicted in Figures 1 and 2 are not spurious, as well as to make sure that these factors are not camouflaging even stronger relationships than those depicted in the figures. In order to be confident in our results, we also estimate several alternative specifications as robustness checks. These include controlling for “right to work” states, net federal tax inflows or outflows, geographic factors such as being located on a coast or border, and state-specific fixed effects to control for persistent (but hard to parameterize) factors present in each state.
Regardless of specification, our findings show a strong relationship between economic freedom and unemployment across the states even after controlling for other factors affecting labor market conditions. Our estimates indicate that a one-point increase in a state’s EFNA rating is associated with a decrease of 0.6 to 1.4 percentage points in a state’s unemployment rate depending on specification.
That our results confirm a negative relationship between economic freedom and the unemployment rate is not surprising. A large body of research across countries shows the same pattern: countries with more economic freedom have lower unemployment rates. More generally, the positive relationship between economic freedom and economic growth is well-documented and job creation goes hand-in-hand with economic growth.
The implication for policymakers is clear. Consider Michigan, California, and Rhode Island. All have EFNA scores between 5.5 and 5.7, which place them among the least economically free states, and all have unemployment rates above 8.3 percent. Those states could shave about a percentage point off their unemployment rates simply by adopting policies more like their neighbors Indiana, Arizona, and Connecticut, which score about a point better on the EFNA index and rank just above the middle of the 50 states.
While the regulatory and tax policies coming out of Washington present a strong headwind for all states’ labor markets, our results indicate that governors and legislators who choose high government spending, incentive-killing marginal tax rates, and job-killing labor market regulations are also to blame for their residents’ labor market difficulties.

This work is licensed under a Creative Commons Attribution-NonCommercial-ShareAlike 4.0 International License.