I am Paul C. Knappenberger, Assistant Director of the Center for the Study of Science at the Cato Institute, a nonprofit, non-partisan public policy research institute located here in Washington DC, and Cato is my sole source of employment income. Before I begin my testimony, I would like to make clear that my comments are solely my own and do not represent any official position of the Cato Institute.
For the past 25 years, I've conducted research on topics of climate and climate change including hurricanes, heat-related mortality, and temperature trends as well as worked to quantify the projections of human-caused climate change.
This last topic, specifically how it relates to the proposed Keystone XL pipeline, will be the subject of my testimony.
When I refer to climate change in these remarks, I am specifically referring to that climate change which may occur as a result of human emissions of greenhouse gases, primarily carbon dioxide. Climate change may (and does) occur from other influences as well, both human and natural. But the primary concern raised over the Keystone XL pipeline involves the carbon dioxide emissions resulting from the burning of the oil that the pipeline will carry. So it is the potential climate change from these emissions that will be focus of my testimony.
In its Draft Environmental Impacts Statement (DEIS), the State Department has done a good job in quantifying the extra emissions that result from the extraction, transportation, refining, and eventual end use of the oil which will be transported by the Keystone XL pipeline. They find, and I think that there is broad agreement on this point, that a barrel of oil produced from the Canadian tar sands has about a 17 percent carbon dioxide emissions premium compared to the average barrel of oil finding its way into the U.S. market.
The emissions premium primarily arises from the relatively energy-intensive manner in which tar sands oil is currently extracted. In the DEIS, the State Department points out that this emissions premium may well shrink over time as new extraction methodologies are developed, as extraction in other regions, such as Saudi Arabia, becomes more energy intensive, or depending on the type of oil that is ultimately displaced by the oil carried by the Keystone XL pipeline.
The disagreement between the State Department, the Environmental Protection Agency, and several environmental groups, involves how many new carbon dioxide emissions this current 17 percent per barrel premium results in when applied to the 830,000 barrels of oil that the Keystone XL pipeline will carry each day when operating at full capacity.
The State Department concludes that the demand for the tar sands oil is great enough that it will come to market whether or not the Keystone XL pipeline is ever built. It thus finds very few additional carbon dioxide emissions resulting from the pipeline project—somewhere in the range of an additional 0.1 to 5.3 million metric tons of carbon dioxide emissions per year over the case where the pipeline is not built.
The EPA contends that the State Department is too quick to come to such a conclusion. The EPA suggests that without the pipeline, much of that oil will remain in the ground. Therefore, if the pipeline were to be built, oil would be produced from the tar sands to meet its capacity. While this won't result in more oil being used in the U.S., it will result in a 17 percent carbon dioxide emissions premium applied to the 830,000 barrels per day of delivered oil. The EPA cites an extra 18.7 million metric tons of carbon dioxide emissions per year over the situation of no pipeline.
Several environmental organizations take the view that while the Keystone XL pipeline may not increase the amount of oil used in the U.S., the oil that it displaces from the U.S. market will be consumed by other countries as the global demand for oil continues to grow. Thus, they calculate the full emissions from the 830,000 barrels per day plus the 17 percent emissions premium, and arrive at an additional 181 million metric tons of carbon dioxide emissions per year resulting from the existence of the Keystone XL pipeline.In terms of carbon dioxide emissions, these differences may appear large and contentious, and, in fact, much of the protestation involving the Keystone XL pipeline focuses on these emissions numbers.
But, these protests are largely misplaced.
It is very important to keep in mind that the end game is climate change and the potential need of climate change mitigation. Carbon dioxide emissions are not climate change. They influence climate change, but they are not a measure of it.
Therefore, before any type of assessment as to the potential climate impact of the Keystone XL pipeline can be made, it is essential to translate the additional carbon dioxide emissions that may result from it into climate units—such as the global average temperature. In other words, how much global warming will the Keystone XL pipeline produce?
Isn't that what everyone wants to know?
Why is it then, that such numbers are never given?
It is not as if there is no good way of calculating them—that is precisely what climate models are designed to do. These complex computer programs emulate the earth's climate system and allow researchers to change various influences upon it—such as adding additional carbon dioxide emissions—and seeing what the end effect is. These climate models produce the projections of future climate change from human activities that we are all familiar with using precisely this methodology.
General circulation climate models are very complex and computational expensive to run (both in time and money) and as a result have not been used to generate the global temperature effects of the Keystone XL pipeline.
However, in lieu of running a full climate model, climate model emulators have been developed which can run on a desktop computer. One such program is MAGICC, the Model for the Assessment of Greenhouse-gas Induced Climate Change. MAGICC is a climate model simulator developed by scientists at the U.S. National Center for Atmospheric Research under funding by the U.S. Environmental Protection Agency and other organizations.
MAGICC is itself a collection of simple gas-cycle, climate, and ice-melt models that is designed to produce an output that emulates the output one gets from much more complex climate models. MAGICC can produce in seconds, on a personal computer, results that complex climate models take weeks to produce running on the world's fastest supercomputers. MAGICC doesn't provide the breadth of output or level of detail that fully resolved climate models do, but instead simulates the general, broader aspects of climate change such as the global average temperature.
Moreover, MAGICC was developed, according to MAGICC's website, "to compare the global-mean temperature and sea level implications of two different emissions scenarios." So, using MAGICC to compare the climate change that is projected to result from the different Keystone XL pipeline carbon dioxide emissions scenarios fits precisely into the program's designed purpose.
Using MAGICC, I (and anyone else) can calculate the potential impact of the Keystone XL pipeline on the global average temperature based on the various carbon dioxide emissions estimates, and produce results very similar to ones that would be achieved by using a full climate model. In the base case, I run MAGICC using a mid-range, business-as-usual future emissions scenario as defined by the IPCC (SRES A1B). To examine the climate change impact using the EPA's Keystone XL carbon dioxide emissions scenario, I add 18.7 million metric tons per year to the global carbon dioxide mission total each year beginning in the year 2010 and continuing through the year 2100. To assess impact of the emissions scenario preferred by some environmental organizations, I add 181 million metric tons of additional carbon dioxide emissions to the global total beginning in 2010 and extending through 2100.
When running MAGICC as described, I find that no matter how the additional carbon dioxide emissions are calculated, the Keystone XL pipeline has an exceedingly and inconsequentially small impact on projected the course of global temperature.
In the case of the State Department's analysis, as there are very few additional carbon dioxide emissions, there is essentially no associated change in the global climate. The change in global average temperature resulting from the EPA's additional 18.7 million metric tons of carbon dioxide emissions per year from the Keystone XL pipeline, would be about 0.00001°C per year—that is one one-hundred thousandths of a degree. The 181 million metric tons per year from the assumption that all Keystone XL oil is additional oil in the global supply would result in about 0.0001°C of annual warming—one ten-thousandths of a degree.
In other words, if the Keystone XL pipeline were to operate at full capacity until the end of this century, it would, worst case, raise the global average surface temperature by about 1/100th of a degree Celsius. So after nearly 100 years of full operation, the Keystone XL's impact on the climate would be inconsequential and unmeasurable.
And even these tiny numbers are probably overestimates. In calculating them, I used the MAGICC default value for the magnitude of the earth's equilibrium climate sensitivity. A value, 3°C, that was based on the assessment of the equilibrium climate sensitivity given by the Intergovernmental Panel on Climate Change (IPCC). The equilibrium climate sensitivity is the amount that the earth's surface temperature will rise from a doubling of the pre-industrial atmospheric concentration of carbon dioxide. As such, it is probably the most important factor in determining whether or not we need to "do something" to attempt to mitigate future climate change. The lower the climate sensitivity, the less the temperature rise from human carbon dioxide emissions, and the lower the urgency to try to reduce them. If the sensitivity is low enough, carbon dioxide emissions confer a net benefit.
And despite common claims that the "science is settled" when it comes to global warming, we are still learning more and more about the earth complex climate system—and the more we learn, the less responsive it seems that the earth's average temperature is to human carbon dioxide emissions.
For example, the observed lack of statistically significant temperature rise over the past 16 years (and counting), is strong indication that climate models have a tendency to overestimate the amount of warming resulting from human greenhouse gas emissions (Figure 1).
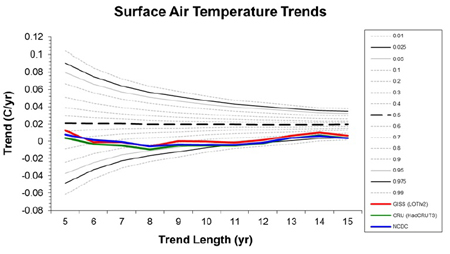
Figure 1. Current (ending in December 2012) trends in three observed global surface temperature records of length 5 to 15 years (colored lines) set against the probability (gay lines) derived from the complete collection of climate model runs used in the IPCC Fourth Assessment Report under the SRES A1B emissions scenario (Knappenberger and Michaels., 2013).
I was involved in research that we published more than a decade ago pointing out that global temperatures were not rising as fast as climate model expectations (Michaels et al., 2002), and increasingly, there is a growing acknowledgement of this fact.
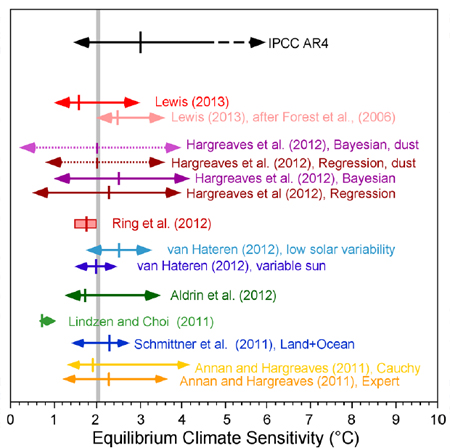
Figure 2. Climate sensitivity estimates from new research published since 2010 (colored, compared with the range given in the Intergovernmental Panel on Climate Change (IPCC) Fourth Assessment Report (AR4) (black). The arrows indicate the 5 to 95% confidence bounds for each estimate along with the best estimate (median of each probability density function; or the mean of multiple estimates; colored vertical line). Ring et al. (2012) present four estimates of the climate sensitivity and the red box encompasses those estimates. The right-hand side of the IPCC AR4 range is dotted to indicate that the IPCC does not actually state the value for the upper 95% confidence bound of their estimate and the left-hand arrow only extends to the 10% lower bound as the 5% lower bound is not given. The light grey vertical bar is the mean of the 14 best estimates from the new findings. The IPCC's "best estimate" (3.0°C) is 50% greater than the mean of recent estimates (2.0°C).
Over the past three years, a collection of findings in the peer-reviewed scientific literature has suggested that the IPCC's best estimate of the equilibrium climate sensitivity is likely too high by nearly 50 percent. Instead of the IPCC's 3.0°C, the new findings are indicating a value close to 2.0°C (see Figure 2).
Rerunning the MAGICC climate model simulator with an equilibrium climate sensitivity setting of 2.0°C, instead of the 3.0°C default value, drops the calculated warming impact from the Keystone XL pipeline by about 30 percent.
It is this information, not the information on carbon dioxide emissions that is required to properly assess the climate change aspect of the environmental impact of the Keystone XL pipeline.
In these terms, the difference between the State Department's Environmental Impact Statement and those of its critics all but vanish.
No matter whose carbon dioxide emissions estimate is used to calculate it, the climate impact of the oil carried by the Keystone XL pipeline is too small to measure or carry any physical significance.
In deciding the fate of the Keystone XL pipeline, it is important not to let symbolism cloud these facts.
References:
Aldrin, M., et al., 2012. Bayesian estimation of climate sensitivity based on a simple climate model fitted to observations of hemispheric temperature and global ocean heat content. Environmetrics, doi: 10.1002/env.2140.
Annan, J.D., and J.C Hargreaves, 2011. On the generation and interpretation of probabilistic estimates of climate sensitivity. Climatic Change, 104, 324-436.
Hargreaves, J.C., et al., 2012. Can the Last Glacial Maximum constrain climate sensitivity? Geophysical Research Letters, 39, L24702, doi: 10.1029/2012GL053872
Intergovernmental Panel on Climate Change, 2007. Climate Change 2007: The Physical Science Basis. Contribution of Working Group I to the Fourth Assessment Report of the Intergovernmental Panel on Climate Change. Solomon, S., et al. (eds). Cambridge University Press, Cambridge, 996pp.
Knappenberger, P.C., and P.J. Michaels, 2013. Policy Implications of Climate Models on the Verge of Failure. American Geophysical Union Science Policy Conference. Washington, DC, June 24-26, 2013, submitted.
Lewis, N. 2013. An objective Bayesian, improved approach for applying optimal fingerprint techniques to estimate climate sensitivity. Journal of Climate, doi: 10.1175/JCLI-D-12-00473.1.
Lindzen, R.S., and Y-S. Choi, 2011. On the observational determination of climate sensitivity and its implications. Asia-Pacific Journal of Atmospheric Science, 47, 377-390.
Michaels, P.J., Knappenberger, P.C., Frauenfeld, O.W., and R.E. Davis. 2002. Revised 21st century temperature projections, Climate Research, 23, 1-9.
Ring, M.J., et al., 2012. Causes of the global warming observed since the 19th century. Atmospheric and Climate Sciences, 2, 401-415, doi: 10.4236/acs.2012.24035.
Schmittner, A., et al. 2011. Climate sensitivity estimated from temperature reconstructions of the Last Glacial Maximum. Science, 334, 1385-1388, doi: 10.1126/science.1203513.
Wigley, T.M.L., et al. MAGICC/SCENGEN v5.3. Model for the Assessment of Greenhouse-gas Induced Climate Change/A Regional Climate Scenario Generator. http://www.cgd.ucar.edu/cas/wigley/magicc/
van Hateren, J.H., 2012. A fractal climate response function can simulate global average temperature trends of the modern era and the past millennium. Climate Dynamics, doi: 10.1007/s00382-012-1375-3.
About the Author
