Introduction
Over the past several years, economic inequality has risen to the forefront of American political consciousness. Politicians, pundits, and academics paint a picture of a new Gilded Age in which a hereditary American gentry becomes ever richer, while the vast majority of Americans toil away in near‐Dickensian poverty. As economist and New York Times columnist Paul Krugman puts it, “Describing our current era as a new Gilded Age or Belle Époque isn’t hyperbole; it’s the simple truth.”1
Political candidates have leapt on the issue. Hillary Clinton, the Democratic nominee for president, has made it one of the central themes of her presidential campaign, warning, “Inequality of the kind that we are now experiencing is bad for individuals, bad for our economy, bad for our democracy.“2 Her campaign speeches are laced with comments that “there is too much inequality” and “inherited wealth and concentrated wealth is not good for America.”3 She claims “Economists have documented how the share of income and wealth going to those at the very top, not just the top 1 percent but the top 0.1 percent, the 0.01 percent of the population, has risen sharply over the last generation.” And, echoing Krugman or Thomas Piketty, she says, “Some are calling it a throwback to the Gilded Age of the robber barons.”4
Republicans too, have tried to tap into concerns about rising inequality, albeit in more muted tones. Part of Republican nominee Donald Trump’s appeal has been an implicit criticism of an “unfair” system that has enriched some while leaving the broad middle class behind. And other candidates have laced their speeches with appeals to workers who have not participated in the economic gains of recent decades.
Polls show that the public believes that inequality is a problem. Sixty‐three percent of respondents to a 2015 Gallup poll said they felt that money and wealth in the country should be more evenly distributed.5 In a New York Times/CBS News Poll from last year, 65 percent of respondents said they thought the gap between the rich and poor in the country is a problem that needs to be addressed now.6
It’s a compelling political narrative, one that can be used to advance any number of policy agendas, from higher taxes and increases in the minimum wage to trade barriers and immigration restrictions. But it is fundamentally wrong, based on a series of myths that sound good and play to our emotions and sense of fairness, but that don’t hold up under close scrutiny.
MYTH 1. Inequality Has Never Been Worse
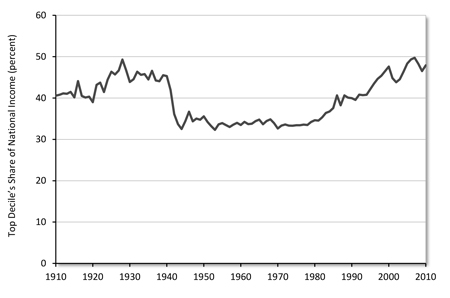
The basic premise for the current debate over inequality was perhaps best expressed by French economist Thomas Piketty in his widely cited 2014 book, Capital in the Twenty‐First Century.7 Piketty argues that income inequality in the United States is as high as it has been in a century, and is rising. His data (Figure 1) show that a high degree of inequality was, in fact, the rule throughout much of U.S. history, but plunged rapidly in the years following World War II.
Piketty credits this post‐war decline in inequality to a number of factors, such as the redistributionist policies of Franklin Roosevelt, high marginal tax rates on the wealthy (in particular high tax rates on capital), and the strength of the labor movement, among other things. But as these pillars of the modern welfare state have eroded, Piketty contends that inequality has risen. Today, it hovers just below its peak in 1930 (a small dip resulting from the recent recession), and is poised to rise to new heights. Piketty sees no end to this trend, ultimately “threaten[ing] our democratic institutions and values.”8
Figure 1. Income Inequality in the United States, 1910–2010, According to Piketty
Source: Thomas Piketty, Capital in the Twenty‐First Century (Cambridge, MA: The Belknap Press of Harvard University Press, 2014), Figure I.1.
There have, of course, been many critiques of Piketty’s methodology. For example, it has been noted that there is a lack of citations for some of his data. Chris Giles, economics editor for the Financial Times, notes that in calculating wealth share for the top 10 percent in the United States before 1950, “none of the sources Prof. Piketty uses contain these numbers, hence he assumes the top 10 percent wealth share is his estimate for the top 1 percent share plus 36 percentage points.… However, there is no explanation for this number, nor why it should stay constant over time.”9 Giles also argues that Piketty combines different data sources arbitrarily, using surveys of households in the United States versus estate tax data for Britain, for example.10 Piketty also appears to have arbitrarily added 2 percentage points to the share of wealth held by the top 1 percent of earners in the United States in 1970.11
Perhaps more significantly, Piketty insists that, over time, the return to capital always exceeds the overall growth of the economy—his famous “r > g” equation, his “fundamental force for divergence.”12 This forms the heart of his case: that the average rate of return on capital will remain higher than the average rate of overall growth. In his words, “When the rate of return on capital significantly exceeds the growth rate of the economy … then it logically follows that inherited wealth grows faster than output and income.”13 These growing levels of wealth and income inequality will continue into the future, with inheritance and legacy playing an increasingly outsized role in the future, absent other policy changes.
But, as Massachusetts Institute of Technology (MIT) economist Matthew Rognlie and others have pointed out, housing—that is, home price appreciation—accounts for almost all of the long‐term increase in the net capital share of income.14 By failing to correctly account for the role of housing, Piketty’s model fails to explain the true dynamics of wealth.
Lawrence Summers suggests that, when it comes to elasticities of substitution and diminishing returns to capital, Piketty “misreads the literature by conflating gross and net returns to capital.”15 The elasticity of substitution between capital and labor is critical for Piketty’s mechanism: if this elasticity is not greater than one, then a higher ratio of capital to income is associated with a lower share of capital income. Defining this term is also crucial, particularly the distinction of whether the measure is in gross or net terms. The net return is the gross return minus depreciation, and by subtracting depreciation net is mechanically lower than gross. When discussing the distribution of the control of resources, the net term is more relevant, as Piketty acknowledges in the book, saying “savings used to cover depreciation simply ensure that the existing capital stock will not decrease” and cannot be used to increase capital stock.16 Rognlie provides a simple illustrative example to help understand this distinction between net and gross terms: “if someone earns $1 in revenue from renting out a building but loses $0.40 as the building deteriorates, her command over resources has only increased by $0.60.”17 Focusing then, on the more relevant net term, Summers argues that “[i]t is plausible that as the capital stock grows, the increment of output produced declines slowly, but there can be no question that depreciation increases proportionally.… I know of no study suggesting that measuring output in net terms, the elasticity of substitution is greater than 1.”18 Focusing on the more relevant net term, which accounts for depreciation, it does not seem plausible that higher shares of capital would then lead to more capital accumulation due to diminishing returns.
University of California–Berkeley economist Alan Auerbach and Kevin Hassett of the American Enterprise Institute also criticize Piketty’s failure to consider risk and volatility in calculating the rate of return to capital. Using assumptions based on a simulation model developed by the National Bureau for Economic Research, they conclude that post‐tax returns to capital remain substantially lower than growth in gross national product.19
Chairman Jason Furman of President Obama’s Council of Economic Advisers and others have suggested that labor income plays a bigger role in the growth of inequality than returns to capital, as suggested by Piketty. Furman and former director of the Congressional Budget Office (CBO) Peter Orszag estimate that roughly two‐thirds of the increased share of income going to the top 1 percent since 1970 is attributable to increases in labor‐income inequality.
Finally, in an article in the Journal of Economic Perspectives, MIT economist Daren Acemoglu and University of Chicago economist and political scientist James A. Robinson note that, while readers of Piketty’s book may be given the “impression that the evidence supporting his proposed laws of capitalism is overwhelming.… He does not present even basic correlations between r–g and changes in inequality, much less any explicit evidence of a causal effect.”21 They run cross‐country regressions to analyze the relationship between top‐level inequality and the gap between rand g; whereas Piketty’s theory would predict a significant positive relationship between the two, they find a statistically insignificant negative estimate.
Some of these criticisms have been answered with greater or lesser satisfaction, while others have not been answered at all. And it is important to note that other, less heralded, critiques of inequality have avoided some of Piketty’s errors while reaching similar conclusions about a general increase in market income inequality.22
However, such technical debates, while important, miss a more fundamental problem with claims of record inequality.
Most claims that income inequality is at a record high in the United States, including Piketty’s, are based on a measure of “market income,” which does not take into account taxes or transfer payments (or changes in household size or composition). The failure to consider those factors considerably overstates effective levels of inequality.23
What the pundits, politicians, and others fail to understand is that the U.S. tax and transfer system is already highly redistributive. Taxes are progressive, significantly so. The top 1 percent of tax filers earn 19 percent of U.S. income, but in 2013 they paid 37.8 percent of federal income taxes.24 The inclusion of other taxes (payroll, sales, property, and so on) reduces this disparity, but does not eliminate it: a report from the Congressional Budget Office estimates that the top 1 percent paid 25.4 percent of all federal taxes in 2013, compared to 15 percent of pre‐tax income.25 The wealthy pay a disproportionate amount of taxes.
At the same time, lower‐income earners benefit disproportionately from a variety of wealth transfer programs. The federal government alone, for example, currently funds more than 100 anti‐poverty programs, dozens of which provide either cash or in‐kind benefits directly to individuals. Federal spending on those programs approached $700 billion in 2015, and state and local governments added another $300 billion.26
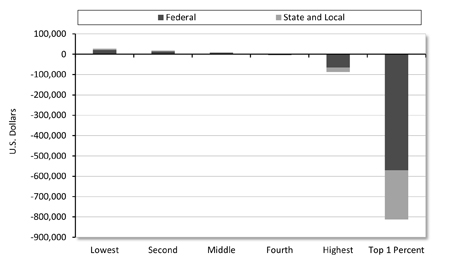
Figure 2 shows the amount of redistribution taking place within the current tax and transfer system. In 2012, individuals in the bottom quintile (that is, the bottom 20 percent) of incomes (families with less than $17,104 in market income) received $27,171 on average in net benefits through all levels of government, while on average those in the top quintile (families with market incomes above $119,695) pay $87,076 more than they receive. The top 1 percent paid some $812,000 more.
Figure 2. Redistribution by Income Quintile and Top 1 Percent, 2012
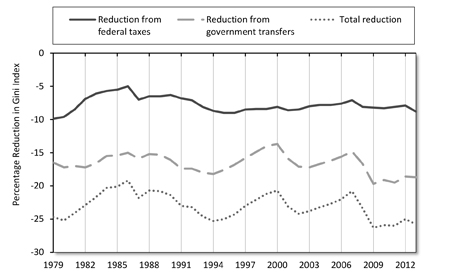
Taking this existing redistribution into account significantly reduces inequality. According to the CBO, accounting for taxes reduces the amount of inequality in the United States by more than 8 percent, while including transfer payments reduces inequality by slightly more than 18 percent. By fully accounting for redistribution from taxes and transfers, true inequality is almost 26 percent less than it initially appears. (Figure 3.)
Figure 3. Reduction in Gini Index from Federal Taxes and Government Transfers, 1979–2013
Source: Congressional Budget Office, “The Distribution of Household Income and Federal Taxes, 2013,” Figure 15, “Reduction in Income Inequality from Government Transfers and Federal Taxes, 1979 to 2013,” https://www.cbo.gov/sites/default/files/114th-congress-2015-2016/reports/51361-FigureData.xlsx.
Note: The Gini index, or Gini coefficient, is a common measure of income inequality based on the relationship between cumulative income shares and distribution of the population. The measure typically ranges from 0, which would reflect complete equality, and 1, which would correspond to complete inequality. Some sources, such as the World Bank, use an equivalent range of 0 to 100.
A new study from the Brookings Institution reaches similar conclusions. The study, by Jesse Bricker, Alice Henriques, and John Sabelhaus of the Federal Reserve Board and Jacob Krimmel of the University of Pennsylvania, found that while the concentration of wealth and income of the top 1 percent has indeed increased since 1992, it increased far less than prior research, including Piketty’s, has claimed. By including government transfers and in‐kind compensation in their calculations, the study’s authors found that the share of income earned by the top 1 percent rose from 11 percent in 1991 to 18 percent in 2012, substantially less than, for instance, the 23 percent estimated by Piketty and his colleague Emmanuel Saez in their updated work on the issue.27
In another study in the American Economic Review, Philip Armour, Richard Burkhauser, and Jeff Larrimore controlled for changes in household composition (that is, adjusting for size and dependency) and transfers (both cash and in‐kind), and found that there were significant gains across the income spectrum from 1979 to 2007 and for the period 1989–2007. However, gains at the top were smaller than gains at the bottom, meaning by this measure, inequality actually decreased from 1989 to the Great Recession.28
Given these problems, a better way to measure inequality might be to look at differences in consumption between income groups.
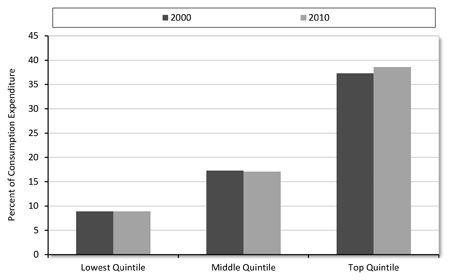
A study by Hassett and Aparna Mathur, also of the American Enterprise Institute, found that the “consumption gap across income groups has remained remarkably stable over time. If you sort households according to their pretax income, in 2010 the bottom fifth accounted for 8.7% of overall consumption, the middle fifth for 17.1%, and the top fifth for about 38.6%. Go back 10 years to 2000—before two recessions, the Bush tax cuts, and continuing expansions of globalization and computerization—and the numbers are similar. The bottom fifth accounted for 8.9% of consumption, the middle fifth for 17.3%, and the top fifth for 37.3%” (Figure 4).29
Figure 4. Share of Consumption Expenditure across Income Quintiles, 2000 and 2010
Although Hassett and Mathur did not specifically look at the top 1 percent of incomes, their study does demonstrate that, even if there have been gains at the top, it has not resulted in adverse consumption effects for those further down the income ladder.
Of course, these different conclusions depend in part on different measures of economic inequality. Piketty and others are more concerned about the disparity in accumulated wealth, the residue of year after year of income. The highest quintile, after all, may be saving their increased wealth rather than spending it. Over time, this can lead to increasing disparity. But even here, the evidence shows that the disparity in wealth distribution has not increased nearly as fast as Piketty and his supporters believe. For example, Bricker and his colleagues also found that the share of total wealth held by the top 1 percent increased from roughly 27 percent to 33 percent over that period, compared to the 42 percent share estimated by Saez and Gabriel Zucman in updated work related to Piketty’s.30
Bricker’s study actually shows a larger increase in wealth disparity than some others. For example, according to research using the Federal Reserve’s Survey of Consumer Finances, the wealthiest 1 percent of Americans held 34.4 percent of the country’s wealth in 1969. By 2013, the last year for which data are available, that proportion had barely risen, to roughly 36 percent.31
Moreover, the recent recession hit the wealthy especially hard. Indeed, the Tax Foundation has found that from 2007 to 2009 there was a 40 percent decline in the number of tax returns with at least $1 million in earnings. Among the “super‐rich,” the decline was even sharper: the number of tax returns reporting more than $10 million in earnings fell by 54 percent.32 In fact, while in 2006 the top 1 percent earned almost 20 percent of all income in America, that figure declined to just over 15 percent in 2009.33 Such volatility reflects the greater exposure that the wealthy face to risks associated with investment income. The stock market, for example, declined sharply during the recession, as did, obviously, the value of real estate. If inequality is your big concern, you should have been delighted by the recession. Inequality declined.
It appears, then, that inequality may not be as big a problem as commonly portrayed. After considering taxes, transfers, and other factors, the gap between rich and poor is neither as large nor growing as rapidly as Piketty and others have alleged. But even if it were, the question arises as to why that should be condemned. Why is inequality ipso facto bad?
MYTH 2. The Rich Didn’t Earn Their Money
Much of the debate over inequality is tied together with notions of fairness. Fairness, after all, is one of the most fundamental values of American politics.
Americans don’t necessarily resent wealth or the fact the some people are wealthier than others. For instance, a 2015 Cato/YouGov poll found that Americans agreed with the statement “people who produce more should be rewarded more than those who just tried hard” by a 42–26 percent margin.34 But this belief is counterbalanced by a feeling that the rich haven’t “earned” their wealth. For example, a study published in the International Journal of Business and Social Research found that while the so‐called “Horatio Alger effect” still meant that Americans admired wealthy entrepreneurs, there is “‘relative disdain’ for those who inherit their wealth or obtain it from financial trading.”35
Inherited wealth, after all, is pretty much the quintessential definition of “unearned” reward. The parents may have earned their estates through hard work, but the heirs did nothing beyond an accident of birth—pure, random luck—to earn an inheritance.
And, in the wake of recent Wall Street malfeasance, the bank bailout, and the recent recession, the public increasingly believes that financial traders are up to no good. After all, how many people really understand what derivative trading and other financial activities are and how they benefit the overall economy? Movies such as The Big Short regularly portray Wall Street operators as shady. And there certainly has been more than a little outright criminal activity in the finance industry. Recall Bernie Madoff.
But do the stereotypes hold? Are the wealthy really either trust fund babies who inherited their money or shady Wall Street traders?
Although Piketty and others worry a great deal about the role of inherited wealth, the evidence suggests that inheritance plays a very small role in how people become wealthy. Surveys vary, but it can be said with a fair degree of accuracy that the overwhelming majority of the rich did not inherit their wealth. For example, a study of billionaires around the world finds that fewer than 3 in 10 American billionaires got to that position by inheriting their wealth, and that “the share of self‐made billionaires has been expanding most rapidly in the United States.”36 And while that represents the richest of the rich, the slightly less wealthy may be even less likely to have inherited their wealth. A report from BMO Financial Group found that two‐thirds of high‐net‐worth Americans could be considered self‐made, compared to a mere 3 percent who inherited the majority of their wealth. Interestingly, this study also found that nearly a third of these people are either first‐generation Americans or were themselves born elsewhere. Among these wealthy “new Americans,” 80 percent reported that they earned, rather than inherited, their wealth.37 Finally, a survey by US Trust found that 70 percent of wealthy Americans grew up in middle‐class or lower‐income households. Even among those with assets in excess of $5 million, only a third grew up wealthy.38
Moreover, the role of inheritance has diminished over the last generation. A recent study by finance professors Steven Neil Kaplan of the University of Chicago and Joshua Rauh of Stanford found that fewer of those who made it on to the Forbes 400 list in recent years grew up wealthy than in previous decades, falling from 60 percent in 1982 to just 32 percent today.39 Roughly 20 percent of the Forbes 400 actually grew up poor, roughly the same percentage today as it was in 1982. Nor did most individuals on the Forbes 400 list inherit the family business. Kaplan and Rauh found that 69 percent of those on the list in 2011 started their own business, compared with only 40 percent in 1982.40 Similarly, an analysis by finance researchers Robert Arnott, William Bernstein, and Lillian Wu for the Cato Journal concluded that “half of the wealth of the 2014 Forbes 400 has been newly created in one generation.”41
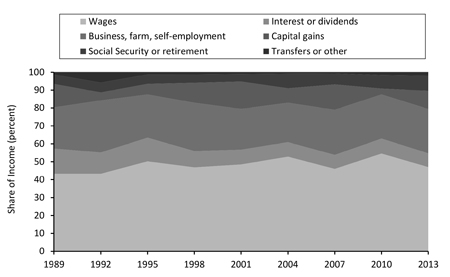
Further support for the minor role of inheritance can be seen from the fact that wage income is responsible for a majority of net worth for wealthy Americans. Among the top 10 percent in terms of net worth, wages accounted for 47 percent of their income in 2013, higher than the proportion in 1989 (Figure 5). Components such as interest, dividends, or capital gains, which are more likely, but by no means exclusively, derived from an inheritance, accounted for less than 18 percent of income for the top decile.42
Figure 5. Income Composition of Households in the Top Decile of Net Worth
In fact, it is not entirely clear that inheritance plays a role in increasing inequality: a recent paper by economists Edward Wolff of New York University and Maury Gittleman of the U.S. Bureau of Labor Statistics found that wealth transfers tend to be equalizing, because although richer households receive greater wealth transfers than poorer ones, “as a proportion of their current wealth holdings, wealth transfers are actually greater for poorer households.”43 As an illustration, although white households receive greater wealth transfers, a third of wealth in black households come from wealth transfers, compared to a fifth in white households. The same dynamic holds for younger households and low‐income households, in general.
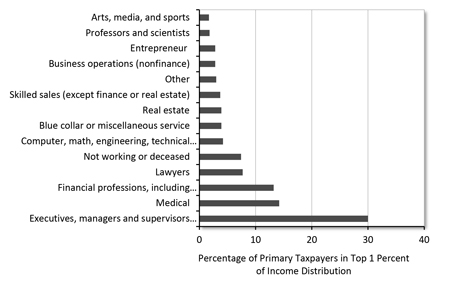
Nor are the rich primarily involved in stock trading or other financial services. According to one survey of the top 1 percent of American earners, slightly less than 14 percent were involved in banking or finance.44 Roughly a third were entrepreneurs or managers of nonfinancial businesses. Nearly 16 percent were doctors or other medical professionals. Lawyers accounted for slightly more than 8 percent, and engineers, scientists, and computer professionals another 6.6 percent.45 Sports and entertainment figures comprised almost 2 percent (see Figure 6).46 The ultrawealthy are somewhat more likely to be involved in finance, but not much more. Roughly 22 percent of those earning more than $30 million are involved in “finance, banking, and investments.”47
Figure 6. Distribution of Occupations of Primary Taxpayers in Top 1 Percent, Including Capital Gains
Overall, the rich get rich because they work for it. And they work hard. For example, research by economists Mark Aguiar of the Federal Reserve Bank of Boston and Erik Hurst of the University of Chicago found that the working time for upper‐income professionals has increased since 1965, while working time for low‐skill, low‐income workers has decreased.48 Similarly, according to a study by economists Peter Kuhn of the University of California–Santa Barbara and Fernando Lozano of Pomona College, the number of men in the bottom fifth of the income ladder who work more than 49 hours per week has dropped by almost 40 percent since 1980.49 But among the top fifth of earners, work weeks in excess of 49 hours have increased by almost 80 percent. Dalton Conley, chairman of NYU’s sociology department, concludes that “higher‐income folks work more hours than lower‐wage earners do.”50
Research by Nobel Economics Prize–winning psychologist Daniel Kahneman showed that those earning more than $100,000 per year spent, on average, less than 20 percent of their time on leisure activities, compared with more than a third of their time for people who earned less than $20,000 per year. Kahneman concluded that “being wealthy is often a powerful predictor that people spend less time doing pleasurable things and more time doing compulsory things.”51
None of this is to suggest that luck and privilege and government policies (see below) don’t play a role in who becomes wealthy. Clearly they do. But, for the most part the rich become wealthy because they earn it. And they earn it by creating, producing, or providing goods and services that improve the lives of the rest of us. This would seem to fit exactly the sort of wealth accumulation that Americans believe is “fair.”
MYTH 3. The Rich Stay Rich; the Poor Stay Poor
Certainly some families stay wealthy for generation after generation. Yet it is also true that wealth often dissipates across generations; research shows that the wealth accumulated by some intrepid entrepreneur or businessperson rarely survives long. In many cases, as much as 70 percent has evaporated by the end of the second generation and as much as 90 percent by the end of the third.52
Even over the shorter term, the composition of the top 1 percent often changes dramatically. If history is any guide, roughly 56 percent of those in the top income quintile can expect to drop out of it within 20 years.53 Of course, they may retain accumulated wealth, but even by this measure shifts can occur rapidly. Indeed, just as rises in capital markets can make some people rich, declines can wipe out their wealth quickly. It is notable that of those on the first edition of the Forbes 400 in 1982, only 34 remain on the 2014 list, and only 24 have appeared on every list.54 Some dropped about because they died, of course, but most simply did not see their wealth grow sufficiently to maintain their place. And, this would not have required major gains. For instance, Lawrence Summers estimates that even a 4 percent real rate of return on their wealth would have kept them on the list.55 That they were unable to meet even this modest goal suggests that the rich are not continuing to increase their wealth at rates well above the rate of economic growth as claimed by Piketty.
The heirs of great fortunes have done especially poorly. For example, we might think of the du Ponts or Rockefellers as personifying multigenerational wealth. Thirty‐eight people from those two families appeared on the 1982 list but none of the 16 du Pont heirs are currently on the Forbes 400 list and there is just one Rockefeller, 100‐year‐old David Sr. Nor are there any heirs to the Hearst fortune. The Mellons are out too, as are the Dursts and the Searles.56 Inheritance does not play an outsized or increasing role in the composition of the list: since 2005, those that inherited their money comprised just 10 percent of newcomers and 15 percent of newcomer’s wealth. The descendants of families on the inaugural list account for only 39 percent of the total wealth on the 2014 list.
For those who reach the 1 percent of income, spending long periods of time in that bracket is relatively rare. According to Hirschl and Rank, only about 2.2 percent of people spend five or more years in the top 1 percent of the income distribution from age 25 to 60. Just 1.1 percent spend 10 or more years in the top 1 percent. Attaining 10 consecutive years in the top 1 percent of income is even rarer: just over half of 1 percent do so.57 In short, there is no calcified class of 1 percenters who stay there, earning enormous incomes year after year.
At the same time, it remains possible for the poor to become rich, or, if not rich, at least not poor. Studies show that roughly half of those who begin in the bottom quintile move up to a higher quintile within 10 years.58 A more recent working paper found that 43 percent of families in the poorest income quintile and 27 percent of those in the second quintile saw earnings growth of at least 25 percent over a two‐year period.59 These numbers may be somewhat distorted by one‐time asset sales (such as a house), but still show considerably more economic mobility than commonly understood.
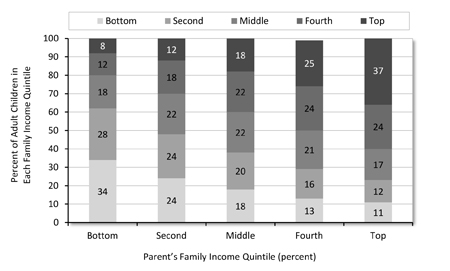
And their children can expect to rise even further. One out of every five children born to parents in the bottom income quintile will reach one of the top two quintiles in adulthood.60
Figure 7. Children’s Relative Economic Mobility by Parent’s Income
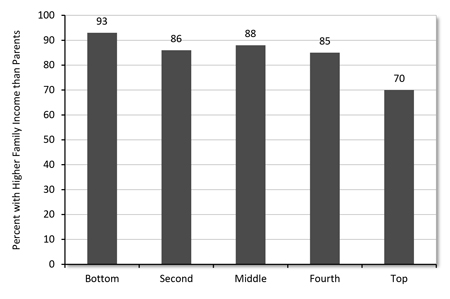
Moreover, these studies focus on relative income mobility. Looking at absolute mobility, which considers whether children grow up to have higher incomes than their parents after adjusting for things like cost of living and household size, the vast majority of Americans have family income higher than their parents (Figure 8).
Figure 8. Absolute Mobility by Parents’ Family Income Quintile
Economic mobility may not be as robust as we would like. In particular, upward mobility has been sluggish for decades. There is plenty of room to debate causes and solutions for this problem. But, it is simply untrue to suggest that the rich will stay rich and the poor will stay poor.
MYTH 4. More Inequality Means More Poverty
Perhaps the reason that there is so much concern over economic inequality is that we instinctively associate it with poverty. After all, poverty is the flip side of wealth. And, despite across‐the‐board gains in standards of living, too many Americans remain poor (at least by conventional measures). Slightly less than 15 percent of Americans lived in poverty in 2014, including 16 percent of women, 26.2 percent of African‐Americans, and 21.1 percent of children.61
But, it is important to note that poverty and inequality are not the same thing. Indeed, if we were to double everyone’s income tomorrow, we would do much to reduce poverty, but the gap between rich and poor would grow larger. Would this be a bad thing?
There is little demonstrable relationship between inequality and poverty. Poverty rates have sometimes risen during periods of relatively stable levels of inequality and declined during times of rising inequality. The idea that gains by one person necessarily mean losses by another reflects a zero‐sum view of the economy that is simply untethered to history or economics. The economy is not fixed in size, with the only question being one of distribution. Rather, the entire pie can grow, with more resources available to all.
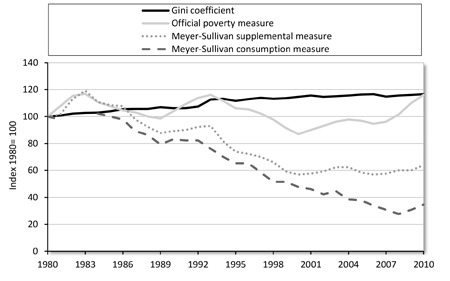
Comparing the Gini coefficient, the official poverty measure, and two additional poverty measures (one based on income and accounting for taxes and transfers, and one based on consumption) developed by economists Bruce D. Meyer of the University of Chicago and James X. Sullivan of Notre Dame reveals no clear relationship between poverty and inequality (Figure 9).62 While the Gini coefficient has increased almost without interruption, the official poverty rate has fluctuated mostly in the 13–15 percent range and the two measures from Meyer and Sullivan have both decreased markedly since 1980.63 Again, the mid‐1990s was an interesting period because the inequality was markedly higher than previously, but both the supplemental poverty measure (SPM) and the official rate saw significant decreases.
Figure 9. Changes in the Gini Coefficient and Poverty Rates Since 1980
Sources: Census Bureau; Bruce D. Meyer and James X. Sullivan, “Winning the War: Poverty from the Great Society to the Great Recession,” NBER Working Paper no. 18718, (January 2013), http://www.nber.org/papers/w18718.
Comparison with the consumption‐based poverty measure is especially interesting, with poverty showing a substantial decline despite rising inequality. Since many observers believe that consumption is the best measure of the poor’s actual standard of living, this suggests that not only does rising inequality not correlate with greater poverty, but a rising tide may truly lift all boats. That is, those same economic factors that make it possible for the rich to become rich may make life better for the poor as well.
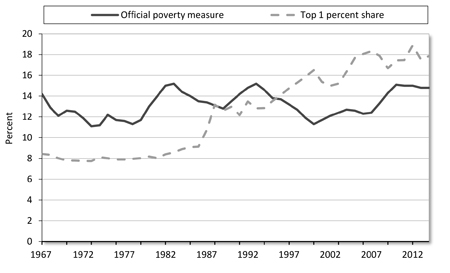
One can see similar results from comparing the poverty rate to the share of after‐tax income earned by the wealthiest 1 percent. There is no discernable correlation (Figure 10).64
Figure 10. Poverty and the 1 Percent
The relationship between poverty and inequality remains unclear, in part because the number of confounding variables and broader societal changes make any kind of determination difficult. But what research there is generally finds that poverty cannot be tied to inequality.
For instance, a recent paper by Dierdre Bloome of Harvard finds “little evidence of a relationship between individuals’ economic mobility and the income inequality they experienced when growing up.… Over a twenty year period in which income inequality rose continuously, the intergenerational income elasticity showed no consistent trend.” While most studies examine these trends at the national level, she delves into state‐level variation in inequality and social mobility. Again, she finds no evidence of a relationship, as “the inequality to which children were exposed in their state when growing up provides no information about the mobility they experienced as adults.”65
We should also note that international experience parallels the United States. Using World Bank data, which puts the Gini coefficient on a scale of 100, we can see that there are multiple countries where this has been the case recently.66 For example, China had a Gini coefficient of 32.43 in 1990 and it rose to 42.06 in 2009, meaning China became much more unequal. At the same time, the proportion of the population living below $1.25 a day (adjusted for purchasing power parity), the measure usually used for international poverty lines, fell from 60.18 percent in 1990 to only 11.8 percent in 2009.
Moreover, in discussing poverty and inequality, we should keep in mind that while the official poverty rate in the United States has been relatively stable since the mid‐1970s, the sort of deep poverty that was once common among poor Americans has been largely eliminated despite whatever increase in inequality has occurred over the last 50 years. Take hunger, for example. In the 1960s, as much as a fifth of the U.S. population and more than a third of poor people had diets that did not meet the Recommended Dietary Allowance for key nutrients. Conditions in 266 U.S. counties were so bad that they were officially designated as “hunger areas.”67 Today, malnutrition has been significantly reduced. According to the U.S. Department of Agriculture, just 5.6 percent of U.S. households had “very low food security” in 2013, a category roughly comparable to the 1960s measurements.68 Even among people below the poverty level, only 18.5 percent report very low food security.69
Housing provides another example. As recently as 1975, more than 2.8 million renter households (roughly 11 percent of renter households and 4 percent of all households) lived in what was considered “severely inadequate” housing, defined as “units with physical defects or faulty plumbing, electricity, or heating.” Today that number is down to roughly 1.2 million renter households (1 percent of all households).70 In 1970, fully 17.5 percent of households did not have fully functioning plumbing; today, just 2 percent do not.71
And if you look at material goods, the case is even starker. In the 1960s, for instance, nearly a third of poor households had no telephone. Today, not only are telephones nearly universal, but roughly half of poor households own a computer. More than 98 percent have a television, and two‐thirds have two or more TVs. In 1970, less than half of all poor people had a car; today, two‐thirds do.72 Clearly, the material circumstances of poor families have improved significantly despite any possible increase in inequality.
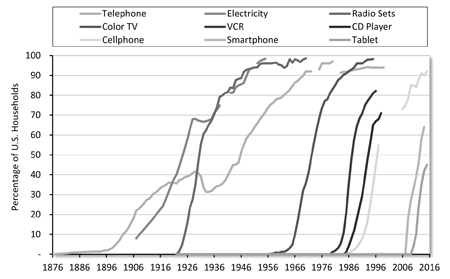
Not only do more people across the income distribution have access to more of these things, but adoption of new technologies and products is speeding up. Whereas it took decades for the telephone and electricity to make their way into the majority of American homes, new products, such as the cellphone and Internet, have a much faster adoption rate, as indicated in
Figure 11. Adoption of New Technologies
Thus, even as inequality, as measured by Piketty and others, has risen, people at the bottom of the income scale have better standards of living. It becomes an open question, therefore, whether inequality matters as long as everyone is becoming better off. In other words, if the poor are richer, do we care if the rich are even richer?
MYTH 5. Inequality Distorts the Political Process
Recently, a new argument against inequality has come to the fore: that inequality skews the political process in ways that benefit the wealthy and penalize the poor. In doing so, it locks in the status quo, limiting economic mobility, and enabling the wealthy to become still wealthier. There is certainly some merit to this argument. The federal government can and does dispense favors to those with connections to the levers of power. This has enabled some individuals to accumulate wealth that they could not have earned in a truly free market. In that sense, disparities of political power may exacerbate inequality. On the other hand, there is far less evidence that the wealthy are able to use their political power to enact a broad agenda that favors the wealthy or penalizes the poor.
A complete review of campaign finance law is beyond the scope of this paper. However, the assumption that all wealthy people share a similar political orientation is simply not supported by the data. According to a Gallup Poll, about one‐third of the top 1 percent of wealthiest Americans self‐identify as Republicans, compared to roughly a quarter who self‐identify as Democrats, a statistically significant, but far from overwhelming, tilt toward Republicans.73 Wealthy Americans are slightly more likely to call themselves conservatives than liberals, but so is the American public as a whole. As for policy preferences, while there are some signs that there are some policy areas where the very wealthy hold different views, on most issues they do not diverge significantly from the rest of the public.74 Simply look at such wealthy political activists as George Soros, Charles Koch, Sheldon Adelson, and Tom Steyer. Clearly, there is no common political denominator in that group.
Moreover, while many wealthy individuals are politically active, that activism is often offset by groups that represent lower‐income individuals, or groups whose politics cut across the socioeconomic spectrum. For example, 14 of the top 25 spenders during the 2012 election were unions, which ostensibly advocate for the working class.75
Even if the wealthy were more uniform in their political involvement, there is little evidence to show that money can buy elections. Obviously, a certain minimum amount of money is necessary to become a viable candidate. For a U.S. House candidate, for example, the first $500,000 or so is considered crucial to establishing a viable campaign. After that, additional funds and spending have diminishing returns.76
Finally, as noted above, the U.S. system is highly redistributive. The wealthy pay a disproportionate share of taxes. The regulatory state and the overall size of government have grown substantially. If the wealthy are attempting to tilt the playing field in favor of the rich, they have been remarkably unsuccessful.
That said, and as noted previously, we should not ignore the fact that some individuals and businesses are able to secure favors and privileges from the government, often to the detriment of their competitors. A recent study by Didier Jacobs for Oxfam International claimed that as many as three‐quarters of the richest Americans owe their wealth to factors such as cronyism, Ricardian rents (meaning excess profits that are gained because of advantaged positions in the marketplace), and monopolies.77 The study itself is not especially rigorous and inflates its conclusions by lumping everything from corporate welfare to asymmetries of information into its broad definitions of unfairly earned wealth. Nonetheless, it does raise an important issue: the degree to which government itself exacerbates inequality through policies that reward favored businesses, punish the unfavored, protect monopolies, and otherwise limit competition.
In the popular imagination, it is an unrestrained free market that gives rise to inequality, and a powerful government is necessary to act as a counterweight. In reality, big government is often complicit with, and frequently the cause, of inequality.
Inequality caused by such crony capitalism may be particularly pernicious on economic grounds as well as principles of fairness. For instance, some studies suggest that high degrees of inequality can actually slow economic growth or reduce the amount of freedom in a country. Among them, a study by Southern Methodist University economist Ryan Murphy for the Cato Journal found “inequality appears to have a negative impact on economic freedom.”78 But, other studies show that the key component in this equation is whether the inequality results from normal free‐market forces or from government‐dispensed favors. According to economists Sutirtha Bagchi of the University of Michigan and Jan Svejnar of Columbia University, “When we control for the fact that some billionaires acquired wealth through political connections, the effect of politically connected wealth inequality is negative, while politically unconnected wealth inequality, income inequality, and initial poverty have no significant effect.”79
By most measures, cronyism is a far smaller contributor to inequality in the United States than in many other countries, such as Russia, Malaysia, or Ukraine. One index of crony capitalism ranks the U.S. 17th in the world in terms of the proportion of billionaire wealth generated in industry sectors with a high degree of government involvement.80 The United States also has a higher percentage of billionaire wealth generated in non‐cronyist sectors than most other countries. This listing may overstate the degree of cronyism in the United States since cronyist sectors include casinos; infrastructure; ports and airports; oil, timber, and mining; banking and finance; and real estate—many of which are far more open in the United States than they are in other counties. We should also understand that not everyone who earns wealth in a crony‐controlled industry is involved in cronyism.
Still, it is easy to see that some U.S. industries, and therefore some fortunes, benefit from government action. And it is undeniable that politically derived benefits are far more likely to go to those who already have wealth, power, and the connections that flow from them. But there is little to suggest that inequality lies at the heart of the problem. Indeed, many of the countries that rank higher than the United States in terms of cronyism have much smaller Gini coefficients.
Another way to measure the effect of crony capitalism is to consider various indexes of economic freedom. The degree of economic freedom in a country can be considered a fair proxy for the lack of cronyism. That is, the freer an economy is, the less likely that it is dominated by cronyism. Studies measuring Gini coefficients over time against indexes of economic freedom (adjusted to exclude exogenous factors such as educational levels, climate, agricultural share of employment, and so forth) show a small but statistically significant reduction in inequality in countries with high economic freedom scores.81 In other words, countries with less government intervention in the economy tend to have lower levels of inequality. It is worth noting, however, that not all areas of economic freedom had the same effect. For example, sound monetary policy, property rights, and a fair legal system reduced inequality more than did trade liberalization.
Consider, for example, how government regulations can prevent competition, thereby entrenching currently successful companies and reducing the economic mobility—both up and down the income scale—that might otherwise occur. Economic theory holds that companies can enjoy only a brief period of competitive advantage, during which they can make extremely high profits, and after which competitors will enter the marketplace, driving profits down. However, as The Economist points out, American business profits have been unusually high for an unusually long period of time, and profitable firms have maintained their profits for longer periods than in the past. In the 1980s, for example, the odds that a very profitable U.S. company would still be as profitable 10 years later were about one out of two. Today, those odds are about 80 percent.82 The Economistattributes much of this change to decreased competition.
Increasingly, costly and restrictive regulations can create barriers to entry that reduce competition and preserve excess profits in regulated industries. The U.S. rate of new business creation is half of what it was in the 1980s, and the United States is 33rd in the World Bank’s rankings of how easy it is to start a business.83 The Economist warns, “Small firms normally lack both the working capital needed to deal with red tape and long court cases, and the lobbying power that would bend rules to their purposes.”84 The result may be undeservedly high profits for existing firms and unearned wealth for those who manage and invest in them.
Government may intervene even more directly to support businesses with political connections. The Cato Institute, for example, estimates that the federal government spends more than $100 billion every year on corporate welfare. Most of this spending provides favors to the politically powerful and well connected, rather than tax breaks meant to increase overall economic growth.
It may be reasonable to say, therefore, that far from being the enemy of inequality, big government can actually be an engine, or at least an accomplice, to greater inequality. It is not that inequality tilts the political playing field so much as it is that government provides the mechanism through which inequality can flourish.
Conclusion
Of course, even if one accepts the premise that inequality is increasing, undeserved, and leads to the problems discussed above, the more interesting question from a policy perspective is what we can—or should—do about it. There are, after all, two ways to reduce inequality. One can attempt to bring the bottom up by reducing poverty, or one can bring the top down by, in effect, punishing the rich.
Traditionally, we have tried to reduce inequality by taxing the rich and redistributing that money to the poor. And, as noted above, we have achieved some success. But we may well have reached a point of diminishing returns from such policies. Despite the United States spending roughly a trillion dollars each year on anti‐poverty programs at all levels of government, by the official poverty measure we have done little to reduce poverty.85 Even by using more accurate alternative poverty measures, gains leveled out during the 1970s, apart from the latter part of the 1990s when the booming economy and the reform of the welfare system produced significant reductions in poverty. Additional increases in spending have yielded few gains. Thus, while redistribution may have reduced overall inequality, it has done far less to help lift people out of poverty.
And even in terms of attacking inequality, redistribution may have reached the limits of its ability to make a difference. A new study from the Brookings Institution, for example, suggests that further increasing taxes on the wealthy, accompanied by increased transfers to the poor, would have relatively little effect on inequality. This study by William Gale, Melissa Kearney, and Peter Orszag looked at what outcome could be expected if the top tax rate was raised to 50 percent from its current 39.6 percent, and all additional revenue raised was redistributed to households in the lowest quintile of current incomes. To bias the study in favor of redistribution, the authors assume no change in behavior from the wealthy in an effort to reduce their exposure to the higher tax rate. The tax hike, therefore, would raise $96 billion in additional revenue, which would allow additional redistribution of $2,650 to each household in the bottom quintile—an amount that would not significantly reduce inequality. The authors conclude, “That such a sizable increase in the top personal income tax rate leads to a strikingly limited reduction in income inequality speaks to the limitations of this particular approach to addressing the broader challenge.“86
Indeed, many advocates of increased taxes for the wealthy seem to concede that their efforts would do little to reduce poverty. Rather, they would reduce inequality from the top down. Piketty, for example, argues for a globally imposed wealth tax and a U.S. income tax rate of 80 percent on incomes over $500,000 per year.87 He acknowledges this tax “would not bring the government much in the way of revenue,” but that it would “distribute the fruits of growth more widely while imposing reasonable limits on economically useless (or even harmful) behavior.”88
Other critics of inequality seem equally concerned with punishing the rich. Hillary Clinton, for instance, argues that fighting inequality requires a “toppling” of the one percent.89 But the ultimate losers of such policies are likely to be the poor. Piketty’s plan might indeed lead to a society that would be more equal, but it would also likely be a society where everyone is far poorer.
Economic growth, after all, depends on people who are ambitious, skilled risk‐takers. We need such people to be ever‐striving for more in order to fuel economic growth. That means they must be rewarded for their efforts, their skills, their ambitions, and their risks. Such rewards inevitably lead to greater inequality. But as Nobel Economics Prize–winning economist Gary Becker pointed out, “It would be hard to motivate the vast majority of individuals to exert much effort, including creative effort, if everyone had the same earnings, status, prestige, and other types of rewards.”90
To be sure, since the 1970s the relationship between economic growth and poverty reduction has been uneven at best. But we are unlikely to see significant reductions in poverty without strong economic growth. Punishing the segment of society that most contributes to such growth therefore seems a poor policy for serious poverty reduction.
But one needn’t be a fan of the Laffer curve to realize that raising taxes on the rich can have unforeseen consequences. Recall 19th‐century French economist and classical liberal Frédéric Bastiat’s What Is Seen and What Is Not Seen, which argues that the pernicious effects of government policies are not easily identified because they affect incentives and thus people’s willingness to work and take risks.91 And recall that money earned by the rich is either saved or spent. If saved, it provides a pool of capital that fuels investment and provides jobs to the non‐rich. Likewise, if spent, it increases consumption, similarly providing increased employment opportunities for the non‐rich.
Back in 1991, for example, Congress decided to impose a luxury tax on such frivolous items as high‐priced automobiles, aircraft, jewelry, furs, and yachts. The tax “worked” in a sense: the rich bought fewer luxury goods—and thousands of Americans who worked in the jewelry, aircraft, and boating industries lost their jobs. According to a study done for the Joint Economic Committee, the tax destroyed 7,600 jobs in the boating industry alone.92 Most of the tax was soon repealed, although the luxury tax provision lasted until 2002.
Too much of the debate over economic inequality has been driven by emotion or misinformation. Yes, there is a significant amount of inequality in America, but most estimates of that inequality fail to account for the amount of redistribution that already takes place in our system. If one takes into account taxes and social welfare programs, the gap between rich and poor shrinks significantly. Inequality does not disappear after making these adjustments, but it may not be as big a problem or be growing as rapidly as is sometimes portrayed.
But even if inequality were as bad as advertised, one has to ask why that should be considered a problem. Of course, inequality may be a problem if the wealthy became rich through unfair means. But, in reality, most wealthy people earned their wealth, and did so by providing goods and services that benefit society as a whole. Moreover, there remains substantial economic mobility in American society, although as noted above, there are policy reforms often unmentioned in the inequality debate that could expand the opportunities available to people toward the bottom of the income distribution, such as education reform, reducing occupational licensing and other regulatory barriers to entrepreneurship, reforming the criminal justice system, and eliminating the perverse incentives of the welfare system. Those who are rich today may not remain rich tomorrow. And those who are poor may still rise out of poverty.
While inequality per se may not be a problem, poverty is. But there is little evidence to suggest that economic inequality increases poverty. Indeed, policies designed to reduce inequality by imposing new burdens on the wealthy may perversely harm the poor by slowing economic growth and reducing job opportunities.
Notes
1. Paul Krugman, “Why We’re in a New Gilded Age,” New York Review of Books, May 8, 2014, http://www.nybooks.com/articles/2014/05/08/thomas-piketty-new-gilded-ag….
2. Dan Merica, “With Hopes of Winning Issue, Group Trumpets Hillary Clinton’s Income Inequality Record,” CNN, April 17, 2014, http://politicalticker.blogs.cnn.com/2014/04/17/with-hopes-of-winning-issue-group-trumpets-hillary-clintons-income-inequality-record.
3. Hillary Clinton, “Speech on College Affordability at Plymouth State University in Plymouth, New Hampshire,” October 11, 2007, Gerhard Peters and John T. Woolley, The American Presidency Project, www.presidency.ucsb.edu/ws/?pid=77063.
4. Benjy Sarlin, “Hillary Clinton Slams Inequality in Populist Speech,” MSNBC, May 16, 2014, http://www.msnbc.com/msnbc/hillary-clinton-goes-populist.
5. Frank Newport, “Americans Continue to Say U.S. Wealth Distribution is Unfair,” Gallup, May 4, 2015, http://www.gallup.com/poll/182987/americans-continue-say-wealth-distribution-unfair.aspx.
6. “Americans’ Views on Income Inequality and Workers’ Rights,” New York Times and CBS News, June 3, 2015, http://www.nytimes.com/interactive/2015/06/03/business/income-inequalit….
7. Thomas Piketty, Capital in the Twenty‐First Century (Cambridge, MA: The Belknap Press of Harvard University Press, 2014).
8. Thomas Piketty, interview by Eduardo Porter, “Q&A: Thomas Piketty on the Wealth Divide,” New York Times, Economix Blog, March 11, 2014, http://economix.blogs.nytimes.com/2014/03/11/qa-thomas-piketty-on-the‑w….
9. Chris Giles, “Data Problems with Capital in the 21st Century,” Financial Times, May 23, 2014, http://blogs.ft.com/money-supply/2014/05/23/data-problems-with-capital-….
10. Ibid.
11. Ibid.
12. Piketty, Capital in the Twenty‐First Century, p. 25.
13. Ibid., p. 26
14. Matthew Rognlie, “Deciphering the Fall and Rise in the Net Capital Share: Accumulation or Scarcity?” Brookings Institution, Brookings Papers on Economic Activity, March 19, 2015, http://www.brookings.edu/about/projects/bpea/papers/2015/land-prices-evolution-capitals-share.
15. Lawrence H. Summers, “The Inequality Puzzle,” Democracy no. 33 (Summer 2014), http://democracyjournal.org/magazine/33/the-inequality-puzzle/.
16. Piketty, Capital in the Twenty‐First Century, p. 173.
17. Matthew Rognlie, “A Note on Piketty and Diminishing Returns to Capital,” June 15, 2014, p. 4, http://www.mit.edu/~mrognlie/piketty_diminishing_returns.pdf.
18. Summers, “The Inequality Puzzle.”
19. Alan Auerbach and Kevin Hassett, “Capital Taxation in the 21st Century,” preview of paper presented at American Economic Association meetings, January 2015, https://www.aeaweb.org/aea/2015conference/program/retrieve.php?pdfid=421.
20. Jason Furman and Peter Orszag, “A Firm‐Level Perspective on the Role of Rents in the Rise in Inequality,” presentation at “A Just Society” Centennial Event in Honor of Joseph Stiglitz, Columbia University, October 2015,https://www.whitehouse.gov/sites/default/files/page/files/20151016_firm_level_perspective_on_role_of_rents_in_inequality.pdf.
21. Daron Acemoglu and James A. Robinson, “The Rise and Decline of General Laws of Capitalism,” Journal of Economic Perspectives 29, no. 1 (Winter 2015): 3–28, http://economics.mit.edu/files/11348.
22. See, for example, Emmanuel Saez and Gabriel Zucman, “Wealth Inequality in the United States since 1913: Evidence from Capitalized Income Tax Data,” Quarterly Journal of Economics (forthcoming), http://eml.berkeley.edu/~saez/saez-zucmanNBER14wealth.pdf; and Jesse Bricker, Alice Henriques, Jacob Krimmel, and John Sabelhaus, “Measuring Income and Wealth at the Top Using Administrative and Survey Data,” Brookings Papers on Economic Activity, Conference Draft, March 10–11, 2016, http://www.brookings.edu/~/media/Projects/BPEA/Spring-2016/BrickerEtAl_MeasuringIncomeAndWealthAtTheTop_ConferenceDraft.pdf?la=en.
23. Use of income data may also overstate the growth in inequality because changes in the tax code have caused more private business income to pass through to the owners’ individual tax returns via partnerships, LLCs, and Subchapter S corporations. From 1980 to 2007, according to the Congressional Budget Office, “the share of receipts generated by pass‐through entities more than doubled over the period—from 14 percent to 38 percent.” See Richard V. Burkauser, Philip Armour, and Jeff Larrimore, “Levels and Trends in United States Income and Its Distribution: A Crosswalk from Market Income Towards a Comprehensive Haig‐Simons Income Approach,” Southern Economic Journal 81, no. 2 (October 2014): 271–93. Moving capital income from one tax form to another did not mean the wealth of the top 1 percent increased, it was simply shifted around. In addition, tax changes from 1981 to 1997 required that more capital income of high‐income taxpayers be reported on their individual returns, while excluding most capital income of middle‐income savers and homeowners. And, finally, there were significant increases in reported capital gains among the top 1 percent after the capital‐gains tax was reduced in 1997 and 2003. Alan Reynolds, “Why Piketty’s Wealth Data Are Worthless,” Wall Street Journal, July 9, 2014, http://online.wsj.com/articles/alan-reynolds-why-pikettys-wealth-data‑a….
24. Scott Greenberg, “Summary of Latest Federal Income Tax Data, 2015 Update,” Tax Foundation, November 19, 2015, http://taxfoundation.org/article/summary-latest-federal-income-tax-data-2015-update.
25. Congressional Budget Office, “The Distribution of Household Income and Federal Taxes, 2013” Supplemental Data, Tables 2–3, June 8, 2016, https://www.cbo.gov/sites/default/files/114th-congress-2015–2016/report….
26. Michael Tanner, “The American Welfare State: How We Spend Nearly $1 Trillion a Year Fighting Poverty—And Fail,” Cato Institute, Policy Analysis no. 694, April 11, 2012, http://www.cato.org/publications/policy-analysis/american-welfare-state….
27. Bricker et al., “Measuring Income and Wealth at the Top Using Administrative and Survey Data.”
28. Philip Armour, Richard V. Burkhauser, and Jeff Larrimore, “Deconstructing Income and Income Inequality Measures: A Crosswalk from Market Income to Comprehensive Income,” American Economic Review 103, no. 3: 173–77, https://www.aeaweb.org/articles.php?doi=10.1257/aer.103.3.173.
29. Kevin A. Hassett and Aparna Mathur, “A New Measure of Consumption Inequality,” American Enterprise Institute, June 2012, https://www.aei.org/wp-content/uploads/2012/06/-a-new-measure-of-consumption-inequality_142931647663.pdf; Kevin A. Hassett and Aparna Mathur, “Hassett and Mathur: Consumption and the Myths of Inequality,” Wall Street Journal, October 24, 2012, http://www.wsj.com/articles/SB10000872396390444100404577643691927468370.
30. Bricker et al., “Measuring Income and Wealth at the Top Using Administrative and Survey Data.” The difference is attributable to different data sources and the more comprehensive definition of income that these sources allow Bricker and colleagues to incorporate. They analyze families instead of individual tax units and their use of the Survey of Consumer Finances and National Income and Product Accounts data sources provide a much more comprehensive measure of total income, including in‐kind and untaxed transfers.
31. Ibid.; and Edward N. Wolff, “The Asset Price Meltdown and the Wealth of the Middle Class,” Table 2, “The Size Distribution of Wealth and Income, 1962–2010,” NBER Working Paper no. 18559, November 2012, http://www.nber.org/papers/w18559.
32. Scott A. Hodge, “How Do You Tax a Millionaire? First, You Get a Millionaire,” Tax Foundation, October 6, 2011, http://taxfoundation.org/blog/how-do-you-tax-millionaire-first-you-get-….
33. Bricker et al., “Measuring Income and Wealth at the Top Using Administrative and Survey Data.”
34. Emily Ekins, “Cato/YouGov November 2015 National Survey,” Cato Institute, Topline Results Release 2, “Moral Foundations and Election 2016,” http://object.cato.org/sites/cato.org/files/wp-content/uploads/toplines_roleofgovt.pdf.
35. Lyle Sussman, David Dubofsky, Alan S. Levitan, and Hassan Swidan, “Good Rich, Bad Rich: Perceptions about the Extremely Wealthy and Their Sources of Wealth,” International Journal of Business and Social Research 4, no. 8 (2014), http://thejournalofbusiness.org/index.php/site/article/view/585.
36. Caroline Freund and Sarah Oliver, “The Origins of the Superrich: The Billionaire Characteristics Database,” Peterson Institute for International Economics, Working Paper 16–1, February 2016, https://piie.com/publications/wp/wp16-1.pdf.
37. BMO Financial Group, “Changing Face of Wealth,” June 2013, https://newsroom.bmo.com/press-releases/bmo-private-bank-changing-face-of-wealth-study-tw-tsx-bmo-201306130880202001.
38. U.S. Trust, “2015 U.S. Trust Insights on Wealth and Worth Survey,” Bank of America Private Wealth Management, http://www.ustrust.com/publish/content/application/pdf/GWMOL/USTp_ARTNTGDB_2016-05.pdf.
39. Steven Neil Kaplan and Joshua Rauh, “Family, Education, and Sources of Wealth among the Richest Americans, 1982–2012,” American Economic Review 103, no. 3 (May 2013): 158–162.
40. Ibid.
41. Robert Arnott, William Bernstein, and Lillian Wu, “The Myth of Dynastic Wealth: The Rich Get Poorer,” Cato Journal 35, no. 3 (Fall 2015): 447–85, http://object.cato.org/sites/cato.org/files/serials/files/cato-journal/….
42. Board of Governors of the Federal Reserve System, “Changes in U.S. Family Finances from 2007 to 2010: Evidence from the Survey of Consumer Finances,” Federal Reserve Bulletin 98, no. 2 (June 2012).
43. Edward N. Wolff and Maury Gittleman, “Inheritances and the Distribution of Wealth or Whatever Happened to the Great Inheritance Boom,” Journal of Economic Inequality 12 (2014): 439–68, http://piketty.pse.ens.fr/files/WolffGittleman2013.pdf.
44. Jon Bakija, Adam Cole, and Bradley T. Heim, “Jobs and Income Growth of Top Earners and the Causes of Changing Income Inequality: Evidence from U.S. Tax Return Data,” January 2012, http://web.williams.edu/Economics/wp/BakijaColeHeimJobsIncomeGrowthTopEarners.pdf.
45. Ibid.
46. Ibid.
47. Wealth‑X, “World Ultra Wealth Report 2013,” http://wuwr.wealthx.com/Wealth‑X%20and%20UBS%20World%20Ultra%20Wealth%2….
48. Mark Aguiar and Erik Hurst, “Measuring Trends in Leisure: The Allocation of Time over Five Decades,” Quarterly Journal of Economics 122, no. 3 (2007): 969‑1006, 2007.
49. Peter Kuhn and Fernando Lozano, “The Expanding Workweek? Understanding Trends in Long Work Hours Among U.S. Men, 1979–2006,” Journal of Labor Economics 26, no. 2 (April 2008): 311–43.
50. Dalton Conley, “Rich Man’s Burden,” New York Times, September 2, 2008, http://www.nytimes.com/2008/09/02/opinion/02conley.html?_r=0.
51. Daniel Kahneman, Alan B. Krueger, David Schkade, Norbert Schwarz, and Arthur A. Stone, “Would You Be Happier if You Were Richer? A Focusing Illusion,” Science 312, no. 5782 (June 2006): 1908-10.
52. Missy Sullivan, “Lost Inheritance,” Wall Street Journal, March 8, 2013, http://www.wsj.com/articles/SB10001424127887324662404578334663271139552.
53. Gerald Auten, Geoffrey Gee, and Nicholas Turner, “New Perspectives on Income Mobility and Inequality,” National Tax Journal 66, no. 4 (December 13): 893–912, https://www.law.upenn.edu/live/files/2934-autengeeturner-perspectives-on-mobility-inequality.
54. William McBride, “Thomas Piketty’s False Depiction of Wealth in America,” Tax Foundation, August 14, 2014; and Arnott et al., “The Myth of Dynastic Wealth.”
55. Lawrence Summers, “The Inequality Puzzle,” Democracy 33 (Summer 2014), http://democracyjournal.org/magazine/33/the-inequality-puzzle/.
56. McBride, “Thomas Piketty’s False Depiction of Wealth in America.”
57. Thomas A Hirschl and Mark R. Rank, “The Life Course Dynamics of Affluence,” PLoS ONE 10, no. 1 (January 2015): e0116370, http://journals.plos.org/plosone/article?id=10.1371/journal.pone.0116370.
58. United States Department of the Treasury, “Income Mobility in the U.S. from 1996 to 2005,” November 13, 2007, https://www.treasury.gov/resource-center/tax-policy/Documents/Report-In….
59. Jeff Larrimore, Jacob Mortenson, and David Splinter, “Income and Earnings Mobility in U.S. Tax Data,” Washington Center for Equitable Growth Working Paper 2016-06 (April 2016), http://equitablegrowth.org/income-and-earnings-mobility-in-us-tax-data/.
60. Raj Chetty, Nathaniel Hendren, Patrick Kline, and Emmanuel Saez, “Where is the Land of Opportunity? The Geography of Intergenerational Mobility in the United States,” http://www.equality-of-opportunity.org/images/mobility_geo.pdf.
61. Carmen DeNavas‐Walt and Bernadette D. Proctor, “Income and Poverty in the United States: 2014,” United States Census Bureau, P60-252, September 2015, https://www.census.gov/content/dam/Census/library/publications/2015/demo/p60-252.pdf.
62. Bruce D. Meyer and James X. Sullivan, “Winning the War: Poverty From the Great Society to the Great Recession,” NBER Working Paper no. 18718 (January 2013), http://www.nber.org/papers/w18718.
63. United States Census Bureau, “Historical Income Tables: Income Inequality,” Table H‑4, “Gini Ratios for Households, by Race and Hispanic Origin of Householder, 2015,” https://www2.census.gov/programs-surveys/cps/tables/time-series/historical-income-households/h04.xls ; United States Census Bureau, “Historical Poverty Tables: People and Families, 1959 to 2014,” Table 5, “Percent of People by Ratio of Income to Poverty Level, 2015,” https://www2.census.gov/programs-surveys/cps/tables/time-series/historical-poverty-people/hstpov5.xls ; Meyer and Sullivan, “Winning the War: Poverty from the Great Society to the Great Recession.”
64. Facundo Alvaredo, Tony Atkinson, Thomas Piketty, Emmanuel Saez, and Gabriel Zucman, “The World Wealth and Income Database, ” http://www.wid.world/; United States Census Bureau, “Historical Poverty Tables: People,”https://www.census.gov/hhes/www/poverty/data/historical/people.html.
65. Dierdre Bloome, “Income Inequality and Intergenerational Income Mobility in the United States,” Social Forces 93, no. 3 (2015): 1047–80, http://sf.oxfordjournals.org/content/93/3/1047.
66. World Bank, Poverty and Equity Data, “Gini Index,” http://data.worldbank.org/indicator/SI.POV.GINI/countries; World Bank, Poverty and Equity Data, “Income Share Held by Highest 10%,” http://data.worldbank.org/indicator/SI.DST.10TH.10/countries; World Bank, Poverty and Equity Data, “Poverty Headcount Ratio at $1.90 a Day (2011 PPP) (% of Population),” http://data.worldbank.org/indicator/SI.POV.DDAY/countries).
67. Citizens Board of Inquiry into Hunger and Malnutrition, “Hunger, U.S.A.: A Report by the Citizens’ Board of Inquiry into Hunger and Malnutrition in the United States” (Washington: New Community Press, 1968).
68. The “very low food security” category identifies households in which food intake of one or more members was reduced and eating patterns disrupted because of insufficient money and other resources for food. Households classified as having low food security have reported multiple indications of food access problems and reduced diet quality, but typically have reported few, if any, indications of reduced food intake. Those classified as having very low food security have reported multiple indications of reduced food intake and disrupted eating patterns because of inadequate resources for food. In most, but not all, households with very low food security, the survey respondent reported that he or she was hungry at some time during the year but did not eat because there was not enough money for food.
69. Alisha Coleman‐Jensen, Christian Gregory, and Anita Singh, “Household Food Security in the United States in 2013,” United States Department of Agriculture, Economic Research Report no. 173, September 2014,http://www.ers.usda.gov/media/1565415/err173.pdf.
70. John Quigley and Steven Raphael, “Is Housing Unaffordable? Why Isn’t it More Affordable?” Journal of Economic Perspectives 18, no. 1 (Winter 2004): 191–214, http://urbanpolicy.berkeley.edu/pdf/QRJEP04PB.pdf. Their data for households in severely inadequate housing are divided by the total number of households , as found in United States Census Bureau, “Table HH‑1. Households, by Type: 1940 to Present,” https://www.census.gov/hhes/families/files/hh1.xls.
71. Nicholas Eberstadt, The Poverty of “The Poverty Rate”: Measure and Mismeasure of Want in Modern America (Washington: American Enterprise Institute, 2008), http://www.aei.org/files/2014/03/27/-the-poverty-of-the-poverty-rate_10….
72. U.S. Energy Information Administration, “2009 Residential Energy Consumption Survey (RECS),” http://www.eia.gov/consumption/residential/data/2009/#undefined.
73. Lydia Saad, “U.S. ‘1%’ Is More Republican, but not More Conservative,” Gallup, December 5, 2011, http://www.gallup.com/poll/151310/u.s.-republican-not-conservative.aspx.
74. Martin Gilens, “Inequality and Democratic Responsiveness,” Public Opinion Quarterly 69, no. 5 (Special Issue 2005): 778–96; Martin Gilens and Benjamin Page, “Testing Theories of American Politics: Elites, Interest Groups, and Average Citizens,” Perspectives on Politics 12, no. 3 (September 2014): 564–81; and Benjamin Page, Larry M. Bartels, and Jason Seawright, “Democracy and the Policy Preferences of Wealthy Americans,” Perspectives on Politics 11, no. 1 (March 2013): 51–73.
75. Center for Responsive Politics, “Top Organization Contributors,” http://www.opensecrets.org/orgs/list.php.
76. Trevor Burrus, “Three Things You Don’t Know about Money in Politics,” Forbes, April 11, 2014, http://www.cato.org/publications/commentary/three-things-you-dont-know-….
77. Didier Jacobs, “Extreme Wealth Is not Merited,” Oxfam International, Oxfam Discussion Papers, November 2015, https://www.oxfam.org/sites/www.oxfam.org/files/file_attachments/dp-ext….
78. Ryan H. Murphy, “The Impact of Economic Inequality on Economic Freedom,” Cato Journal 35, no. 1 (Winter 2015): 117–31.
79. Sutirtha Bagchi and Jan Svejnar, “Does Wealth Inequality Matter for Growth? The Effect of Billionaire Wealth, Income Distribution, and Poverty,” Journal of Comparative Economics 43, no. 3 (August 2015): 505–30, http://www.sciencedirect.com/science/article/pii/S0147596715000505.
80. Editorial, “Planet Plutocrat,” The Economist, March 15, 2014, http://www.economist.com/news/international/21599041-countries-where-politically-connected-businessmen-are-most-likely-prosper-planet.
81. Daniel Bennett and Richard Cebula, “Misperceptions about Capitalism, Government, and Inequality,” in Economic Behavior, Economic Freedom, and Entrepreneurship, ed. Richard Cebula, Joshua C. Hall, Franklin G. Mixon, Jr., and James E. Payne (Northhampton, MA: Edward Elgar Publishing Inc., 2015), pp. 1–21.
82. Editorial, “Too Much of a Good Thing,” The Economist, March 26, 2016, http://www.economist.com/news/briefing/21695385-profits-are-too-high-am….
83. Tad DeHaven, “Corporate Welfare in the Federal Budget,” Cato Institute Policy Analysis no. 703, July 25, 2012, http://www.cato.org/publications/policy-analysis/corporate-welfare-federal-budget; and Charles Hughes, “Zombie Corporate Welfare,” Cato at Liberty, October 30, 2015, http://www.cato.org/blog/zombie-corporate-welfare.
84. The Economist, “Too Much of a Good Thing,”
85. Michael Tanner and Charles Hughes, “War on Poverty Turns 50: Are We Winning Yet?” Cato Institute Policy Analysis no. 761, October 20, 2014, http://www.cato.org/publications/policy-analysis/war-poverty-turns-50-are-we-winning-yet.
86. William G. Gale, Melissa S. Kearney, and Peter R. Orszag, “Would a Significant Increase in the Top Income Tax Rate Substantially Alter Income Inequality?” Brookings Institution, September 2015, http://www.brookings.edu/~/media/research/files/papers/2015/09/28-taxes-inequality/would-top-income-tax-alter-income-inequality.pdf.
87. Piketty, Capital in the Twenty‐First Century.
88. Ibid., p. 513.
89. Zach Carter, “Hillary Clinton Calls for ‘Toppling’ the 1 Percent,” Huffington Post, April 21, 2015, http://www.huffingtonpost.com/2015/04/21/hillary-clinton-calls-for_0_n_….
90. Gary Becker, “Bad and Good Inequality,” The Becker‐Posner Blog, January 30, 2011, http://www.becker-posner-blog.com/2011/01/bad-and-good-inequality-becke….
91. Frédéric Bastiat, “What Is Seen and What Is not Seen,” in “Selected Essays on Political Economy,” Library of Economics and Liberty, http://www.econlib.org/library/Bastiat/basEss1.html.
92. Joint Economic Committee Republican Staff, “The Cost of Tax‐Related Job Loss versus Projected Revenue Gain from Luxury Taxes in Fiscal 1991,” July 1991; Government Accountability Office, Luxury Excise Tax Issues and Estimated Effects (Washington: GAO, 1992), http://www.gao.gov/assets/220/215770.pdf.