For me, a monetary approach to national income determination is what counts. The link between the growth rate of the money supply and nominal GDP is unambiguous and overwhelming.
As Milton Friedman put it in his 1987 New Palgrave Dictionary of Economics entry, “Quantity Theory of Money” (QTM), “The conclusion (of the QTM) is that substantial changes in prices or nominal income are almost always the result of changes in nominal supply of money.” The income form of the QTM states: MV=Py, where M is the money supply, V is the Velocity of money, P is the price level, and y is real GDP (national income).
Let’s use the QTM to make some bench calculations to determine what the “golden growth” rates are for the money supply. These are the rates of broad money growth that would allow the People’s Bank of China to hit its inflation target. I calculate the “golden growth” rates for three separate time periods.
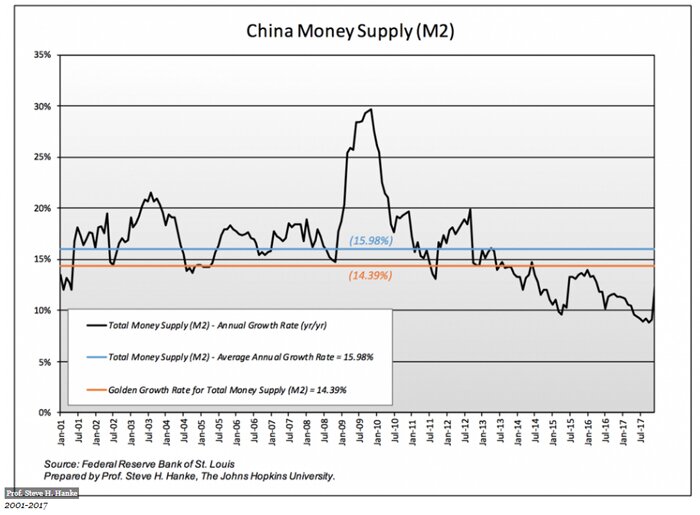
China, 2001-2017:
According to my calculations, the average percent real GDP growth from 2001 to 2017 was 9.32%, the average growth in Total Money Supply (M2) was 15.98%, and the average change in the velocity of money was -2.07%. Using these values and the People’s Bank of China’s inflation target of 3%, I calculated China’s “golden growth” rate for Total Money to be 14.39%.
Calculations:
Golden growth rate = Inflation target + Average real GDP growth – Average percent change in velocity
Golden growth rate = 3% + 9.32% - (-2.07%) = 14.39%
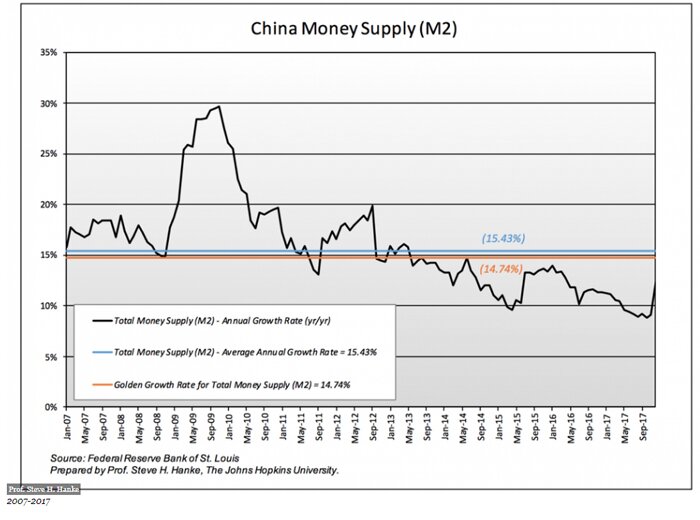
China, 2007-2017:
According to my calculations, the average percent real GDP growth from 2007 to 2017 was 8.81%, the average growth in Total Money Supply (M2) was 15.43%, and the average change in the velocity of money was -2.93%. Using these values and the People’s Bank of China’s inflation target of 3%, I calculated China’s “golden growth” rate for Total Money to be 14.74%.
Calculations:
Golden growth rate = Inflation target + Average real GDP growth – Average percent change in velocity
Golden growth rate = 3% + 8.81% - (-2.93%) = 14.74%
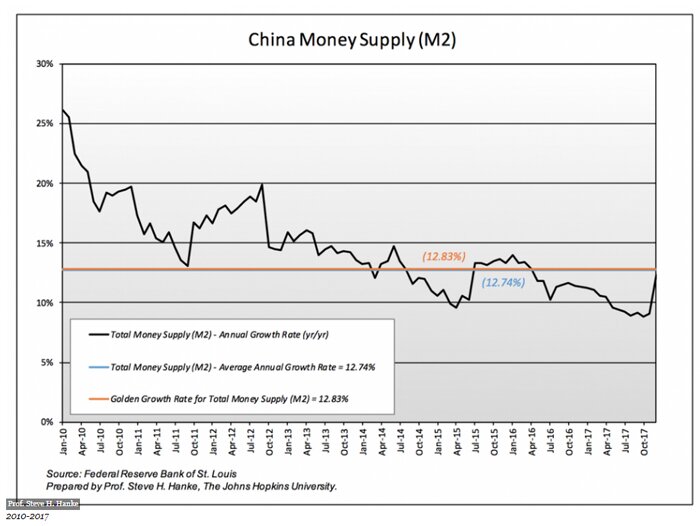
China, 2010-2017:
According to my calculations, the average percent real GDP growth from 2010 to 2017 was 7.95%, the average growth in Total Money Supply (M2) was 12.74%, and the average change in the velocity of money was -1.88%. Using these values and the People’s Bank of China’s inflation target of 3%, I calculated China’s “golden growth” rate for Total Money to be 12.83%.
Calculations:
Golden growth rate = Inflation target + Average real GDP growth – Average percent change in velocity
Golden growth rate = 3% + 7.95% - (-1.88%) = 12.83%
The table below summarizes my findings. For each of the periods analyzed, the People’s Bank of China has come close to hitting the “golden growth” rates for broad money growth. The People’s Bank of China knows how to hit the target and keep the economy running not too hot, not too cold.


