Chinese stocks have taken a hit in the past few weeks. The Shanghai Composite Index has tumbled by over 9% in the past thirty days, and for the year, the Index has shed 25%. This weakness in the equity markets reflects an anticipation that China’s economy might be cooling down.
Well, is a cool down in the cards? To answer that question, we must look at the money supply, broadly measured. Indeed, for me, a monetary approach to national income determination is what counts. The relationship between the growth rate of the money supply and nominal GDP is unambiguous and overwhelming. For example, just consider that in China from 2003-2017, the money supply grew at an annual rate of 14.92% and nominal GDP grew at a 14.67% annual rate.
So, what is China’s monetary temperature? Let’s first determine the “golden growth” rate for the money supply, and then compare the actual growth rate in China to the golden growth rate. To calculate the golden growth rate, I use the quantity theory of money (QTM). The income form of QTM states: MV=Py, where M is the money supply, V is the velocity of money, and P is the price level, and y is real GDP (national income).Calculations:
Golden Growth Rate = Inflation Target + Average Real GDP Growth – Average Percent Change in Velocity
Golden Growth Rate = 3.00% + 7.03% - (-1.83%) = 11.86%
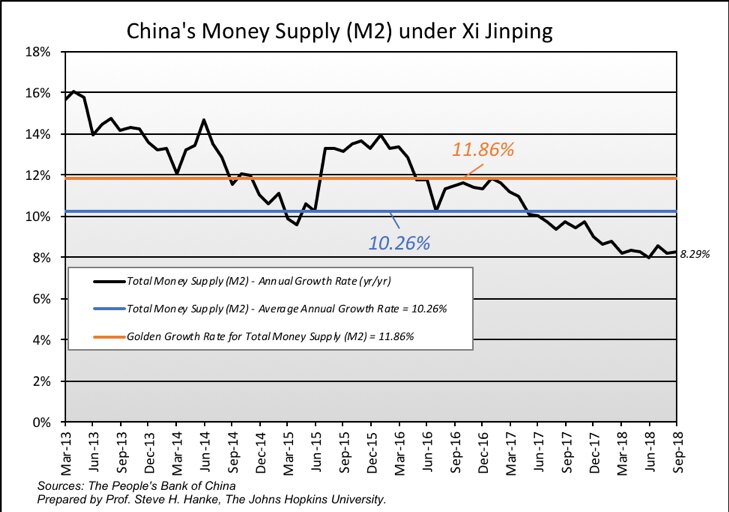
So, the growth rate of money supply (M2), which has been 10.26%, has lagged behind the golden growth rate (see my calculations and the chart below). This suggests an undue tightness on the part of the People’s Bank of China.
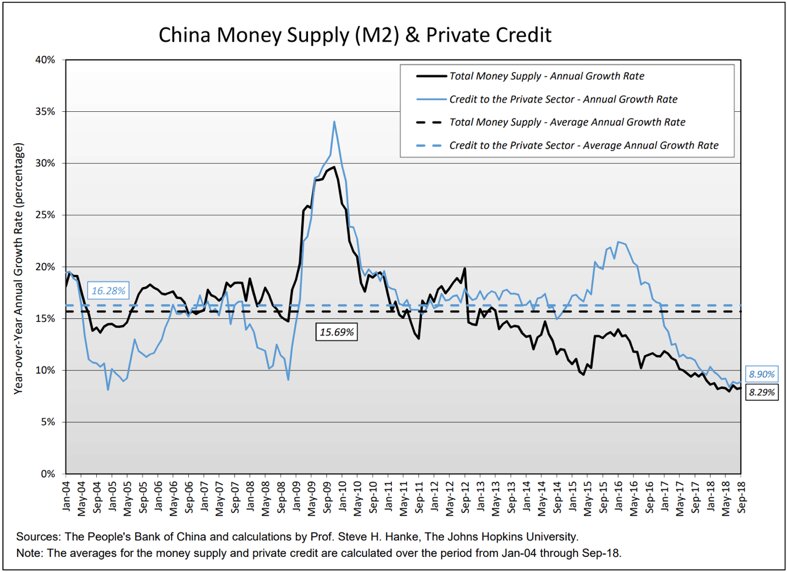
Further evidence of tightness is shown in the chart below. Both the money supply (M2) and private credit growth rates have plunged and are way below their trend rates of growth.
China is cooling. There is no doubt about it. No wonder the Chinese stock markets have been rattled. Investors anticipated cooling of the Chinese goes beyond China’s boundaries. China has been the biggest contributor to world growth for some time. If China cools, the world economy cools, a bit. And that’s not all, China is a big driver in the commodity markets. These sensitive markets have obviously anticipated a Chinese cool down. If you think the Chinese stock markets have taken a beating this year, just take a look at some of the metal markets.
Let’s use the QTM to make some bench calculations to determine what the “golden growth” rate is for the money supply. This is the rate of broad money growth that would allow the People’s Bank of China to hit its inflation target. I have calculated the golden growth rate from 2013 to the present—that’s the period in which President Xi Jinping has been in power.
According to my calculations, the average percent real GDP growth from March 2013 to September 2018 was 7.03%, the average growth in Total Money Supply (M2) was 10.26%, and the average change in the velocity of money was -1.83%. Using these values, and the People’s Bank of China’s inflation target of 3.00%, I calculated China’s golden growth rate for Total Money (M2) to be 11.86%.


