Following a 2007 Supreme Court decision restricting the use of race for school assignments, school boards desiring greater diversity turned to economic integration, meaning equalizing the proportion of low-income students in each school in a district. Among other claimed benefits, most advocates believe economic integration will reduce the achievement gap between low- and high-income students.
The integration is often accomplished using “controlled choice,” a method of assigning students to schools by giving parents some degree of “choice” among the public schools in their district. In larger school districts, controlled-choice plans can generate controversy and middle-class flight among parents who prefer neighborhood schools, similar to the “white flight” observed in earlier decades when mandatory busing was used to attain racially balanced schools.
A review of controlled-choice plans in six large districts in North Carolina, Kentucky, and Florida shows considerable and ongoing higher-income and white losses in these districts. While other demographic forces cannot be ruled out (e.g., urban to suburban movement for reasons unrelated to schools), neither can the unpopularity of controlled choice. More important, none of these districts has demonstrated significant closing of achievement gaps between higher- and lower-income students, one of the main justifications for these plans.
Introduction
“Controlled choice” is a method of assigning students to schools when school boards want to promote diversity, either racial or economic. Although Cambridge and Boston school systems adopted race-based controlled-choice plans in 1981 and 1989, respectively, controlled-choice plans did not become more widely used until the early 2000s.1
Eventually, controlled choice became associated with economic integration, a school diversity concept that the Century Foundation has widely promoted.2 When the Supreme Court restricted the use of a student’s race for school assignments in 2007, school boards desiring comprehensive school diversity plans had little choice but to adopt the economic integration model in which student poverty replaces race.3
By the late 1970s and 1980s, many public-school parents had become quite critical of “forced busing,” in part because they knew what was coming: mandatory reassignment from their neighborhood schools to schools in distant and unfamiliar neighborhoods (often via very long bus rides). In contrast, during the 2000s, controlled-choice plans for economic diversity operated somewhat “under the radar” in part because school boards often introduced them as parent-empowering “school choice” plans, dropping the adjective “controlled.” Moreover, most school boards justified these plans with claims of academic benefits for poor and minority children, yet the plans were maintained even when they failed to close or reduce achievement gaps.
The purpose of this paper is to describe what controlled-choice plans entail, explain what parents can expect regarding these policies, and present some relevant case studies of enrollment and achievement trends. In short, while most proponents of controlled-choice plans emphasize the “choice” component, the “control” aspect renders these plans more like race-based mandatory busing. Most larger school districts that have implemented controlled-choice plans have experienced (or are experiencing) demographic changes like those experienced during race-based busing, meaning the loss (or “flight”) of white and middle-class families. Moreover, there is ample evidence that economic diversity is not producing academic benefits for poor children in these districts. In other words, controlled choice can bring much pain and controversy for little or no educational gains, at least as measured by test scores.
The Policy Debate
Richard Kahlenberg, a longtime proponent of economic integration, is one of the strongest supporters of controlled-choice plans.4 He calls them “school choice” plans, but it is clear from detailed study that controlled choice is not true school choice.
In controlled-choice plans, a school district is divided into two or more zones, where each zone has about the same proportion of low-income students, usually defined as those qualifying for the federal free/reduced-price meals program. Students don’t have a right to attend a neighborhood school, only a right to attend a school in their zone of residence. Parents choose up to three schools they want their children to attend, ranking them in order of preference, and students are allocated to schools through a lottery, subject to socioeconomic quotas for each school. In a 35 percent low-income district, for example, the policy might be that no school can have less than 20 percent or more than 50 percent low-income students (the allowable ranges vary from plan to plan).
Although some parents can send their children to their neighborhood school if they rank it first, others cannot. Once the socioeconomic quota is reached for a school, students who would imbalance the quota are given their second or third choices, or even a school not chosen, especially one that needs more students of that status. Obviously, if a 65/35 district has a lot of 90/10 or 10/90 schools, many students would not be able to attend their neighborhood schools or other schools of choice. These students would be mandatorily bused to another school.
Since all controlled-choice plans involve some degree of mandatory busing, it should not be surprising that they are controversial and can cause white and middle-class flight. Civil rights expert Abigail Thernstrom evaluated controlled-choice plans in Massachusetts and wrote, “As a father in the system testified before the Boston school committee, controlled choice has been heavy on control and light on choice.“5 Desegregation expert Christine Rossell found that “controlled-choice plans are almost as unpopular as mandatory [busing] plans.“6 Given this unpopularity, it may not be surprising that a national study of school desegregation plans found that controlled choice produced almost as much white flight as regular mandatory busing.7 Chester Finn, former assistant secretary of education, has written that controlled choice
isn’t all that different from the “forced busing” of yesteryear. It restricts families’ education options and imposes a top-down, government-run, social-engineering scheme based on somebody’s view of the value of racial and socioeconomic integration.8
Supporters of economic integration plans generally downplay public opposition, in part because they believe the integration will improve academic performance of poor and minority children, thereby reducing achievement gaps. As Kahlenberg wrote, “Racial integration is a very important aim, but if one’s goal is boosting academic achievement, what really matters is economic integration.“9 He cites studies of the Programme for International Student Assessment testing data that find a very strong relationship between a school’s socioeconomic composition and test scores, leading other education researchers to endorse socioeconomic integration as a policy that reduces achievement gaps.10
Several recent studies of economic integration using more sophisticated data and methods have challenged the thesis that socioeconomic integration improves the achievement of disadvantaged children. A longitudinal study of test scores in Australia showed that a school’s socioeconomic status did not affect student performance, once prior test scores were taken into account.11 A study in the United States using North Carolina testing data found no effect of classroom socioeconomic composition once all of a student’s background characteristics were taken into account.12 Finally, a new study published in a leading education policy journal analyzed student test scores and socioeconomic status from three statewide databases and found that school economic integration had virtually no effect on math or reading scores once individual socioeconomic status was taken into account.13
To illustrate these various arguments, we shall examine several case studies of large school districts that adopted socioeconomic integration plans, most of which used controlled-choice methods. These districts are Wake County, North Carolina; Jefferson County, Kentucky; Lee, Manatee, and St. Lucie counties, Florida; and Charlotte–Mecklenburg County, North Carolina. We can track enrollment data over time for these districts, and we can examine changes in their achievement gap to test whether economic integration reduced the gaps.
Wake County: Much Controversy but No Academic Gains
Wake County has the largest K–12 enrollment in North Carolina; Charlotte–Mecklenburg Schools (CMS) has the second largest. Before starting economic integration, Wake County was complying with prior court orders to maintain racial desegregation. Its switch to economic integration in 2001 was influenced by various court decisions that disallowed the use of race in student assignment—namely, Tuttle v. Arlington County School Board in 1999, Eisenberg v. Montgomery County Public Schools in 1998, and a district court decision for CMS in 1999.14 Moreover, Wake County was influenced by writings such as those mentioned above that claim that economic integration improves achievement for low-income and minority students.15
Initially, economic integration was more feasible in Wake County than many other large school districts because the poverty rate was quite low. In 2000, the student poverty rate was only about 20 percent (compared with 40 percent for CMS), and most of the low-income (and minority) students lived in the city of Raleigh. Most of the Raleigh schools were converted to magnets, and since enough higher-income parents chose magnet schools, mandatory busing was kept to a minimum for several years.16
Poverty rates continued to rise, however, particularly with growing black and Hispanic populations.17 A major controversy broke in the mid-2000s over a new student assignment plan that meant more mandatory busing. This controversy led to contentious school board elections, and an anti-busing majority was elected in 2010. The new board promptly voted to stop the controlled-choice economic integration plan, and the district returned to neighborhood-based school assignment with voluntary magnet schools.
For all the controversy and turmoil caused by the controlled-choice plan, there are few benefits to proclaim.
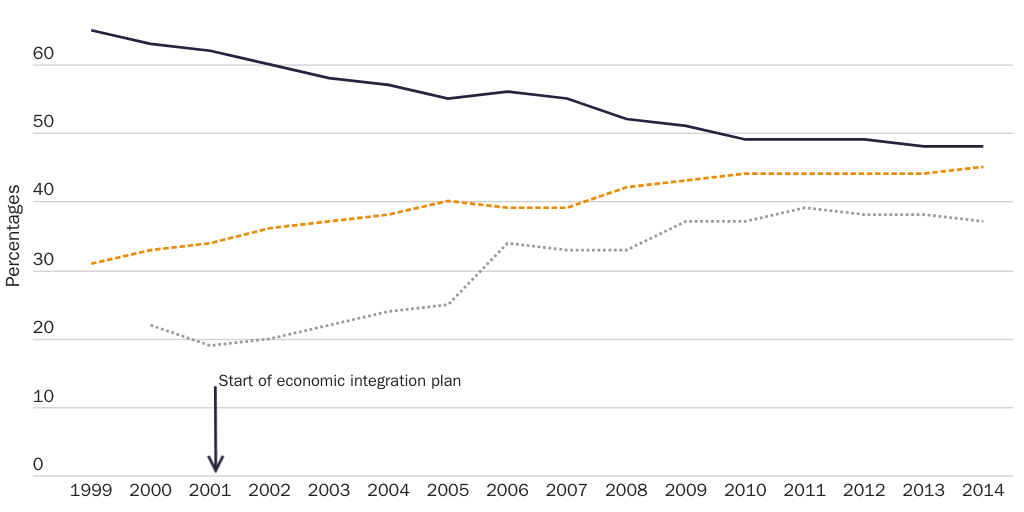
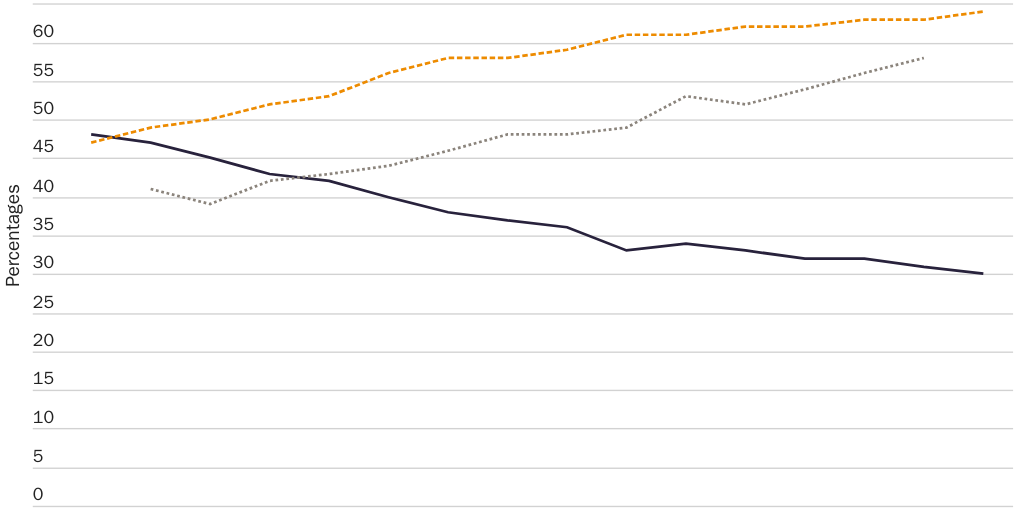
As shown in Figure 1, the proportion of low-income and minority students increased after the start of the economic integration plan while the proportion of white and higher-income students continued to decline. In terms of actual white enrollment changes, Wake County was experiencing white growth before the start of the increased mandatory busing (from 61,000 in 1999 to 69,000 in 2006). Between 2007 and 2010, white enrollment increases slowed (from 69,000 in 2006 to 71,000 in 2010), and after the controlled-choice plan ended, white enrollment resumed its prior trend (from 71,000 in 2010 to 75,000 in 2014).18 Although other nonracial demographic factors might have been involved, it is possible that the effect of mandatory busing was to slow the rate of white growth rather than cause white enrollment reductions.19
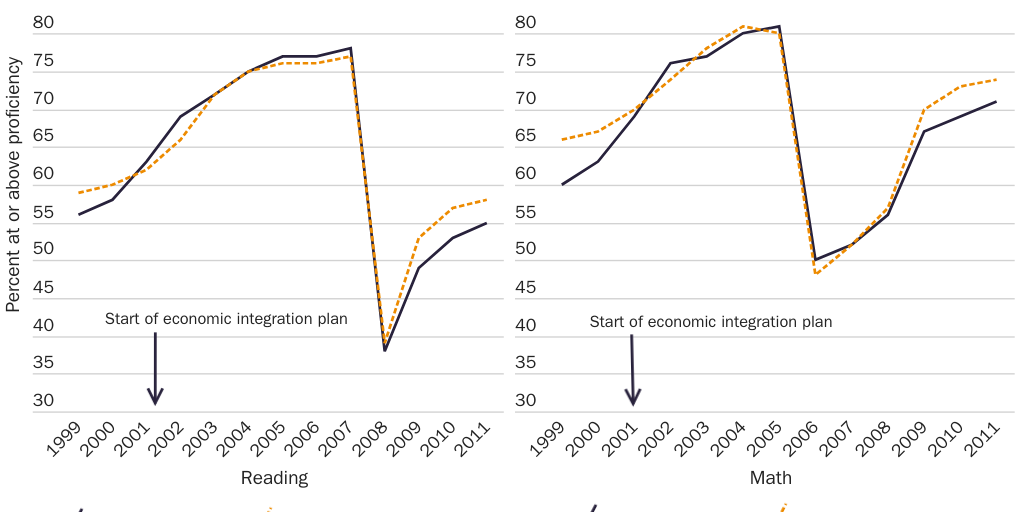
Contrary to claims of controlled-choice advocates, this demographic change comes with little or no achievement gain for Wake County low-income students compared with all low-income students in the state. Figure 2 shows that the academic achievement of low-income students in Wake County tracks within a few percentage points of low-income students across the state as a whole, despite the county having high economic integration for many years. After five years of controlled choice, the proficiency of Wake County low-income students was within 1 percentage point of all North Carolina low-income students.20
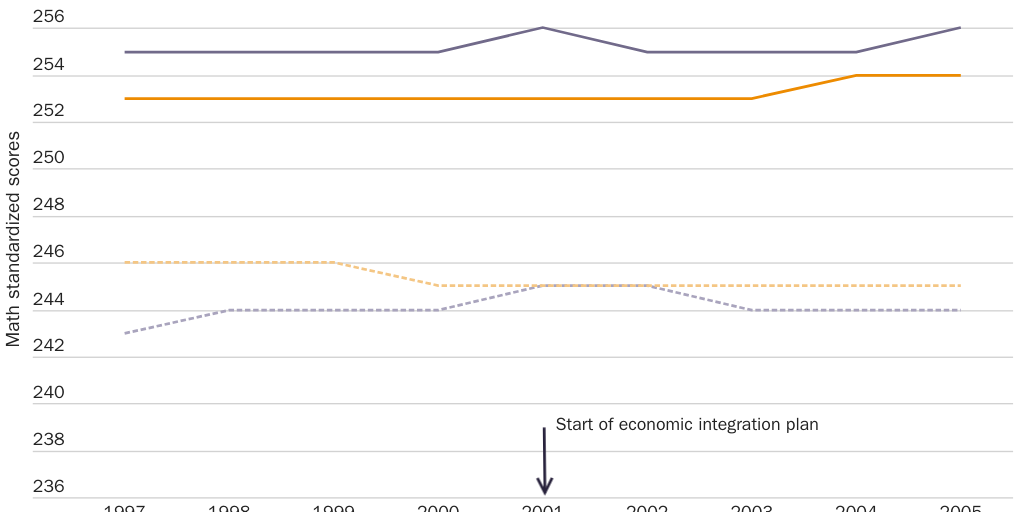
A separate analysis of Wake County standardized test scores, whose results are shown in Figure 3, found that there was an 11-point gap in math scores between paid and free-lunch students before controlled choice began. That gap was 12 points in 2005, five years after the start of the integration plan. The gap in Wake County was actually larger than the statewide gap of 9 points.
Controlled choice in Wake County caused much controversy and turmoil, yet there were no relative academic gains to show for it (that is, a closing of the achievement gap).
Jefferson County: Demographic Transition and Academic Disappointment
Jefferson County is an interesting case because it is one of a handful of school districts across the nation where the state government merged a county school district with a city school system—in this case, Louisville. The purpose of the 1975 merger was to enable racial desegregation, which would have been nearly impossible with separate city and county systems because the county schools were over 90 percent white while the Louisville schools were 90 percent black. After the merger, desegregation was accomplished by assigning some county white students to Louisville schools and Louisville black students to former county schools.
Desegregation came at the cost of considerable white enrollment loss. In 1968 there were over 110,000 white students in county schools and just under 30,000 black students in city schools. Following the merger, white enrollment dropped to about 90,000 in 1976 while black enrollment remained largely unchanged. Over the next several years, white enrollment continued to decline before stabilizing at about 63,000 in the early 1980s. Since black enrollment was relatively stable at about 30,000, meaningful desegregation was still possible despite the large white losses.21
Jefferson County was a party in the 2007 Supreme Court decision Parents Involved in Community Schools v. Seattle School District No. 1, which restricts the use of individual students’ races once districts have been released from court supervision. Since the county school board wanted to maintain diversity, it voted to adopt a controlled-choice plan that promoted economic integration.22 Unlike Wake County, the school board’s decision was not challenged in local elections.
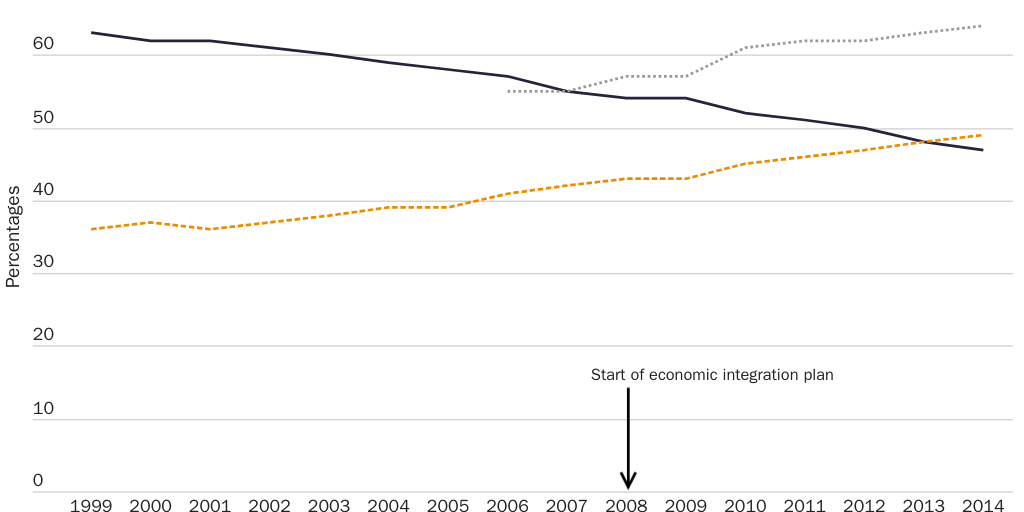
The controlled-choice plan was implemented in 2008, yet as shown in Figure 4, the racial makeup of the county continued to change, with some continuing white enrollment losses and increases in minority enrollment, both black and Hispanic. As a result, in 2014 Jefferson County became a majority-minority school district, with 39,000 white students and a minority population of 48,000 black and Hispanic students. It is now composed of two-thirds low-income students.23 At this point, Jefferson County has lost so many higher-income and white students that it can offer meaningful integration for only a fraction of its low-income and minority students.
Like Wake County, Jefferson County school officials defended the controversial policies of controlled choice and diversity because they expected academic benefits for minority and low-income students. The school board believed that the achievement gap between higher-income and low-income students (or the gap between minority and white students) would be closed or at least narrowed.
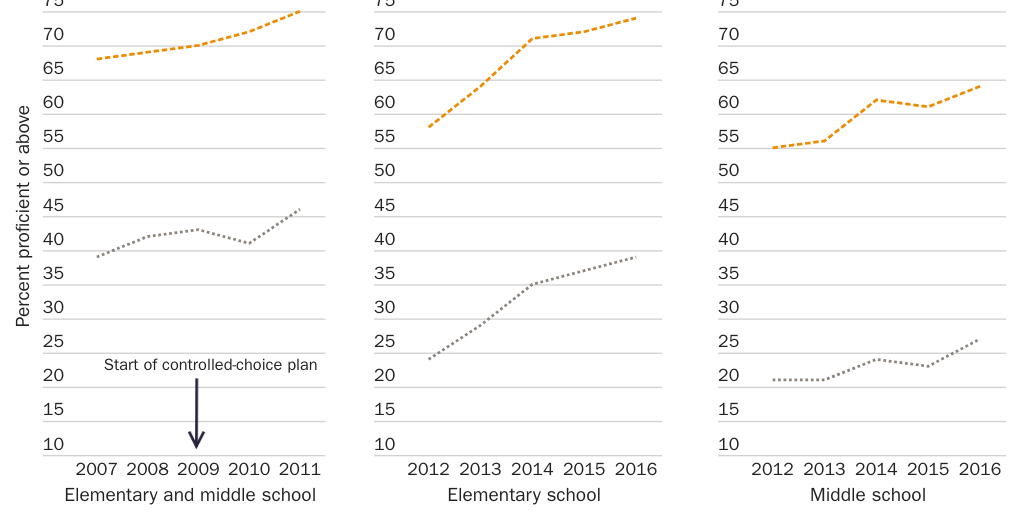
As Figure 5 shows, that has not happened. Before the controlled-choice plan, in 2007 the gap between low-income (free lunch) and higher-income students in math proficiency was about 29 percentage points. Two years after controlled choice, the gap was still 29 points. In 2012, though, Jefferson County schools adopted a new achievement testing program, which caused math proficiency to drop for both groups, and the gap between lower- and higher-income students increased somewhat to about 33 points for elementary students and 34 points for middle-school students. The gap grew slightly over the next four years. So, after seven years of a controlled-choice economic integration plan, the achievement gap not only failed to shrink, it actually widened. Jefferson County is another case of a mistaken belief that academic benefits flow from economic integration. It has received no academic payoff for maintaining an unpopular and destabilizing policy of controlled choice and economic integration.
More Controlled-Choice Plans: The Florida Cases
Several county school districts in Florida adopted controlled-choice plans in the early 2000s. This was partly in response to a state regulation mandating that all school districts design school-choice plans; although the regulation did not mandate implementation. The state did offer financial incentives to districts that implemented controlled-choice plans. Some Florida counties were still implementing court-ordered desegregation plans, so racial desegregation was the early objective. Other districts adopted economic integration early; all districts had to use economic status exclusively following the 2007 Supreme Court ruling.
Our discussion focuses on three Florida counties that adopted controlled-choice plans and are still operating at least some version of those plans: Lee County (Fort Myers–Cape Coral area), Manatee County (Bradenton–Palmetto area), and St. Lucie County (Fort Pierce–Port St. Lucie area). In the materials describing their controlled-choice plans, these school districts expressed their belief that diverse schools would enhance academic success. Although the districts may have believed this when they adopted their plans, another motivation for controlled-choice plans in Florida — and perhaps the reason for the legislative mandate — was the rapid enrollment growth throughout the state, which would cause continuing school reassignments if a neighborhood school plan was maintained.
All three districts have experienced major changes in their racial and economic composition, as shown in Figure 6. Lee County became a majority-minority school district in 2010, Manatee in 2014, and St. Lucie — which has had the longest-running controlled-choice plan — in 2006. St. Lucie is on its way to becoming a predominantly minority district.
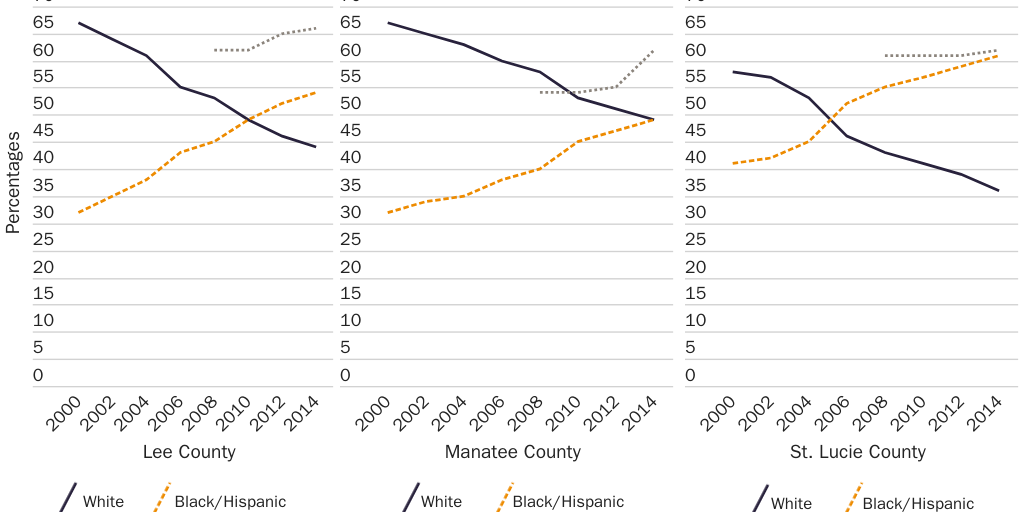
The decline in the percentage of white students is not necessarily an indication of white losses. It could indicate that minority populations are increasing more rapidly than the white population. For example, Lee and Manatee have maintained about the same white enrollment at 39,000 and 23,000, respectively, while their combined black and Hispanic enrollment has increased from about 17,000 to 40,000 and 11,000 to 23,000, respectively. In the case of St. Lucie, however, white enrollment has dropped from 17,000 to 14,000 compared with a near doubling of black and Hispanic enrollments from 12,000 to 23,000.24
All three districts now have a lot of low-income students, which like Jefferson County makes it increasingly difficult to offer a meaningful level of economic diversity that mixes low-income students with sufficient numbers of higher-income students. Obviously, the hypothesized academic benefit cannot be offered to most low-income students once a large majority of the students are from low-income homes.
Like Wake and Jefferson counties, these Florida school boards justify economic integration in part on educational benefits. They may also believe these benefits are worth the loss of higher-income students. However, two of these Florida counties show no evidence for the academic benefit thesis. Figure 7 shows that at least through 2010, when both districts had been operating their controlled-choice program for some years, Manatee County showed no reductions in its math achievement gap while Lee County showed a very small reduction of 3 percentage points. It is important to note that both higher- and lower-income groups showed major increases in proficiency rates, which is also true for Florida as a whole, and in fact the statewide gap in Florida reduced by 5 points. So, there may be broader programmatic or test changes at work. Whatever caused these increases, it does not appear to be economic integration.
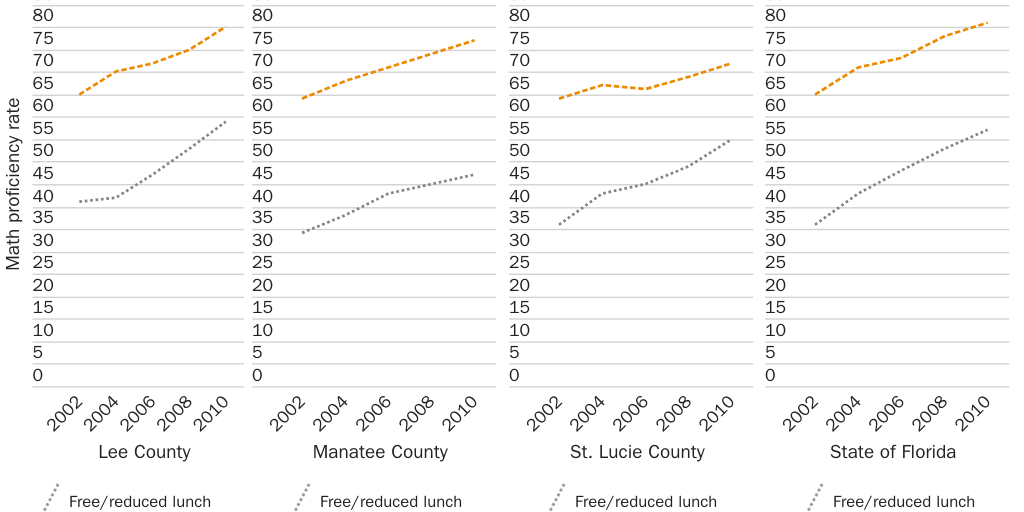
Figure 7 does show a significant reduction of 11 points in the math achievement gap for St. Lucie County, but it is not the result of the relative improvements in low-income scores. Rather, it is the product of slowing improvement in scores for the higher-income group. Higher-income students gained about 21 points for the state as a whole, but St. Lucie’s higher-income students gained only 8 percentage points.
Most Recent: New Plan in Charlotte–Mecklenburg County
The most recent large school district to experiment with an economic integration plan is Charlotte–Mecklenburg Schools. Surprisingly, CMS is not heeding the experiences of its neighbor, Wake County, where political turmoil led to the abandonment of controlled choice and a return (for the most part) to a neighborhood school system. It is also ignoring its past in which a major racial balance plan failed to close the achievement gap between black and white children. The U.S. Supreme Court ordered this plan in its 1971 Swann decision, the most famous “busing” decision in the history of desegregation cases. Despite ample local evidence that neither racial nor socioeconomic balance closes achievement gaps, the CMS Board of Education adopted a new student assignment plan designed to eliminate as many predominantly low-income schools as possible. Although it did not adopt all aspects of a controlled-choice plan, the first year of the plan (fall 2018) included several school pairing options, whereby predominantly high-income elementary schools were merged with predominantly low-income schools.
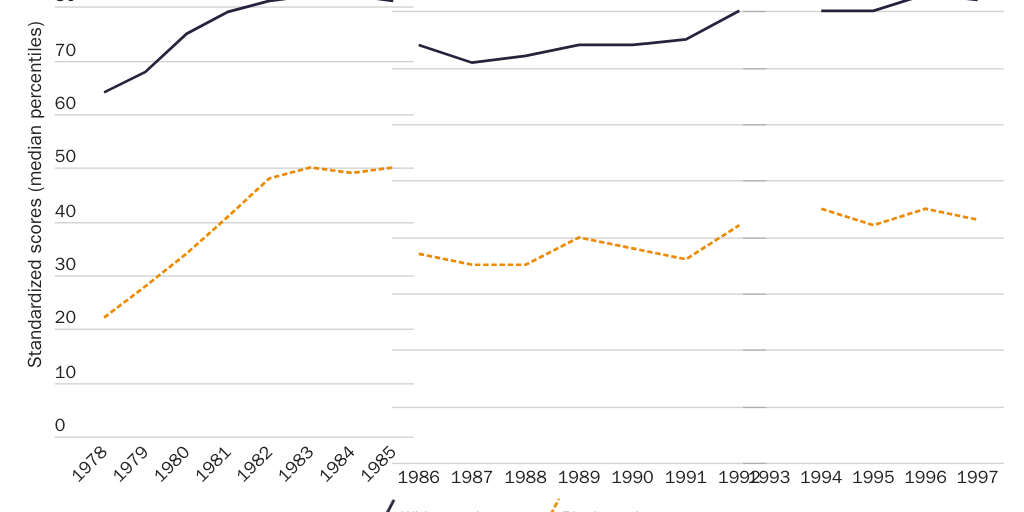
The failure of racial balance to affect the racial achievement gap was documented extensively in a district court hearing that took place in the late 1990s. Figure 8 replicates one of the exhibits offered in that case, and it shows that although there was fluctuation in test scores for both groups, after many years of racial balance the achievement gap was nearly as large in 1997 as it was in 1978. For some observers, it might be a mystery why the CMS school board believes that a new economic integration plan will succeed where other plans to increase diversity have failed.
According to the enrollment trends shown in Figure 9, less than 30 percent of the district’s students in 2014 were white and less than 40 percent were above the low-income line. There were even fewer students who might have been considered middle class. In 1999 white enrollment was 48,000 compared with 47,000 black and Hispanic students; in 2014 white enrollment had declined to 44,000 while black and Hispanic enrollment increased to 92,000.25
Given the unpopularity and controversy sparked by the board’s adoption of a new economic integration plan, a major goal of which is to reduce the number of schools with high proportions of low-income students, the percentages of white and higher-income families are likely to dwindle further until a point is reached where there will be little or no opportunity, within the CMS, to offer an integrated education to a meaningful number of low-income students, even on a voluntary basis.
Conclusion
In 1970 the U.S. Supreme Court approved, for the first time, a school integration plan for Charlotte–Mecklenburg that required mandatory busing of both black and white students to attain a relatively high degree of racial balance in nearly all schools. This watershed event led to similar racial integration plans throughout the South and in many larger school districts throughout the nation.
The era of mandatory busing generated great controversy and contributed to significant enrollment changes in the affected school districts, and many of these school districts became predominantly minority. No doubt some of the enrollment changes were due to preexisting demographic conditions and trends, but most experts agree that mandatory busing of students away from their neighborhood schools was a contributing factor.
These enrollment changes might have been easier to justify if they had led to significant reductions in the achievement gap. But whether forced school desegregation broadly has shrunk gaps is unclear due to difficulty isolating the effects of desegregation, while there is ample evidence that this did not happen in the controlled-choice cases documented here or in other, specific school districts that underwent racial desegregation.26
It’s puzzling, therefore, that many proponents of school diversity policies still claim that economic integration (using controlled-choice policies) will succeed in closing the achievement gap. Of course, the review here has by no means evaluated economic integration in all school districts where it has been tried. For example, we have not reviewed some of the smaller school districts where the policy has been implemented without the higher-income enrollment losses documented above. Controlled choice for economic integration is still in use in Cambridge, Massachusetts, a smaller school district with about 6,000 students, where the policy is not controversial. Perhaps size is a critical factor, and controlled choice might be more feasible in smaller, more homogeneous school districts.
For larger school districts, however, it is clear from the cases reviewed here that controlled choice for economic integration is not working as intended. It is still controversial, and it may be contributing to growing racial and economic isolation among some larger school districts. Most importantly, this policy has not been successful at achieving one of its major goals: closing achievement gaps.
To be clear, I do not oppose voluntary economic integration programs, where both low- and higher-income parents may come together in a magnet school or another school of choice. Indeed, there is some evidence that the court-ordered racial desegregation in the 1970s and 1980s improved some longer-term outcomes, such as college attendance or reduced rates of crime.27 These benefits must be evaluated against the negative effects of massive mandatory busing, which may have worsened racial isolation in the long run.
A voluntary approach, where students attend because of a mutual interest in a specific academic program or because they desire to experience ethnic or economic diversity, might yield some of the benefits of integration without the negative side effects. Indeed, my support of voluntary integration programs leads me to be skeptical of mandatory models, whose counterproductive demographic effects can reduce the opportunities for those who desire the potential social benefits of a voluntary integration program. In my opinion, integration cannot succeed where diversity is imposed from the top down, rather than being embraced by the very participants who are needed to make it work.
Citation
Armor, David J. “The Problems with Economic Integration and Controlled Choice.” Policy Analysis No. 880, Cato Institute, Washington, DC, September 24, 2019. https://doi.org/10.36009/PA.880.

About the Author
David J. Armor is professor emeritus in the Schar School of Policy and Government at George Mason University. The author thanks Wendy Allison for assistance in collecting the data.

This work is licensed under a Creative Commons Attribution-NonCommercial-ShareAlike 4.0 International License.