Policy Analysis

Global Inequality in Well‐​Being Has Decreased across Many Dimensions

Introducing the Inequality of Human Progress Index

Our index makes it clear that the world is better off than many people think and is also far more equal.

June 8, 2023 • Policy Analysis No. 949
By Chelsea Follett and Vincent Geloso
International Economics Consumers

The world has seen dramatic, global human progress across a broad range of indicators in recent decades, but have those gains been widely shared? The Inequality of Human Progress Index (IHPI) measures relative gaps in global development. It surveys international inequality across a greater number of dimensions than any prior index. By analyzing inequality in a multidimensional way, the IHPI takes inequality more seriously than those indexes that focus on income inequality alone. The IHPI considers material well‐​being and seven additional metrics: lifespan, infant mortality, adequate nutrition, environmental safety, access to opportunity (as measured by education), access to information (as measured by internet access), and political freedom. Across all but two of those dimensions, the world has become more equal since 1990. Globalization and market liberalization over the past few decades have not only raised absolute living standards but also reduced overall inequality.

Introduction

The evidence of dramatic, global human progress across a broad range of indicators (e.g., mortality, income, education, political liberties) in recent decades is well‐​established. Less known is that the gains have been widely shared rather than accruing mainly to a small elite.1 Globalization and market liberalization over the past few decades have not only raised absolute living standards but also reduced inequality by many meaningful measures.

In spite of that decline, inequality concerns have received increased attention from opinion‐​makers in recent years.2 According to Harvard University’s Steven Pinker, between 2009 and 2016, the share of New York Times articles mentioning “inequality” increased tenfold.3 Google’s Ngram viewer tool shows a marked rise in the use of the word “inequality” in English‐​language printed sources starting in 1955 and continuing through the most recent year of data, 2019 (see Figure 1).4

Not only are worries about inequality on the upswing, suggesting widespread confusion regarding the direction in which inequality is trending, but many conversations surrounding inequality remain restricted to income inequality. This narrow view compounds the well‐​documented problem that people are spectacularly wrong in assessing both trends in living standards and their distribution.5 Many people fail to note not only the substantial rise in income levels since the 1980s but the decrease in inequality on a global scale.6 In addition, frequently advertised data series on inequality overstate levels and trends, contributing to unduly negative perceptions.7

However, looking at income levels and distributions understates the improvements in living standards levels and distributions. Simply put, income is not the best way to capture overall differences in well‐​being. Living standards (or well‐​being or human welfare) encompass more. According to economist and philosopher Amartya Sen, a higher standard of living is achieved when the set of possibilities open to us increases.8 An extra dollar of income, by opening up more consumption choices for an individual, increases the choice set available to that individual. However, an individual in poor health will not gain as much from an extra dollar in terms of choice as a healthy person. Someone crippled by a debilitating disease will not be able to enjoy those choices as fully. Similarly, someone who is illiterate is less able to discover or unveil consumption possibilities opened up by an extra dollar of income. These relationships between different dimensions of choice possibilities explain why economists eschew the temptation to state that income fully speaks to living standards and why they emphasize a richer conception of living standards.

Inequality, in short, is multidimensional rather than purely monetary. Thus, thinking about inequality in terms of overall well‐​being makes more sense than myopically focusing on income inequality; income is only one (though admittedly important) aspect of well‐​being. And as economist P. T. Bauer famously noted, the death of a child raises a household’s per capita income—a poignant reminder that income and well‐​being are not the same.9 Income is ultimately an imperfect proxy for access to the things that add up to a high quality of life. Looking beyond that imperfect proxy and directly examining the constituent elements of well‐​being avoids such contradictions.

Those elements may include high life expectancy, a strong likelihood of surviving childhood, adequate nutrition, education, access to information, and political freedom, among others. All these indicators speak to a broader definition of development that asks the question, how large is the realm of choices open to individuals?

A direct, comprehensive, and accurate way of measuring differences in well‐​being casts a net that includes nonincome forms of inequality. Yet, until now, little effort has been made to capture the global state of inequality in human progress across a broad range of indicators. The Inequality of Human Progress Index (IHPI) seeks to rectify that omission by measuring how inequality has changed globally in a multidimensional manner. The index considers inequality across eight distinct dimensions: longevity, health, nutrition, environmental quality, education, internet access, income, and political freedom. By surveying inequality across a greater number of dimensions than any prior index, this project measures relative gaps in human progress with unprecedented breadth.

The idea has some precedent. Various scholars pioneered the creation of Gini indices to measure nonincome forms of inequality. Consider the work of political economist Nicholas Eberstadt.10 In his essay, “Longevity, Education, and the Huge New Worldwide Increases in Equality,” Eberstadt presents data showing that lifespan inequality has declined in Sweden and the United States. Economist Sam Peltzman found similar trends for mortality inequality, and his findings were confirmed by Benjamin Ho and Sita Slavov, going as far back as 1900 for the United States.11 Others have attempted to measure inequality in the stunting of young children’s height in African countries.12 The Clio‐​Infra Project (a group of economic historians) found that, since the 1880s, educational inequality has fallen worldwide.13 And in “A New Data Set of Educational Inequality in the World, 1950–2010: Gini Index of Education by Age Group,” Benaabdelaali Wail, Said Hanchane, and Abdelhak Kamal show that education inequality has declined globally in every geographic region.14

In 2014, Finnish political scientist Lauri Peterson found that the most comprehensive inequality measurement at the time was the United Nations Development Programme’s inequality‐​adjusted Human Development Index (HDI). The index examines economic (specifically, income), health (specifically, life expectancy), and educational (specifically, schooling years) inequality.15 However, even that measure is limited, examining only three dimensions of inequality. Peterson concluded that “well‐​being indices should make further strides to ensure the capture of non‐​economic inequality.” The IHPI does exactly that by taking into account additional metrics.

The most ambitious assessment of global inequality in broadly defined well‐​being, however, comes from economic historian Leandro Prados de la Escosura.16 Prados de la Escosura relies on an augmented definition of the HDI that includes political liberties at benchmark dates (i.e., not continuously) for a balanced panel of countries since 1870. His main finding is unsurprising for experts who have documented long‐​run trends in the HDI.17 He confirmed that human development has increased substantially. However, he innovated in two ways. First, he employed new methods to better capture improvements at the very top and bottom (e.g., the best‐​off and worst‐​off segments of the population). Second, he assessed the evolution of the distribution of what he calls the Augmented Human Development Index. He found that inequality has essentially been falling since the late 1920s as major improvements in schooling, life expectancy, and political liberties for the poor manifested before major improvements in incomes.

The IHPI builds on Prados de la Escosura’s work by capturing a wider number of indicators that can be tracked continuously since 1990. And it confirms his findings of major improvements in both the levels and distribution of human progress. In fact, the IHPI shows even more dramatic improvements than Prados de la Escosura found. The resulting view of the state of global inequality shows with new clarity that the global progress of the past few decades has made humanity not only more prosperous but more equal.

Does Inequality Matter?

Given the increasing level of attention that income inequality concerns have received in recent years, addressing public misapprehensions about the state of global inequality is an urgent matter. Public focus on inequality not only suggests widespread ignorance of the downward trend in global inequality, it can also be harmful because absolute rather than relative measures of progress remain the best standard by which to judge the success of different institutions and policies.

Two points support this claim. First, the empirical literature tends to show that people are tolerant of highly unequal distributions of income.18 However, their tolerance is conditional on the perception that the distribution reflects merit, not privilege, and that social mobility is possible. There is no evidence of widespread inequality‐​induced unhappiness. As research by sociologists Mariah Evans and Jonathan Kelley shows, in developing countries, increased economic inequality as people rise out of poverty is often seen as a heartening sign that upward mobility is achievable—and can coincide with greater happiness.19 Other research has similarly found “a complete lack of any effect of inequality on the happiness of the American poor.”20 As economist Finis Welch eloquently put it, “inequality is destructive whenever the low‐​wage citizenry views society as unfair, when it views effort as not worthwhile, when upward mobility is viewed as impossible or as so unlikely that its pursuit is not worthwhile.”21

In response, many economists have started to emphasize the importance of the institutional context in determining whether inequality could be associated with undesirable socioeconomic outcomes.22 Where improvements in living standards are widespread and fast, and the rich are not protected through privileged status in law, income inequality appears far less problematic.

Such research often studies inequality within countries. But many of the loudest voices expressing concern about global inequality are, similarly, less worried about inequality per se than about whether the currently rich countries achieved that status through unjust or exploitative means (often focusing on the history of colonial ventures). Putting aside the question of the conditions giving rise to inequality, the IHPI measures a broader conception of inequality in living standards than income inequality alone and so captures whether improvements are widespread.

Second, and more important, economic development foils the relevance of income as a proxy for well‐​being. Consider a simplistic world with two types of economies: subsistence and rich. In a subsistence economy, all actors skirt the line between survival and death, and all decisions are aimed at meeting basic needs.23 No matter how different people are in the subsistence economy, the tough constraints they face leave little place for differences in outcomes. There is only one choice: subsistence or death. Technically, a society in which everyone has the same “subsistence income” has no inequality. In the rich econ­omy, things are very different. The wealth in that economy means that individuals have a greater variety of ways to maximize their well‐​being. Some financially ambitious individuals devote countless hours to amassing wealth to leave to their heirs or to purchase rare and unique goods and services. Others dedicate their time to leisurely pursuits or highly enjoyable but less well‐​remunerated professions even if that results in lower incomes. The concept of “psychic income”—defined as “rewards (as in prestige, leisure, or pleasant surroundings) not measurable in terms of money or goods but serving as an incentive to work in certain occupations or situations”—helps explain the draw of certain low‐​paying careers.24 The rich society may have greater income inequality. However, that inequality is meaningless because it results from choices that some people made to pursue things other than material satisfaction. Because rich societies offer many ways to live a fulfilling life, rich societies, in particular, cannot use income as a synonym for well‐​being.

This second point helps explain why income inequality has been rising in western societies while inequality in life satisfaction and happiness has been falling.25 More‐​developed societies offer more paths to happiness and human flourishing than less‐​developed ones such that income inequality loses much of its relevance or meaning with development. However, the IHPI mitigates this problem. It aims to directly measure the state of well‐​being and range of choice available to individuals worldwide by taking into consideration many dimensions of human progress. Thus, we tackle inequality in the way that most meaningfully matters to those who are concerned about human flourishing. Measuring the multidimensional evolution in inequality of human progress rather than income is crucial to provide a fuller picture of the state of the world. Simply put, a measurement of inequality in human progress takes inequality more seriously than a focus on income inequality alone.

Constructing the Human Progress Index

To create the IHPI, it was first necessary to construct the Human Progress Index (HPI). Like the UN’s HDI, the HPI measures different dimensions of human development on a scale from zero to one, where higher values are better than lower values.26 As with the HDI, all index components are given equal weight. For a full discussion of the methods used to create this alternative to the HDI, see the appendix. The main difference is that the HPI is more expansive than the HDI. Generally, the HDI employs three components: life expectancy at birth (adjusted or unadjusted for disabilities), schooling (generally in mean years of schooling), and income. The HPI relies on the same underlying mathematical logic but adds more components.

Components of the HPI and the Minimums and Maximums

The indicators were chosen with consideration to the availability of data (the extensiveness of each data set’s year range and coverage of different countries) and with the goal of capturing a broad cross‐​section of the variables that directly constitute life quality.27 Those parameters constrain us to the post‐​1990 period (some variables are not available before or are not available for a large number of countries before that date).28 Each indicator speaks to a component of human progress that matters in terms of broadly defined well‐​being.

The components are as follows:29

  1. Lifespan: life expectancy at birth, years
  2. Childhood survival: infant mortality rate, per 1,000 live births
  3. Adequate nutrition: food supply, per person, per day
  4. Safe environment: outdoor air pollution death rates
  5. Access to opportunity: mean years of schooling, number
  6. Access to information: internet users, per 100 people
  7. Material well‐​being: GDP per person
  8. Political freedom: democracy versus autocracy over time, scale 0 to 40 (rescaled from source)

Table 1 shows the minimums and maximums selected for each indicator. The values for infant mortality rate are based on the range of observed values since 1990. (No country exceeded 300 deaths per 1,000 live births.30) We applied a similar logic in determining the minimum and maximum for outdoor air pollution death rates. The values for life expectancy, years of schooling, and income are based primarily on the work of Prados de la Escosura; the exception is maximum life expectancy, which we increased from 85 to 87 because a number of countries had exceeded his maximum by 2018.31 The minimum for calories is based on the range of lower‐​bound estimates of basal metabolic rates.32 The maximum was chosen arbitrarily as a high value of caloric intake. Internet access and political liberty have near‐​zero values as their minimum and the highest score possible (full marks or full access) as the maximum. For internet access, we assumed that a value of zero was slightly above zero (0.0001 instead of 0) to be able to compute the index. For political liberty, we rescaled the Polity5 democracy data to avoid negative values.33

These indicators are combined using the HDI formulation to create two versions of the HPI—one with and one without the internet access component. The internet variable, because of rapid progress in that area since 1990, has a substantial effect on the level of the index (see next section). We were able to create the HPI for 142 countries continuously from 1990 to 2018.

Measuring Inequality

Once the HPI is calculated, we can measure the evolution of inequality within that index. Due to a lack of detailed distribution data for many countries on key metrics, our effort focuses on inter‐​country inequality and on global interpersonal inequality rather than within‐​country inequality. We use two measures of inequality: the mean log deviation (MLD) and the Gini coefficient.34 Both measure inequality among the values in a distribution, and both represent a situation of perfect equality as a value of zero; the Gini coefficient represents maximal inequality as a value of one while the MLD takes on larger positive values as incomes become more unequal. (In a world where everyone has the same income, both the MLD and Gini coefficient of income inequality are zero.) The measures are very similar and are commonly used in the literature. Some economists seem to have a slight preference for the MLD.35 We are agnostic, as our results appear unaffected by which of the two is used (see next sections).

The Human Progress Index and Inequality

Figure 2 shows the average global HPI from 1990 to 2018. Regardless of the specification used, important improvements are evident. Indeed, reweighting the average for the population of the different countries does not alter the conclusion that significant progress has been made.

Including or excluding the internet access component changes only the extent of the progress. Obviously, very few people worldwide had internet access in 1990; the pace of improvement is far greater when the component is included. It also explains why the index starts at such a low floor compared with when the internet access component is excluded. Without the internet access component, the improvement in HPI is between 35.9 percent (weighted for population) and 41.8 percent (not weighted for population). With internet access, the improvements are between 415 and 509 percent, respectively. Although some may argue that the huge improvement in this metric skews the index, the incredible amount of information, knowledge, and opportunities that the internet provides when available is worth considering. As such, it does contribute to considerable improvement.

Featured Media

More important, all variants of the HPI suggest larger improvements in human well‐​being than reported in the United Nations’ HDI and the estimates from Prados de la Escosura’s Augmented HDI.36 Table 2 shows this comparison. Prados de la Escosura used the nonlinear form for the index we employ in this policy paper in contrast to the United Nations, which used the linear form. This switch suggests a mildly faster rate of improvement just from changing the form of the index (+24.7 percent versus +22.1 percent). The HPI index suggests much faster improvements (+35.9 percent to +41.8 percent) than both because of the other components of human progress we added (excluding the internet component). Overall, the HPI suggests humanity has witnessed more progress in living standards than is commonly appreciated.

The Inequality of Human Progress Index

Calculating for inequality in the HPI results in the IHPI. Figure 3 shows the evolution of the Gini coefficients for all specifications of the HPI. Figure 4 shows the same evolution but using the MLD instead. Both figures show that the world is more equal today than it was in 1990—regardless of whether we use the population‐​weighted or unweighted versions of the inequality measures.

The HPI with internet access included suggests that inequality initially increased in the early 1990s and then began to fall rapidly. Inequality appears to rise because only a few countries saw a surge in internet access at first. However, as internet access spread to other countries, inequality began falling rapidly. By 2018, inequality was between 35.3 and 49.4 percent lower than it was in 1990. Switching to the HPI without internet access shows a more muted but still considerable reduction in inequality, between 16.1 and 22.3 percent.

Featured Event

These findings are important for two reasons. The first and most obvious reason is that they show the progress in HPI was widely shared. The second and less obvious reason is that they show there was momentous progress at the bottom. The nonlinear index form we used for the nonincome components of the HPI tends to award greater importance to improvement near the top (see Figure A.1 in the appendix) whereas identical improvements at the bottom are awarded a lower value on the index. If the improvements depicted in Figure A.1 were driven by already highly developed countries, inequality should have increased. If every country received the same improvements (e.g., same extra number of years), here again inequality should have increased. Given the form of the index, a drop in inequality can only occur if poorer nations enjoyed substantially larger gains than richer nations. As a result, Figures 3 and 4 show a rapidly falling level of worldwide inequality.

To consider the importance of this improvement at the bottom, it is useful to note the inequality in each of the components without any indexes—that is, the inequality in each indicator as is (e.g., life expectancy at birth in years; infant mortality in deaths per 1,000 live births; GDP per capita in real terms). This approach allows us to increase the number of countries we can look at. As already noted, the HPI was computed for a country if it provided a value for each indicator for each year between 1990 and 2018. If a variable was missing for some years, that country was dropped from the entire data set. This is how we ended up with only 142 countries. By considering each indicator separately, we can extend the data set to see if inequality falls in all the indicators when more than 142 countries are available. Figures 5 (with Gini coefficients) and 6 (with MLD) depict the results. These figures suggest momentous reductions in inequality. For example, the Gini coefficients all fell: life expectancy (29.2 percent), school years (29.0 percent), democracy (41.1 percent), food supply (30.0 percent), and internet access (70.4 percent). Similar reductions are observed in Figures 7 and 8, weighted for population. Moreover, inequality in income rises initially before falling since the mid‐​2000s. These reductions in inequality are substantial. Similar reductions are observed with MLDs. This finding essentially confirms that considerable gains in well‐​being went to the poorest in the world.

However, some indicators appear to show trends toward more inequality. This is the case for infant mortality and mortality from outdoor air pollution. The latter may be the result of the environmental Kuznets Curve, which stipulates that pollution increases with economic growth until a critical point is reached, after which pollution starts to fall. In our case, the rising inequality in outdoor air pollution may reflect that some countries are undergoing this transition.37 The trend in infant mortality may reflect that child mortality has not fallen as fast (proportionally) in low‐​income countries as in high‐​income countries since 1990.38 To be sure, infant mortality has fallen globally in absolute terms. But improvements since 1990 seem to have happened proportionally faster in high‐​income countries. These countries have access to the latest medical technology, such as state‐​of‐​the‐​art neonatal intensive care units that improve the chances of survival for premature infants; thus, global inequality may not have declined across this dimension post‐​1990.

How important are the reductions in inequality? One way to contextualize our findings is to compare them (again) with the United Nations’ HDI and Prados de la Escosura’s Augmented HDI. The top two panels of Table 3 show the reductions in inequality according to the HDI and Prados de la Escosura: 23.7 percent with Gini coefficients (only available for the HDI) and between 26.7 and 47.8 percent with MLDs. In contrast, the bottom two panels of Table 3 show our results. We find that inequality fell 16.1 to 35.3 percent with Gini coefficients compared with 34.4 to 59.0 percent with MLDs. Given the structure of our index, the methodologically closest comparison is Prados de la Escosura’s Augmented HDI. And we find larger declines than he does. Compared with the United Nations’ HDI, we find smaller reductions in inequality when the internet access component is excluded but larger reductions when it is included. Thus, we believe our findings suggest that existing series not only underestimate the improvement in human well‐​being (see Figures 2 and 3) but that they also tend to underestimate the share of the improvements that went to the poorest in the world. In other words, global equality has grown more quickly than those measures suggest.

Conclusion

The tendency to underestimate improvements in global well‐​being is widespread. Perhaps even more widespread is the tendency to underestimate how widely shared these improvements are. The IHPI aims to tackle those tendencies directly.

Indeed, the index comprises a larger number of dimensions than the United Nations’ HDI and Leandro Prados de la Escosura’s Augmented HDI and uses an innovative methodology to properly capture improvements. This richer measure of well-being—or human progress—allows us to see that improvements have been greater than is commonly appreciated.

Featured Event

Moreover, we believe that inequality in human progress is far more meaningful than inequality of income. Individuals in rich societies have far more paths to happiness and satisfaction than just income maximization, and examining higher incomes alone does not capture those nonmonetary aspects of well‐​being.

Because of its greater multidimensionality, the IHPI provides a more meaningful understanding of well‐​being and progress, as well as their distribution. Our index makes clear not only that the world is better off than many people appreciate, but that the world is also far more equal.

Appendix

The Human Progress Index (HPI) produced in this paper follows the same architecture as the Human Development Index (HDI) pioneered by Mahbub ul Haq and incorporated into Amartya Sen’s work with regard to the definition of human development. The HDI uses the following formulation:

where each of the n indicators I is a component of human development (e.g., education, income, life expectancy at birth).

The multiplication operator is not just a mathematical expression here; it carries a deeper conceptual meaning about human well‐​being. Consider the extreme scenario in which the most educated person in the world has a perfect bill of health but zero income. Such extreme poverty means this individual will likely die and that education and health provide no value. Mathematically, this person’s HDI would be zero (since multiplying by a single zero in an identity yields zero), which reflects the utter worthlessness of perfect health and immense education in a situation of extreme poverty. The multiplicative property suggests that higher values on all indicators in the index are better than a concentrated improvement in a single indicator.39 Phrased differently, the multiplicative operator speaks to the distributive (rather than additive) property of human development.

The HPI differs from the HDI in that it employs more components. Generally, the HDI employs three components: life expectancy at birth (adjusted or unadjusted for disabilities), schooling (generally in mean years of schooling), and income. The HPI relies on the same logic regarding the multiplicative operator but uses additional components. Conceptually, this is what we want for the HPI since human progress, by virtue of being multidimensional, consists of components that reinforce each other.

Next, we must explain how each indicator is converted into an indexed form. Normally, each indicator is transformed using the following form:

where I is the indicator, xi is the value of the variable in question in country i, and mo and m are the minimum and maximum values of that variable.

This formulation contains an indicator between zero and 1 as a result of the use of maximum and minimum values in the denominator and the presence of the minimum in the numerator.40 This form is known as a linear index; it imposes an implicit assumption that any improvement in xi is equally important regardless of whether it is an improvement from a low floor or from a high ceiling. This is problematic for some variables such as life expectancy. An additional year of life expectancy is far more impressive at 85 years than at 35 years because we expect achievements near the maximum to be harder to accomplish than those nearer to the minimum. This is even more problematic for variables that speak to mortality, health, education, and levels of access (e.g., internet access, connection to clean water) as they either have a firm ceiling (i.e., the share of internet‐​connected population cannot exceed 100 percent) or a strongly binding one. To circumvent this issue, the index can be converted into a nonlinear shape for the problematic indicators using the following equation:41

This formulation keeps the index between zero and 1 but allows for nonlinearity where achievements near the maximum receive a higher score than achievements nearer to the minimum. Figure A.1 shows a simulation of this equation for life expectancy (where the minimum is 20 and the maximum is 87). Values nearer to the upper limit of a life expectancy at birth of 87 years have higher values in the index. This is a crucial detail. With the exception of GDP per capita (which uses the first formulation), all the indicators in the HPI employ this formulation.

Citation

Follett, Chelsea, and Vincent Geloso. “Global Inequality in Well‐​Being Has Decreased across Many Dimensions: Introducing the Inequality of Human Progress Index,” Policy Analysis no. 949, Cato Institute, Washington, DC, June 8, 2023.

Download the Policy Analysis

About the Authors
Vincent Geloso portrait
Vincent Geloso

Assistant Professor of Economics, George Mason University

Notes

1. “History of Progress,” Human​Progress​.org, accessed April 11, 2023; Leandro Prados de la Escosura, Human Development and the Path to Freedom (Cambridge, UK: Cambridge University Press, 2022); Prados de la Escosura, “Augmented Human Development in the Age of Globalization,” The Economic History Review 74, no. 4 (2021): 946–75; and Lant Pritchett, “Development Happened. Did Aid Help?,” Oxford Blavatnik School of Government and LSE, March 10, 2022.

2. Fabian T. Pfeffer and Nora Waitkus, “The Wealth Inequality of Nations,” American Sociological Review 86, no. 4 (2021): 567–602; Marianne Nordli Hansen and Maren Toft, “Wealth Accumulation and Opportunity Hoarding: Class‐​Origin Wealth Gaps over a Quarter of a Century in a Scandinavian Country,” American Sociological Review 86, no. 4 (2021): 603–38; and Jan Schulz, Daniel M. Mayerhoffer, and Anna Gebhard, “A Network‐​Based Explanation of Inequality Perceptions,” Social Networks 70 (2022): 306–24.

3. Steven Pinker, Enlightenment Now: The Case for Reason, Science, Humanism, and Progress (New York: Viking Books, 2018), p. 97.

4. See Google Books Ngram viewer, accessed April 11, 2023.

5. Jan Schulz, Daniel M. Mayerhoffer, and Anna Gebhard, “A Network‐​Based Explanation of Inequality Perceptions,” Social Networks 70 (2022): 306–24; and Hans Rosling, Factfulness (Paris: Flammarion, 2019).

6. Soondong Hong, Heejoon Han, and Chang Sik Kim, “World Distribution of Income for 1970–2010: Dramatic Reduction in World Income Inequality during the 2000s,” Empirical Economics 59, no. 2 (2020): 765–98; and Branko Milanovic, “Global Income Inequality by the Numbers: In History and Now—an Overview,” World Bank Policy Research Working Paper no. 6259, November 1, 2012.

7. Vincent Geloso and Phillip Magness, “The Great Overestimation: Tax Data and Inequality Measurements in the United States, 1913–1943,” Economic Inquiry 58, no. 2 (2020): 834–55; Vincent J. Geloso, Phillip Magness, John Moore, and Philip Schlosser, “How Pronounced Is the U‑Curve? Revisiting Income Inequality in the United States, 1917–60,” Economic Journal 132, no. 647 (2022): 2366–91; Gerald Auten and David Splinter, “Top 1 Percent Income Shares: Comparing Estimates Using Tax Data,” AEA Papers and Proceedings 109 (2019): 307–11; Jeff Larrimore, Richard Valentine Burkhauser, Gerald Auten, and Philip Armour, “Recent Trends in US Income Distributions in Tax Record Data Using More Comprehensive Measures of Income Including Real Accrued Capital Gains,” Journal of Political Economy 129, no. 5 (2021): 1319–60; George Mechling, Stephen Miller, and Ron Konecny, “Do Piketty and Saez Misstate Income Inequality? Critiquing the Critiques,” Review of Political Economy 29, no. 1 (2017): 30–46; and Vincent Geloso and Peter Lindert, “Relative Costs of Living, for Richer and Poorer, 1688–1914,” Cliometrica 14, no. 3 (2020): 417–42.

8. Amartya Sen, The Standard of Living (Cambridge, UK: Cambridge University Press, 1988); Amartya Sen, “Markets and Freedoms: Achievements and Limitations of the Market Mechanism in Promoting Individual Freedoms,” Oxford Economic Papers (1993): 519–41; and Amartya Sen, Development as Freedom (Oxford, UK: Oxford University Press, 2001).

9. Peter Thomas Bauer, From Subsistence to Exchange and Other Essays (Princeton, NJ: Princeton University Press, 2000), pp. 30–31.

10. Nicholas Eberstadt, “Longevity, Education, and the Huge New Worldwide Increases in Equality,” in Anti‐​Piketty: Capital for the 21st Century, ed. Jean‐​Philippe Delsol, Nicolas Lecaussin, and Emmanuel Martin (Washington: Cato Institute, 2017).

11. Sam Peltzman, “Mortality Inequality,” Journal of Economic Perspectives 23, no. 4 (2009): 175–90; and Benjamin Ho and Sita Nataraj Slavov, “An Alternative Perspective on Health Inequality,” Economics Bulletin 32, no. 4 (2012): 3182–96.

12. Andrew Dabalen, Ambar Narayan, Jaime Saavedra‐​Chanduvi, and Alejandro Hoyos Suarez, Do African Children Have an Equal Chance?: A Human Opportunity Report for Sub‐​Saharan Africa (Washington: World Bank Group, 2015), p. 28; and Giovanni Andrea Cornia, ed., Inequality, Growth, and Poverty in an Era of Liberalization and Globalization (Oxford, UK: Oxford University Press, 2004).

13. Clio‐​Infra Project, “Educational Inequality Gini Coefficient,” https://​clio​-infra​.eu/​I​n​d​i​c​a​t​o​r​s​/​E​d​u​c​a​t​i​o​n​a​l​I​n​e​q​u​a​l​i​t​y​G​i​n​i​C​o​e​f​f​i​c​i​e​n​t​.html.

14. Benaabdelaali Wail, Said Hanchane, and Abdelhak Kamal, “A New Data Set of Educational Inequality in the World, 1950–2010: Gini Index of Education by Age Group,” SSRN Electronic Journal (2011); and Benaabdelaali Wail, Said Hanchane, and Abdelhak Kamal, “Chapter 13 Educational Inequality in the World, 1950–2010: Estimates from a New Dataset,” in Inequality, Mobility and Segregation: Essays in Honor of Jacques Silber, ed. John A. Bishop and Rafael Salas (Bingley, UK: Emerald Publishing, 2012).

15. Lauri Peterson, “The Measurement of Non‐​economic Inequality in Well‐​Being Indices,” Social Indicators Research 119 (2014), 581–98; and “Human Development Index (HDI),” United Nations Development Programme Human Development Reports, accessed April 11, 2023.

16. Leandro Prados de la Escosura, Human Development and the Path to Freedom (Cambridge, UK: Cambridge University Press, 2022).

17. Nicholas Crafts, “The Human Development Index, 1870–1999: Some Revised Estimates,” European Review of Economic History 6, no. 3 (2002): 395–405.

18. Azim F. Shariff, Dylan Wiwad, and Lara Beth Aknin, “Income Mobility Breeds Tolerance for Income Inequality: Cross‐​National and Experimental Evidence,” Perspectives on Psychological Science 11, no. 3 (2016): 373–80; Christina Starmans, Mark Sheskin, and Paul Bloom, “Why People Prefer Unequal Societies,” Nature Human Behaviour 1, no. 4 (2017): 1–7; Nick Cowen and Vincent Geloso, “Capital, Ideology, and the Liberal Order,” Analyse & Kritik 43, no. 2 (2021): 413–35; and Mikayla Novak, Inequality: an Entangled Political Economy Perspective (London: Palgrave Macmillan, 2018).

19. Jonathan Kelley and Mariah D. R. Evans, “Societal Inequality and Individual Subjective Well‐​Being: Results from 68 Societies and over 200,000 Individuals, 1981–2008,” Social Science Research 62 (2017): 1–23; and Krzysztof Zagorski, Jonathan Kelley, and Mariah D. R. Evans, “Economic Development and Happiness: Evidence from 32 Nations,” Polish Sociological Review 169 (2010): 3–19.

20. Alberto Alesina, Rafael Di Tella, and Robert MacCulloch, “Inequality and Happiness: Are Europeans and Americans Different?,” Journal of Public Economics 88, no. 9–10 (2004): 2009–42.

21. Finis Welch, “In Defense of Inequality,” American Economic Review 89, no. 2 (1999): 2.

22. Vadim Kufenko and Vincent Geloso, “Who Are the Champions? Inequality, Economic Freedom and the Olympics,” Journal of Institutional Economics 17, no. 3 (2021): 411–27; Christian Bjørnskov, Axel Dreher, Justina A.V. Fischer, Jan Schnellenbach, and Kai Gehring, “Inequality and Happiness: When Perceived Social Mobility and Economic Reality Do Not Match,” Journal of Economic Behavior & Organization 91 (2013): 75–92; Christian Bjørnskov, “Growth, Inequality, and Economic Freedom: Evidence from the US States,” Contemporary Economic Policy 35, no. 3 (2017): 518–31; Daniel L. Bennett and Boris Nikolaev, “Economic Freedom & Happiness Inequality: Friends or Foes?,” Contemporary Economic Policy 35, no. 2 (2017): 373–91; and Vincent Geloso and James Dean, “Economic Freedom Improves Income Mobility: Evidence from Canadian Provinces,” Journal of Institutional Economics 1, no. 20 (2021): 1982–2018.

23. Robert C. Allen, “Absolute Poverty: When Necessity Displaces Desire,” American Economic Review 107, no. 12 (2017): 3690–721.

24. Merriam‐​Webster, s.v. “psychic income,” accessed April 11, 2023.

25. Alberto Alesina, Rafael Di Tella, and Robert MacCulloch, “Inequality and Happiness: Are Europeans and Americans Different?,” Journal of Public Economics 88, no. 9–10 (2004): 2009–2042; Betsey Stevenson and Justin Wolfers, “Happiness Inequality in the United States,” The Journal of Legal Studies 37, no. S2 (2008): S33–S79; Andrew E. Clark, Sarah Flèche, and Claudia Senik, “The Great Happiness Moderation: Well‐​Being Inequality during Episodes of Income Growth,” Happiness and Economic Growth: Lessons from Developing Countries (2014): 32–139; and Andrew E. Clark, Sarah Flèche, and Claudia Senik, “Economic Growth Evens Out Happiness: Evidence from Six Surveys,” Review of Income and Wealth 62, no. 3 (2016): 405–19.

26. “Human Development Index (HDI),” United Nations Development Programme Human Development Reports, accessed April 11, 2023.

27. Some series had to be spliced together. Contact the authors for the data supplementary files for a case‐​by‐​case documentation of our choices.

28. Some databases report countries differently. For example, some countries are reported in some databases as they are today even when they were formerly part of a larger polity (e.g., countries in the former Yugoslavia); others report only the larger polity until it split. To ensure consistency, when polities split or disappeared, we manually adjusted the values. This is most evident with the case of the USSR. Many of the satellites of the USSR reported no values in 1990 because they were part of the USSR unit in the data. As such, when the USSR dissolved, new polities had their own observations to report. Thus, as long as they were part of the USSR, we assigned these countries the USSR value. For example, take the food supply estimates for Kazakhstan and Belarus. Both countries are assigned the USSR values in 1990 and 1991 and their own values once they became separate entities.

29. “Life Expectancy at Birth, Total (years),” World Bank; “Mortality Rate, Infant (per 1,000 live births),” World Bank; “Food Supply (kcal per capita per day), ( –2013)” and “Food Supply (Kcal per capita per day), (2010– ),” Food and Agriculture Organization of the United Nations; “Death Rate from Air Pollution,” Our World in Data; Robert J. Barro and Jong‐​Wha Lee, “Barro‐​Lee Educational Attainment Dataset,” Barro‐​Lee website, last updated September 2021; Jutta Bolt and Jan Luiten van Sanden, “Maddison Style Estimates of the Evolution of the World Economy. A New 2020 Update,” Maddison Project Database, Version 2020, last modified May 22, 2022; note that the eighth component, “political freedom: democracy versus autocracy over time, scale 0 to 40,” is rescaled from the Polity5 Database, Center for Systemic Peace.

30. Infant mortality is inversely related to human progress—lower levels are better. This means that we had to transform the infant mortality rate into an infant survival rate.

31. Leandro Prados de la Escosura, Human Development and the Path to Freedom (Cambridge, UK: Cambridge University Press, 2022), p. 14.

32. Roderick Floud, Robert William Fogel, Bernard Harris, and Sok Chul Hong, The Changing Body: Health, Nutrition, and Human Development in the Western World since 1700 (Cambridge, UK: Cambridge University Press, 2011), p. 43.

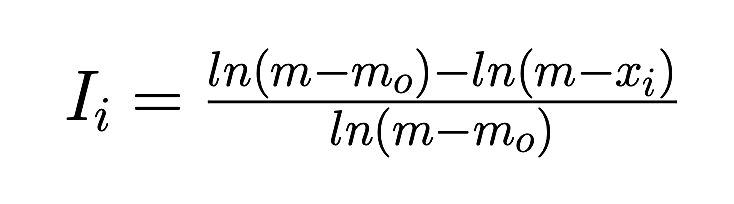
33. We rescaled by adding 10 (which eliminates negative values) and scaling by 2 to avoid counting countries at 9 on the Polity5 as equally democratic as countries with a value of 10. By virtue of the properties of natural logs, countries with 10 cannot be computed (as it gives zero for the log, which cannot be defined). As such, countries with a 10 were given 1 on the index.

34. MLD is also referred to as generalized entropy of degree zero. See Frank Alan Cowell, “Generalized Entropy and the Measurement of Distributional Change,” European Economic Review 13, no. 1 (1980): 147–59. Note: Both measures were computed using the Stata package ineqdec0. See Stephen P. Jenkins, “INEQDEC0: Stata Module to Calculate Inequality Indices with Decomposition by Subgroup,” Boston College Department of Economics, 1999.

35. See Frank Alan Cowell and Emmanuel Flachaire, “Inequality Measures and the Median: Why Inequality Increased More Than We Thought,” Seventh Meeting of the Society for the Study of Economic Inequality (ECINEQ), New York City, 2017.

36. “Data Downloads,” Human Development Reports, United Nations Development Programme.

37. Vincent Geloso, “Statogenic Climate Change? Julian Simon and Institutions,” Review of Austrian Economics 35 (2022): 1–16; Pierre Desrochers, Vincent Geloso, and Joanna Szurmak, “Care to Wager Again? An Appraisal of Paul Ehrlich’s Counterbet Offer to Julian Simon, Part 2: Critical Analysis,” Social Science Quarterly 102, no. 2 (2021): 808–29; and Leigh Raymond, “Economic Growth as Environmental Policy? Reconsidering the Environmental Kuznets Curve,” Journal of Public Policy 24, no. 3 (2004): 327–48.

38. “Child Mortality Rate, 2019,” Our World in Data, accessed April 11, 2023.

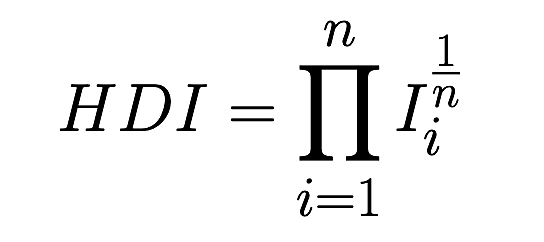
39. A mathematical example is useful here. Imagine a country with initial values of 0.4 on three different I that improves to 0.6 in only one of them. The equation would say that the HDI is 0.4579 after the improvement of 0.2 in that single indicator. However, if the improvement is split equally across all components (0.2/3), the resulting HDI is 0.4667.

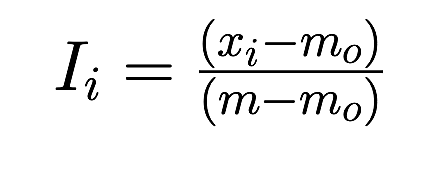
40. It should be noted that variables that improve as their values fall require an additional transformation. For example, if the mortality rate is expressed per 1,000 persons, we transform it by subtracting the rate per 1,000 from 1,000. This essentially becomes a survival rate, which is easier to interpret in the logic of the HDI and HPI.

41. Nanak Kakwani, “Performance in Living Standards: An International Comparison,” Journal of Development Economics 41, no. 2 (1993): 307–36.