Over the last half century, states have steadily moved toward lower and flatter income taxes. Thirty states have cut their top tax rates, and the number of states with flat income taxes has tripled from 5 to 15. New statistical evidence presented in this brief suggests that they made the right choice.
Using data from states between 1980 and 2025, this brief finds that adopting a flat income tax is associated with roughly 1 percentage point faster growth in per capita income and state GDP four years after the reform, or almost $4,000 more income per resident. A separate event study of Colorado, the first state to replace a graduated income tax with a flat tax, shows per capita income similarly grew by thousands of dollars relative to comparable states in the years after the reform.
In November 2026, Colorado voters will decide whether to maintain their 4.4 percent flat tax or replace it with a six-bracket system, topping out at 8.4 percent for income over $1 million.1 The empirical flat-tax advantage suggests that by reversing Colorado’s 1987 reform, Amendment 87 would undermine the state’s strong economic track record.
The evidence also carries a broader lesson. Flat taxes have become mainstream state tax policy and are associated with faster growth, higher incomes, easier tax compliance, better fiscal outcomes, and a political structure that makes future tax increases more difficult.
Because individual income taxes are among the most economically destructive ways to raise revenue, the success of flat taxes has implications for federal tax reform and for the remaining graduated-income-tax states. Experience shows that flat taxes are popular, achievable, and good for growth. State and federal policymakers should take note.
How Do States Raise Revenue?
On average, state and local governments raise the largest share of their revenue from property taxes, followed by sales, individual income, and corporate taxes. The tax mix varies widely. New Hampshire raises more than half of its revenue from property taxes, while Oregon relies heavily on individual and corporate income taxes. States also use a variety of miscellaneous taxes to raise significant revenue. In Alaska and North Dakota, the single largest share of state and local tax revenue comes from nonstandard taxes, which include severance taxes on oil and natural resource extraction. Delaware raises significant revenue from corporate franchise and entity fees, which are paid by millions of out-of-state business entities registered there. Table 1 shows sources of state and local revenues.
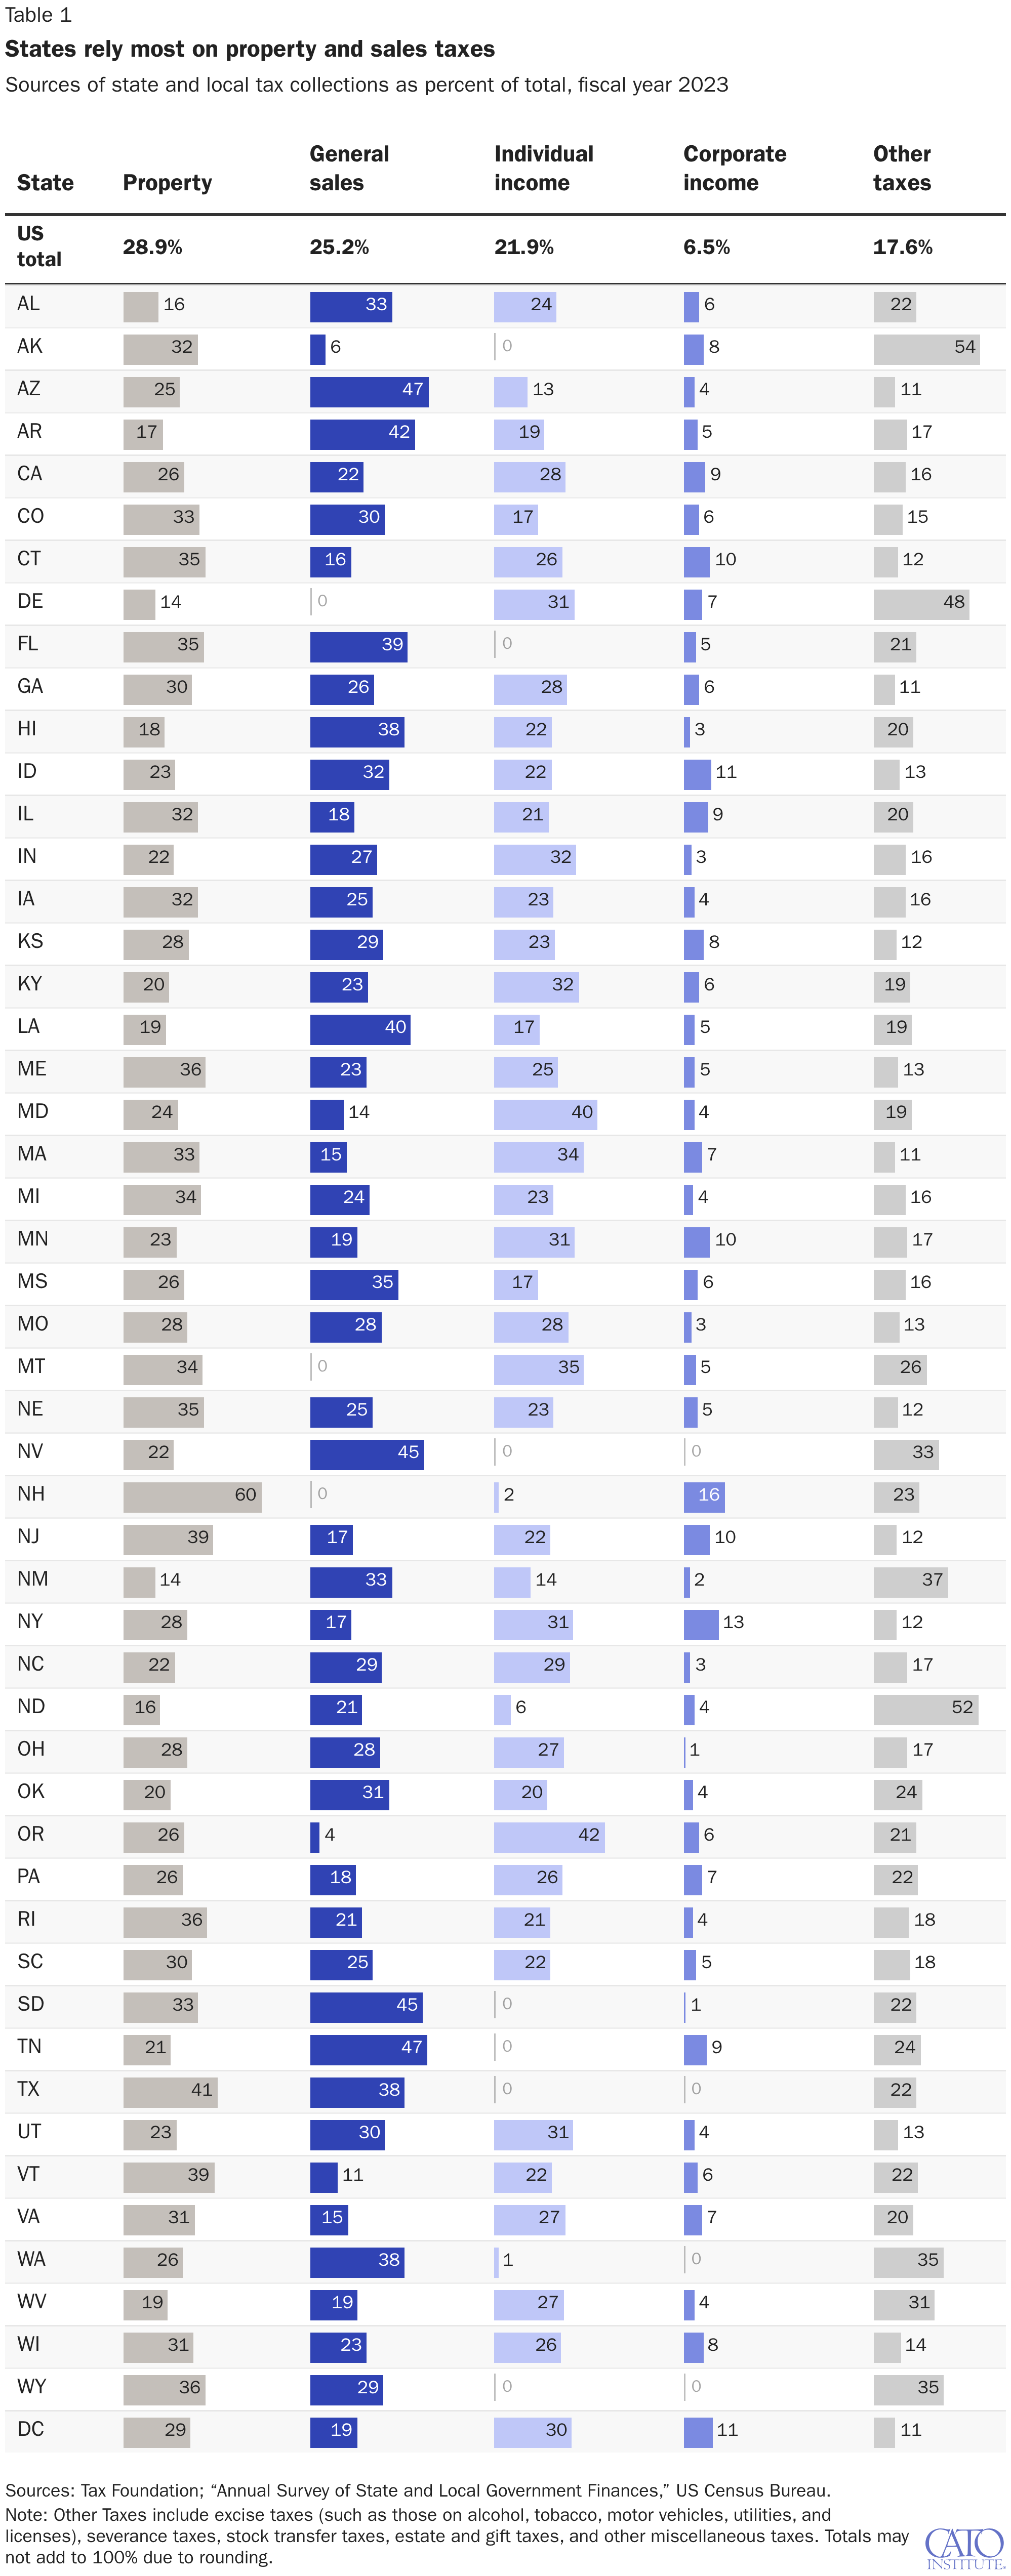
In the aggregate, the relative shares of state revenue collection mirror the standard ranking of taxes by economic damage; states generally collect the largest share of revenue from the most efficient taxes. Two Organisation for Economic Co-operation and Development (OECD) studies rank revenue sources by their drag on long-run growth. Corporate income taxes do the most harm, followed by personal income taxes. Consumption and property taxes are the most efficient ways to raise revenue, and the largest sources of state and local revenues.2 The ranking is a to-do list for policymakers. States should prioritize eliminating corporate income taxes first: 6 have no corporate income tax, and 13 have rates below 5 percent.3 The personal income tax should be next on the list of major taxes to cut or eliminate.
States Cut and Flatten Income Taxes
States have often led on reforming and testing new tax systems in the United States. Wisconsin adopted the country’s first state income tax in 1911, with two rates of 1 percent and 6 percent, and that was before the Sixteenth Amendment to the US Constitution legalized the federal income tax in 1913.4 Massachusetts adopted the first flat tax in 1916. By 1977, 40 states had income taxes. Only five of those had flat taxes: Illinois, Indiana, Massachusetts, Michigan, and Pennsylvania.
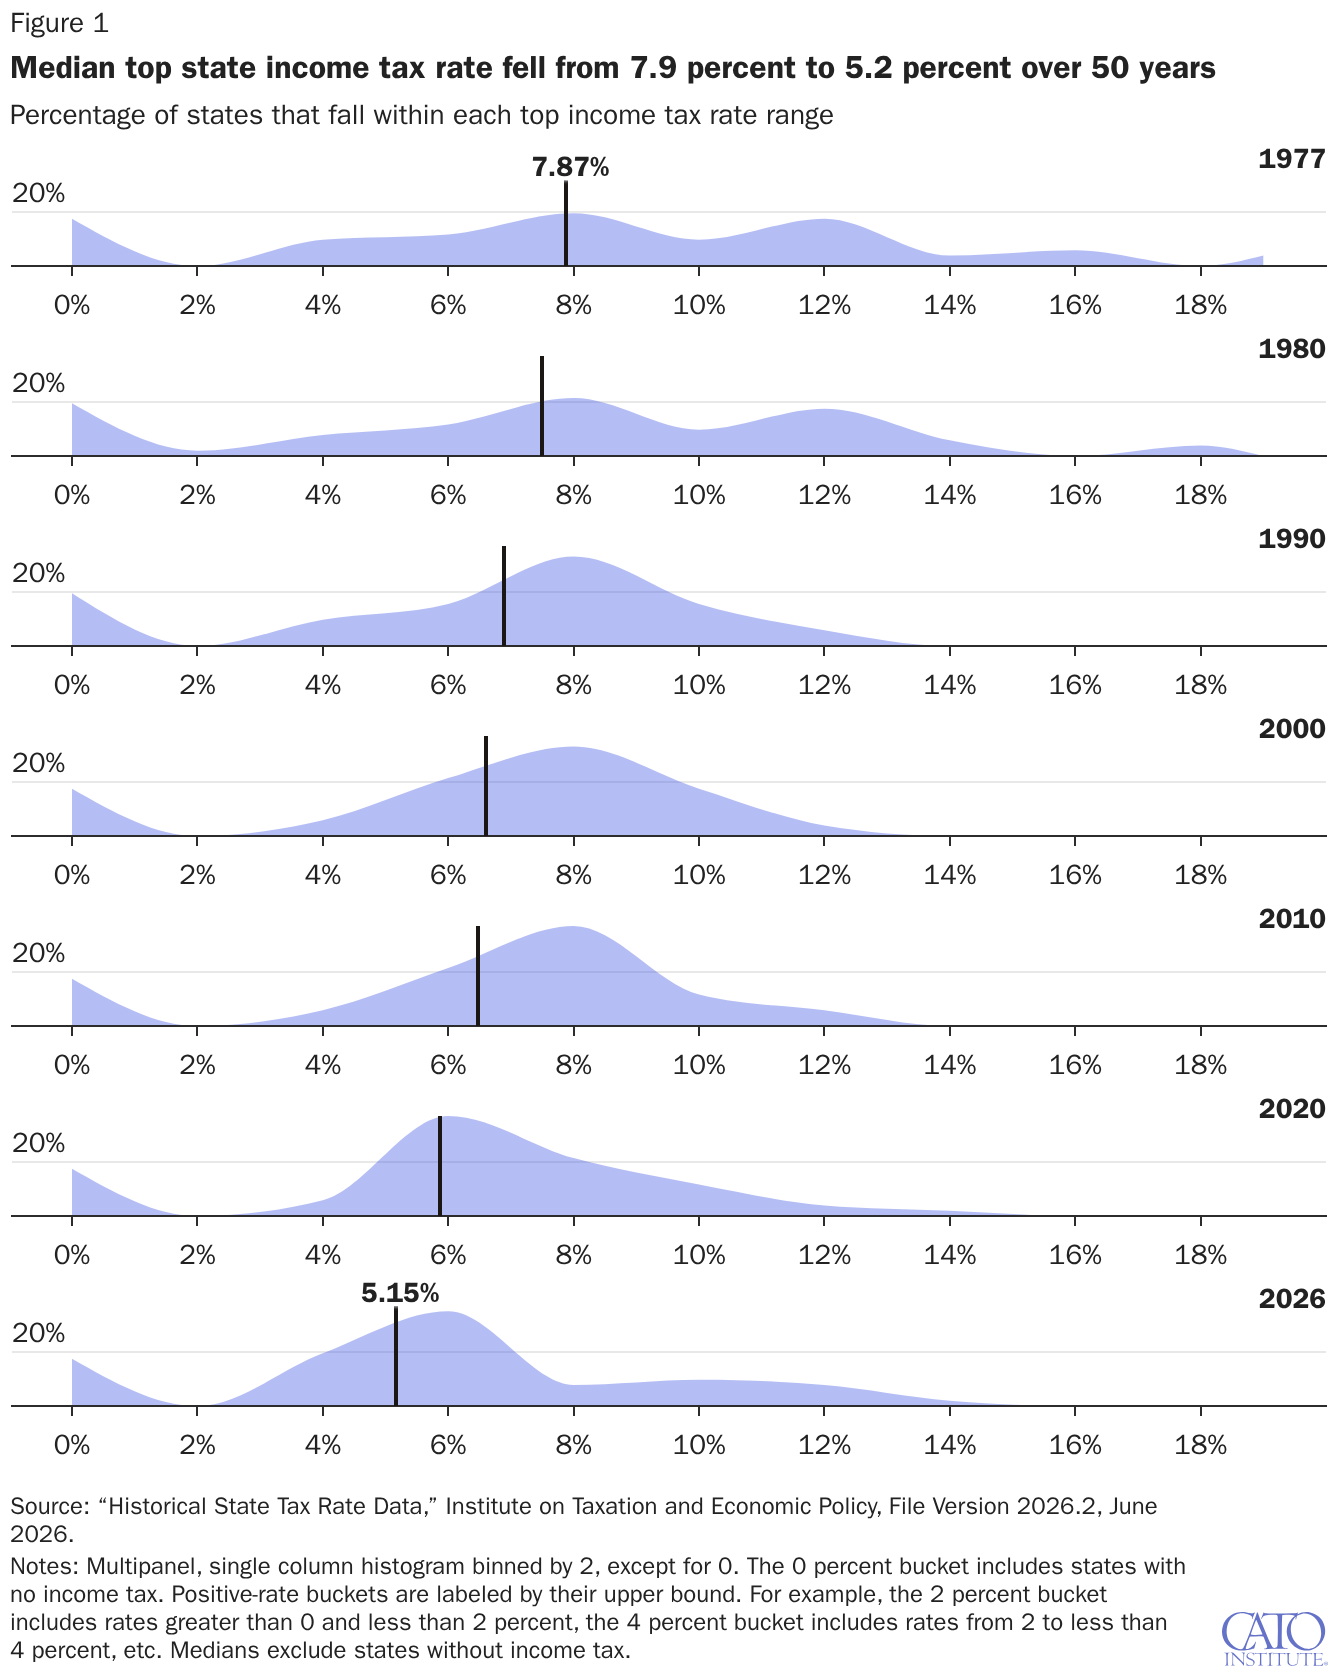
For decades, states have been lowering tax rates and converting multibracket systems into single-rate, flat taxes. Figure 1 shows the distribution of top marginal state income tax rates in 1977 (50 years ago) and at the beginning of each decade, with the median shifting from 7.9 percent in 1977 to 5.2 percent in 2026. In the last decade, a handful of states have moved in the other direction, with Hawaii, Maine, Massachusetts, and New York raising their rates by 2 percentage points or more. Today, top rates range from 2.5 percent in Arizona and North Dakota to 13.3 percent in California.5
Colorado was the first state to convert its progressive rate income tax system to a flat 5 percent rate in 1987.6 This flat-rate requirement was later written into the state constitution in 1992 as part of the Taxpayer’s Bill of Rights (TABOR).7 Twenty years after that, Utah followed suit in 2007, implementing its own 5 percent flat income tax.8 North Carolina and Kentucky followed with flat taxes in 2014 and 2018, respectively.
Since 2021, seven more states have moved to a single-rate income tax system. Figure 2 shows how state flat taxes have evolved over time, and Figure 3 shows the 2026 map. Twenty-six states and the District of Columbia have graduated tax structures, and 15 states have flat income tax systems. The Montana legislature will reportedly consider becoming the 16th state with a flat tax in the 2027 session.9 Nine states have no broad-based individual income tax.10
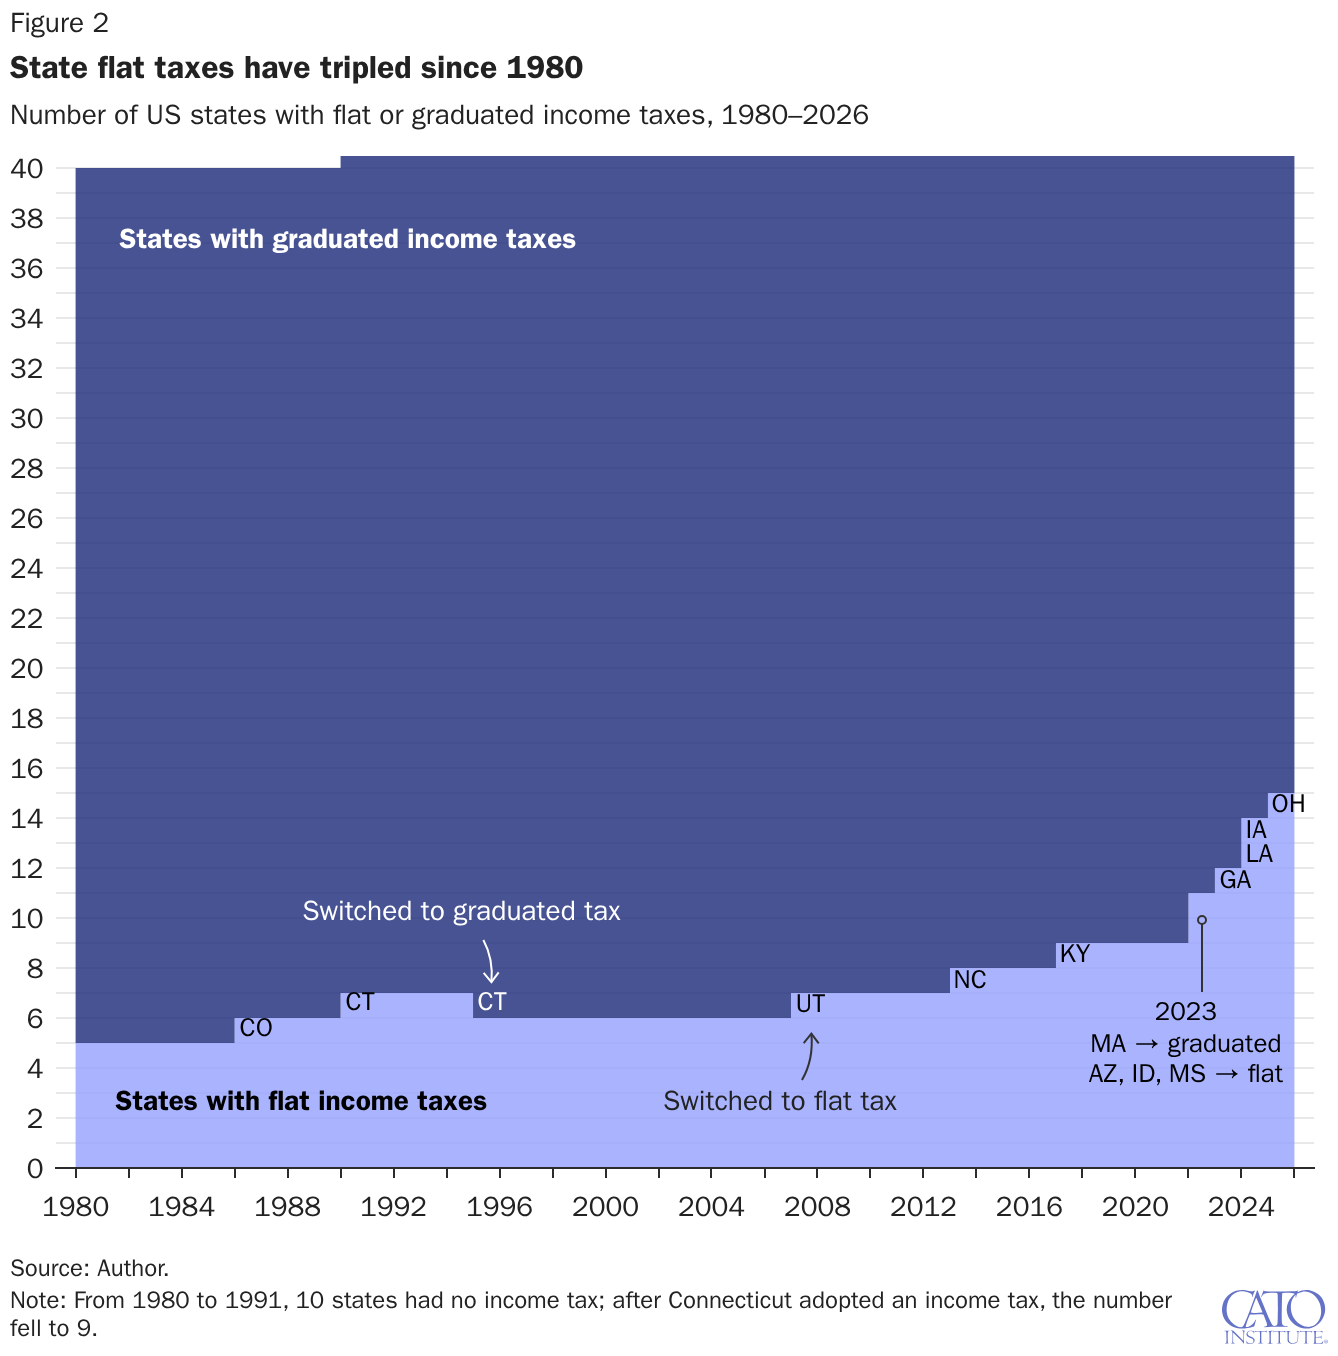
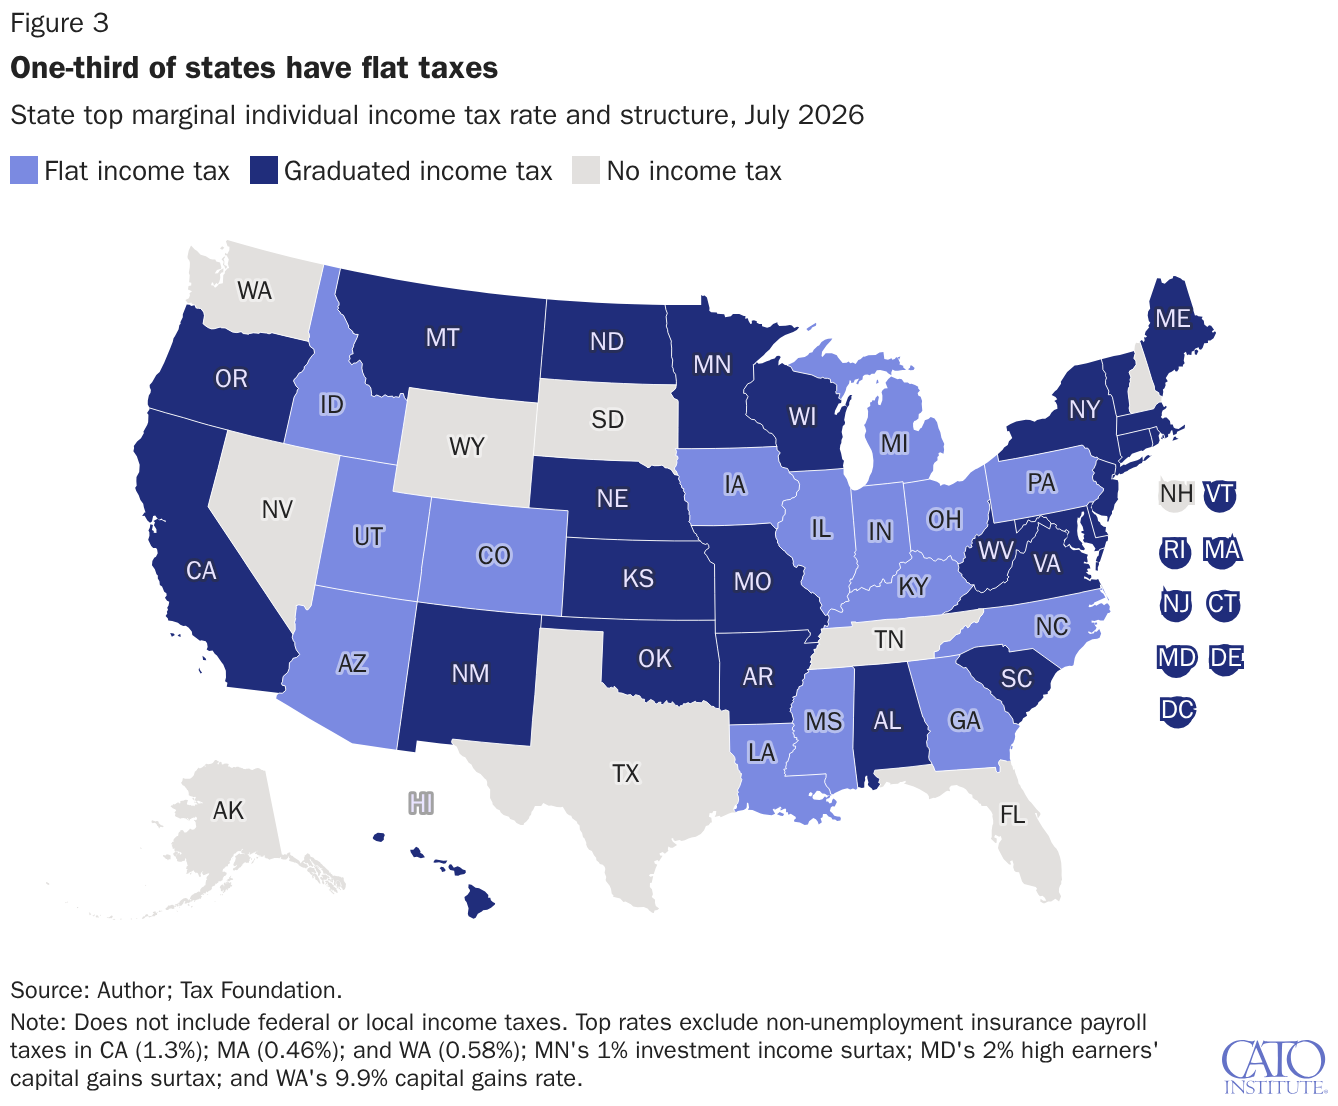
In 2025, the Kansas legislature adopted a law to transition from the current two-rate system to a flat 4 percent rate, contingent on future revenue.11 This trigger-based reform is distinct from the state’s 2012 tax cut in which Kansas kept its graduated brackets, cut the top rate, and exempted all pass-through business income. The pass-through exemption allowed higher-income residents to recharacterize wages as business profit to avoid tax. Revenues fell short of projections, and the legislature reversed the cuts in 2017.12
In 2023, Massachusetts abandoned its century-old flat income tax by adding a new 4 percent high-income surtax, raising the top marginal rate to 9 percent. Hawaii and Rhode Island are scheduled to raise top rates in 2027, and Washington state will implement a new 9.9 percent flat income tax with a $1 million standard deduction per household beginning in 2028, pending a November ballot initiative to overturn it.13 Other states, including Kentucky, Mississippi, Oklahoma, South Carolina, and West Virginia, have enacted revenue-based triggers to eliminate their individual income taxes over time.
The Case for Flat Taxes
In this brief I use the label “flat tax” in its narrowest sense, a one-rate tax on incomes above an exemption.14 Because of the exemption, average tax rates still rise with income, resulting in a progressive tax burden.
Optimal-tax theory does not give a definitive answer on the optimal tax structure or degree of progressivity. The optimal tax depends on the weight placed on redistribution, the distribution of earning ability, and how much people respond to taxes, among other things. Some of these are empirical questions, but others are normative. Peter Diamond and Emmanuel Saez’s widely cited work shows optimal top marginal rates exceeding 70 percent, but only by assuming almost no social value to the marginal consumption of top earners and minimal responses to high tax rates.15 Different assumptions return very different results.16
Economic theory does establish that the deadweight loss of a tax (the value of economic surplus that is lost because a tax prevents economically beneficial exchanges from occurring) rises with the square of the rate. This means that doubling a rate roughly quadruples the economic cost of the tax.17 High marginal rates are therefore disproportionately costly, and a low flat rate minimizes the economic damage for a given amount of revenue. An International Monetary Fund review states that flat taxes can maximize revenue “without inducing either tax evasion or the payment of bribes,” and standard public finance models, with the right assumptions, show that flat taxes can approximate optimal outcomes, a case that is strengthened by their simplicity and ease of enforcement.18
Four related bodies of evidence show why flat taxes are superior to their graduated counterparts. First, tax rates affect economic growth and incomes. Second, mobile high earners respond strongly to rate differences. Third, flatness itself is associated with positive economic outcomes and better compliance. Finally, the case for flat taxes is strengthened by the political economy of a single rate that cannot be raised on a narrow minority.
Income Tax Rate Cuts Raise Output and Incomes
The empirical literature finds that income tax cuts boost economic output, raise incomes, and increase investment.
Cutting marginal tax rates raises the after-tax reward for the next dollar earned, thus encouraging people to work more. This is called the substitution effect. The same logic applies to the next dollar saved or invested, whereby a lower marginal rate on the return to capital raises the payoff to saving and investing. This is relevant because most state income taxes apply to passthrough business income (which accounts for about half of all business income), capital gains, and dividends.19 The average tax rate measures how much income taxpayers keep overall, and it drives an opposing income effect. A tax cut that lets people keep more of their income lets them meet their needs with less effort. Tax reforms almost always move both margins at once; cutting the top marginal tax rate also cuts average rates. In the real world, the substitution effect dominates.20
Building on the seminal work of Christina and David Romer, economists Karel Mertens and Morten Ravn use tax changes unrelated to economic conditions to measure the effects of federal income taxes. They find that tax cuts raise employment, the number of hours worked, consumption, and investment. A 1 percentage-point cut in the average personal income tax rate raises real GDP by as much as 1.8 percent within nine months.21 Using a similar method, Mertens and José Luis Montiel Olea measure the effects of marginal tax rates by income group and find that rate cuts raise reported real incomes, real GDP, and employment. Top earners respond the most, and tax cuts for the top 1 percent also raised incomes for lower-income taxpayers.22
The evidence from US states tells a similar story. Using five-year state panel data, W. Robert Reed finds that higher state and local tax burdens used to finance general government expenditures are associated with slower personal income growth.23 Randall Holcombe and Donald Lacombe compare counties on opposite sides of state borders and find that states that raised their income taxes “had slower income growth and, on average, a 3.4% reduction in per capita income.”24 Even research that finds less robust links between state tax policy and aggregate growth reports that higher top tax rates are associated with statistically significant reductions in firm formation and time-period-dependent effects on income growth.25
International evidence comes to the same conclusions. In the United Kingdom, plausibly exogenous income tax cuts produce large and persistent positive effects on output, consumption, and investment.26 Cross-country studies using OECD data find that higher top marginal income tax rates are associated with lower long-run GDP growth, and two additional OECD studies show higher top marginal personal rates linked to slower productivity growth.27
Mobile Taxpayers Respond to Rates
Taxing income also induces the most mobile taxpayers to leave, especially where exit is easiest. In a recent study of interstate migration, economist Jack Salmon shows that the strongest and most consistent explanation is lower taxes and greater housing supply.28 The 2017 cap on the federal state and local tax (SALT) deduction, which was expanded in 2025, amplified the tax incentive to move. Limiting the federal SALT deduction increased the effective marginal cost of state income taxes for high earners.
Few workers are more mobile than star scientists, professional athletes, and superstar inventors. Three academic studies examining how they respond to taxes reach the same conclusion: each high-earner group tends to relocate to lower-tax jurisdictions.29 Similarly, Denmark’s special low rate for high-earning foreigners doubled the number of targeted workers in the country.30 Variation in local Spanish and Swiss top rates also shows high-income taxpayers shifted toward the low-rate jurisdictions.31 Not everyone packs up and leaves, but people with the fewest local ties and the most to gain move more readily.32
Moving is not the only way top earners respond to higher taxes. When California raised its top rate in 2012, some high earners left, but the larger response was less reported taxable income by those who stayed. Departures and reduced reporting eliminated roughly 45 percent of the projected first-year revenue and 61 percent within two years.33 Evidence from the 2013 federal tax increase similarly shows large short-run income shifting among top earners and modest medium-run effects that, combined, reduced projected revenue by 20 percent.34 For states, where mobility is a bigger constraint, economists Martin Feldstein and Marian Vaillant Wrobel show that migration, income shifting, and cross-border adjustments in wages and employment limit states’ ability to redistribute income even over relatively short periods.35
Flatness Predicts Faster Growth
Isolating the effect of flat taxes themselves is harder. Flat tax reforms typically combine lower rates with broader tax bases, simpler tax codes, and other market-oriented reforms, making isolating the independent effect of a flat rate difficult, if not impossible.36 However, new suggestive empirical evidence and existing research indicate that flat taxes themselves are also associated with positive outcomes.
During its period of liberalization, Russia implemented the first flat-rate personal income tax in a large economy in 2001, which researchers described as “quite revolutionary.”37 The reform converted its three rates (12, 20, 30) to a single 13 percent rate for everyone. In the year of the reform, real tax revenue from the personal income tax grew by 26 percent and continued to grow by 21 percent in 2002 and by 12 percent in 2003. About two-thirds of the higher taxable income reflected reduced evasion (the reform also included additional enforcement), while about one-third reflected higher real earned income.38
Broader evidence from Eastern and Central Europe also points in the same direction. Comparing eight countries that adopted flat taxes with similar countries that did not, Bibek Adhikari and James Alm find that every flat-tax country experienced higher GDP per capita after reform, with statistically significant gains in seven of the eight cases. The authors conclude that “results indicate that flat tax reform generally had significant, positive, and meaningful impacts on income.”39 Using US state variation, Tae-hwan Rhee measures how income tax progressivity affects state economic growth from 1979 to 2004. He finds that moving to a flatter income tax is associated with higher annual state GDP growth three years later.40
This brief extends Rhee’s approach to a simpler question: Does having a flat tax predict faster growth? Instead of a continuous progressivity index, I use a binary indicator of a flat or graduated income tax from 1980 to 2025. The regression includes state and year fixed effects and controls for the average income tax rate.41 The average tax rate holds the observed income tax burden constant to better measure the structural effect of the transition to a single rate, not just the effects of the tax cut.
Table 2 reports the coefficients on the flat-tax indicator at each year after implementation, the standard error, p‑value, and 95 percent confidence intervals. The coefficient measures how many percentage points faster flat-tax states grow in the years after adoption, compared to graduated-tax states with similar average tax burdens. Flat-tax states also experience roughly 1 percentage point faster per capita income growth by the fourth year after adoption. Table 3 shows that an effect of similar magnitude appears for GDP growth, with wider confidence intervals reflecting greater year-to-year volatility. Flat-tax states experience roughly 1 percentage point faster state GDP growth by year four.
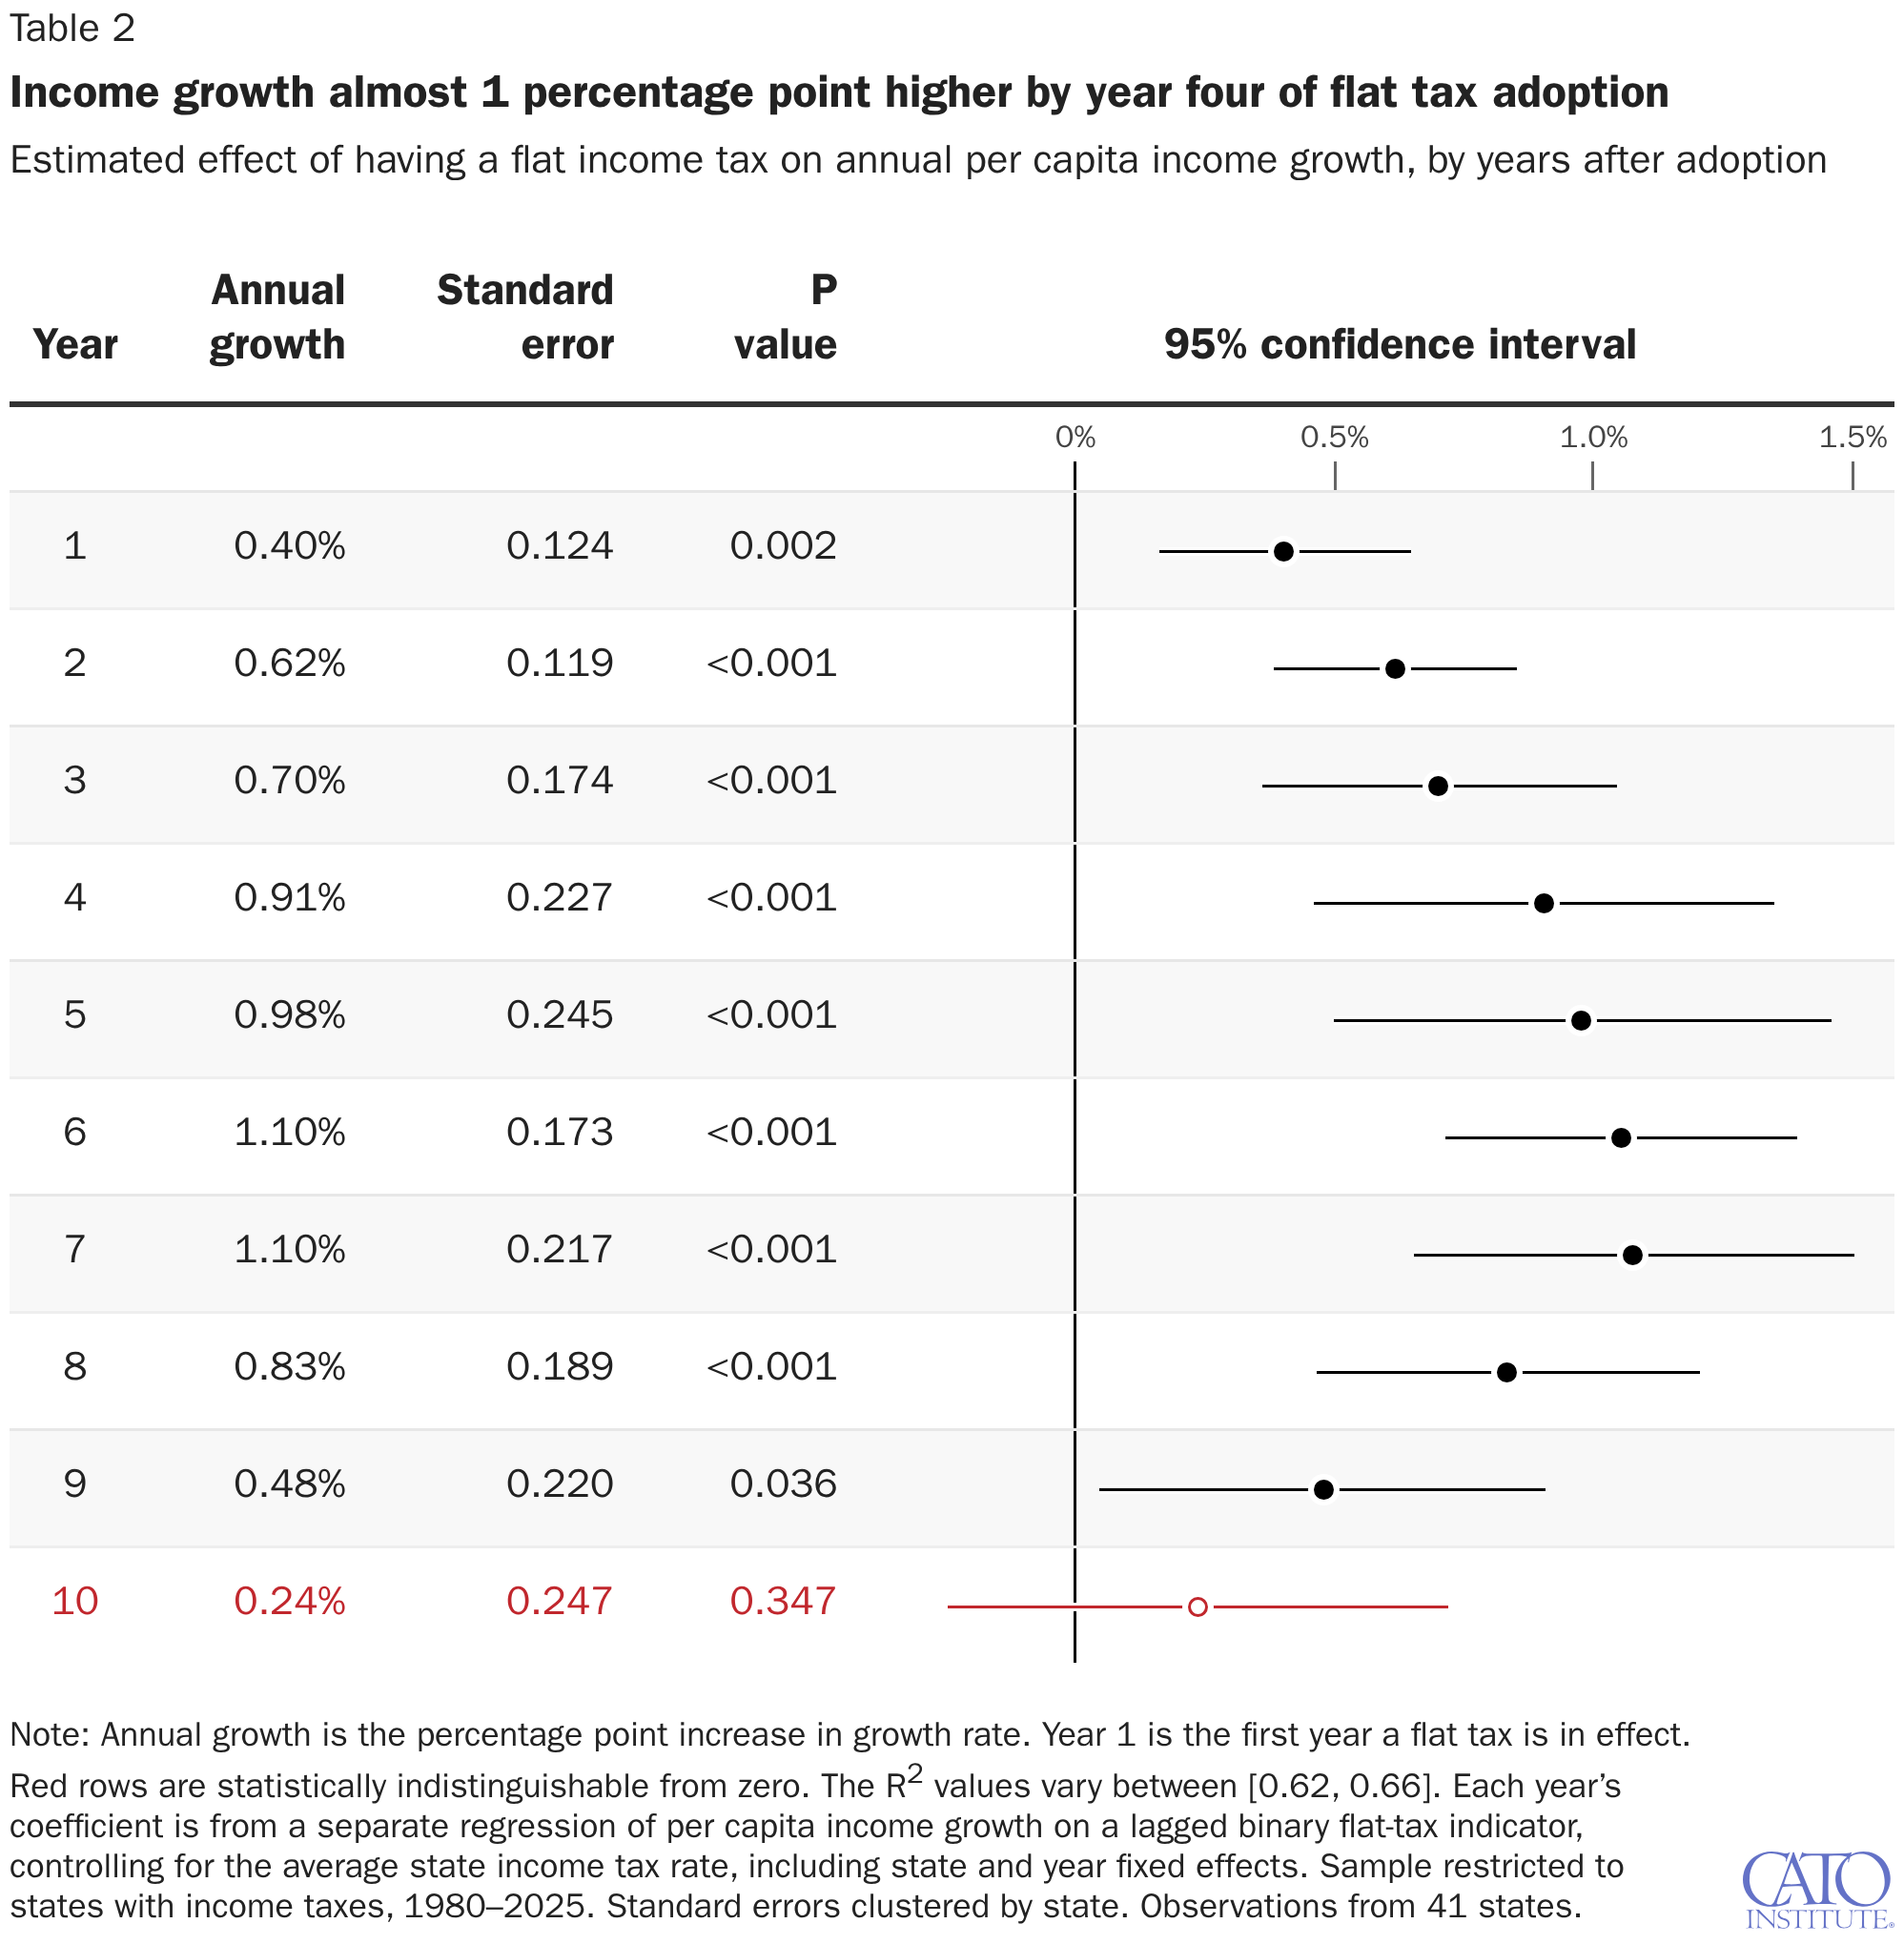
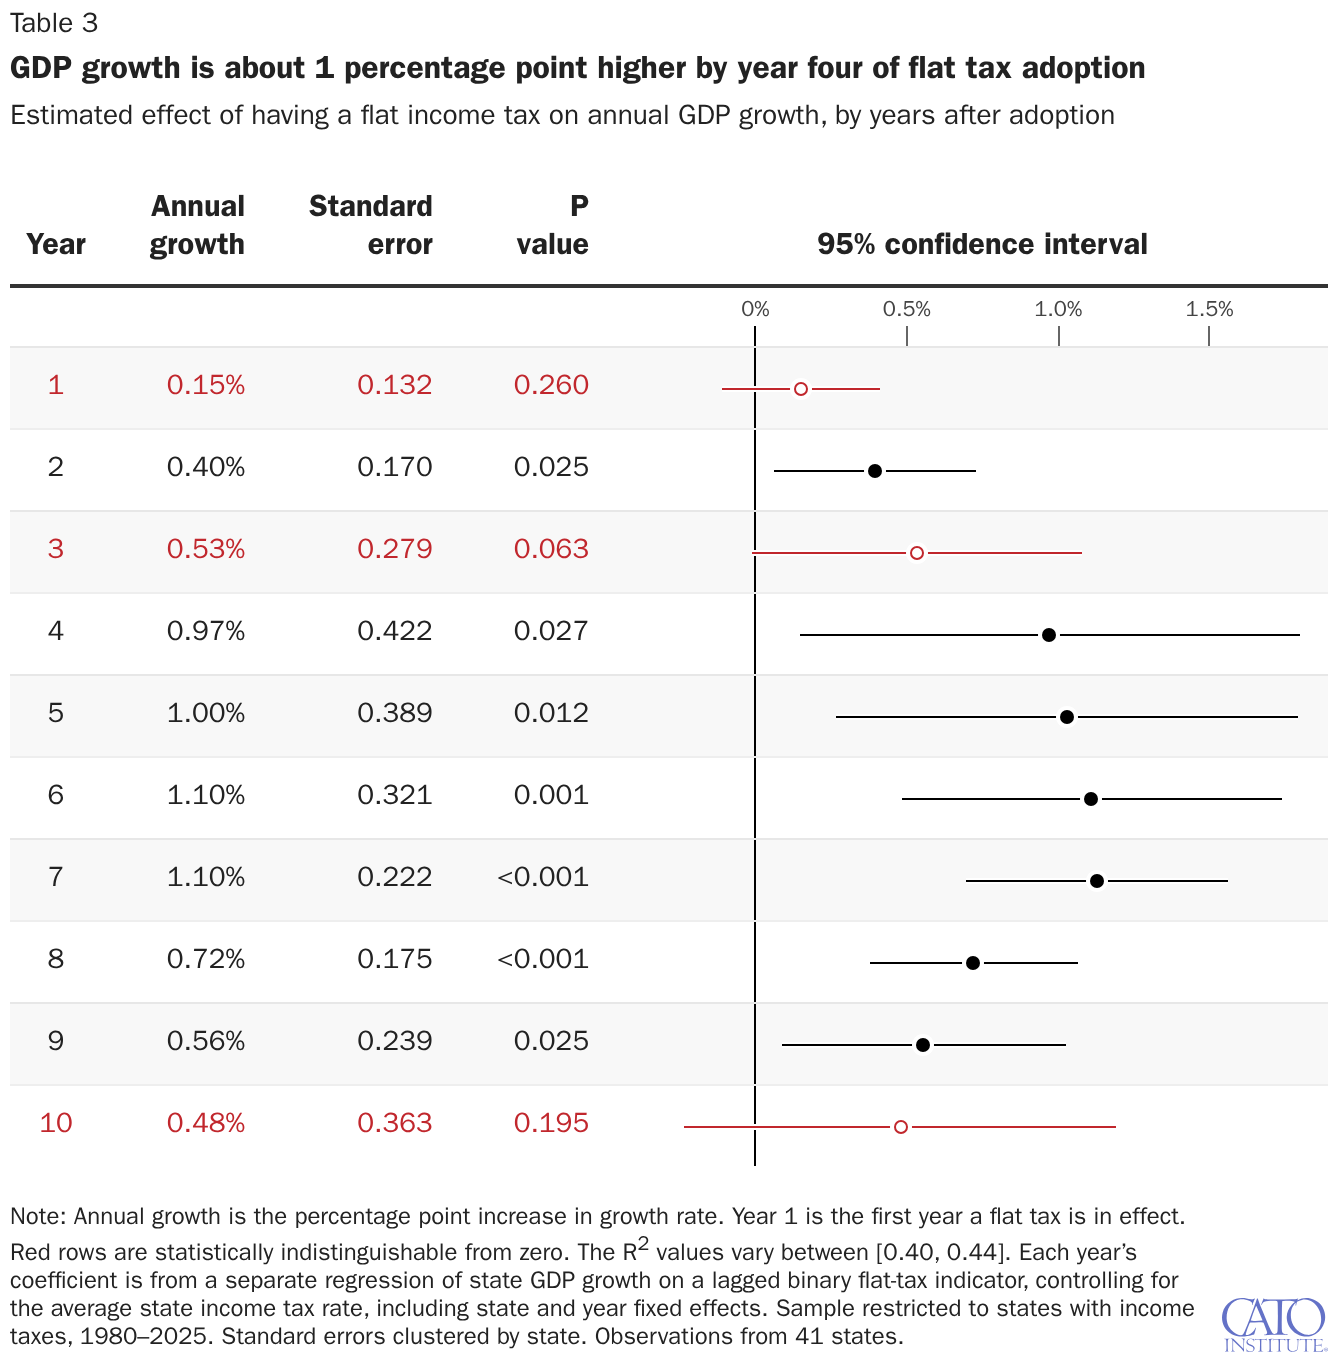
These magnitudes are consistent with Rhee’s estimates, and as he notes, the coefficients may partly reflect correlated policy choices. Also consistent with Rhee, the growth effect is temporary, it is largest around year seven and fades to insignificance by year 10. This is what standard growth models predict. Tax reform produces a permanent level effect on income and GDP, but not a permanent change in the growth rate. The growth rate rises temporarily as the economy transitions to the new path, then returns to its long-run trend. As an illustration of the magnitude, if the 1 percentage point higher growth associated with a flat tax were sustained for five years, current per capita income would end up about $3,900 higher than it would have been otherwise.42
Controlling for the income tax rate makes the coefficient slightly larger, consistent with the flat structure itself predicting faster growth independent of the tax level. A Granger-style reverse causality test (regressing future flat-tax status on current income and GDP growth) returns near-zero coefficients, indicating that states do not systematically adopt flat taxes after periods of unusually fast growth.
Colorado provides the cleanest single-state test. It adopted the first graduated-to-flat conversion in 1987, well before the recent wave of adoptions that coincide with recessions and the COVID-19 pandemic.43 Figure 4 shows a difference-in-differences event study comparing Colorado to 13 graduated-tax states that had statistically indistinguishable income trajectories in the seven years preceding the reform.44
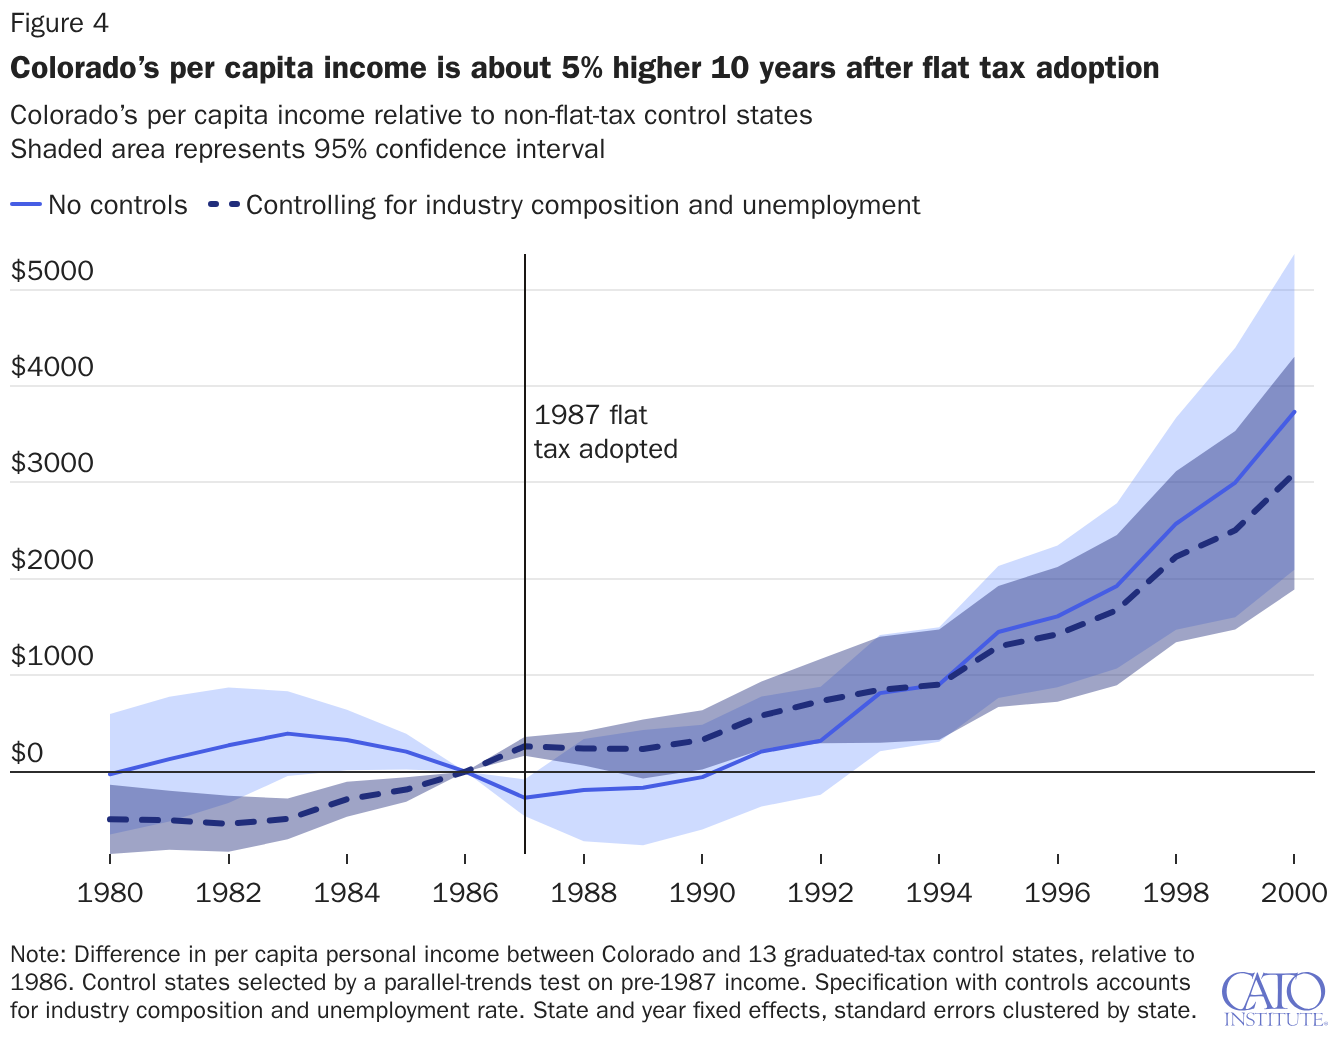
The solid lighter blue line shows the event study without additional controls.45 The pretreatment coefficients are near zero, confirming that the 13 selected control states tracked Colorado’s income growth before the reform.46 Post-1987, the effect is initially flat, then diverges from 1993 onward, reaching about $1,996 a decade after the reform and $3,731 above the control group average by 2000.
The darker blue dashed line adds controls for unemployment and industry composition directly to the regression. This specification tells a richer story. The slightly negative pre-1987 coefficients indicate that Colorado was underperforming in the early 1980s, converging toward zero by 1986. The effect of flat tax adoption then appears immediately in 1987, grows to $1,424 ten years later, and by 2000 reaches $3,096 above the control group average. Both specifications tell a similar story: Per capita income rose following the adoption of Colorado’s flat tax.
Expressing the nominal Colorado figures in today’s dollars results in comparable estimates to the panel regression results. The $1,400 was roughly 5.3 percent of Colorado’s 1996 per capita income, and that same percent of Colorado’s 2025 income is about $4,600.47
Flat Taxes Are Hard to Raise
The case for flat taxes is reinforced by the political economy of a single rate. Because an unconstrained government tends to grow beyond its efficient size, confining it to a single marginal rate improves its efficiency by limiting how much revenue it can extract.48 A graduated schedule lets policymakers raise revenue more easily, one bracket at a time. A single rate is harder to increase because any change falls on everyone.
The record bears this out. Once adopted, flat taxes tend to stick and are cut more often than raised. All four states that converted a graduated income tax to a single rate before 2023 (Colorado, Kentucky, North Carolina, and Utah) now tax at rates 0.6 to 1.55 percentage points below where they began.49 Movement the other way is rare. Out of every state that has had a flat tax, only Massachusetts and Connecticut have abandoned it for a multirate system.
The international pattern is similar. Among 54 OECD and former Soviet Bloc countries, fewer than 30 percent of those that adopted a flat tax have since reversed it and graduated-rate countries have been nearly four times as likely as flat-tax countries to raise their rates.50 Some of this is endogenous; jurisdictions that adopt flat taxes are those with electorates that prefer limits on government. But the single rate can still constrain changing political preferences. In Illinois, 53 percent of voters rejected a 2020 constitutional amendment to replace the state’s flat tax with graduated rates, even though 58 percent of the state voted for President Joe Biden that year, who campaigned for more progressive income taxes.51
Income Taxes Do Not Improve Fiscal Health
The case for graduated income taxes is also often made on budgetary grounds, that a graduated system gives states more resources to fix fiscal imbalances.52 The data tell a different story. If anything, states with flat or no income taxes have more sustainable finances.
Figure 5 ranks each state’s per taxpayer surplus or liability, sorted by income tax structure in the same year.53 If tax structure drove fiscal health, the chart should show that graduated income tax states have the healthiest fiscal conditions. It shows the opposite. No-income-tax states had a median surplus of about $2,900 per taxpayer in 2023. Flat-tax states had a median surplus of $1,500. Graduated income tax states had a median liability of −$1,400. The additional revenue that graduated income tax systems can collect does not appear to fix fiscal imbalances; if anything, it makes the problem worse.
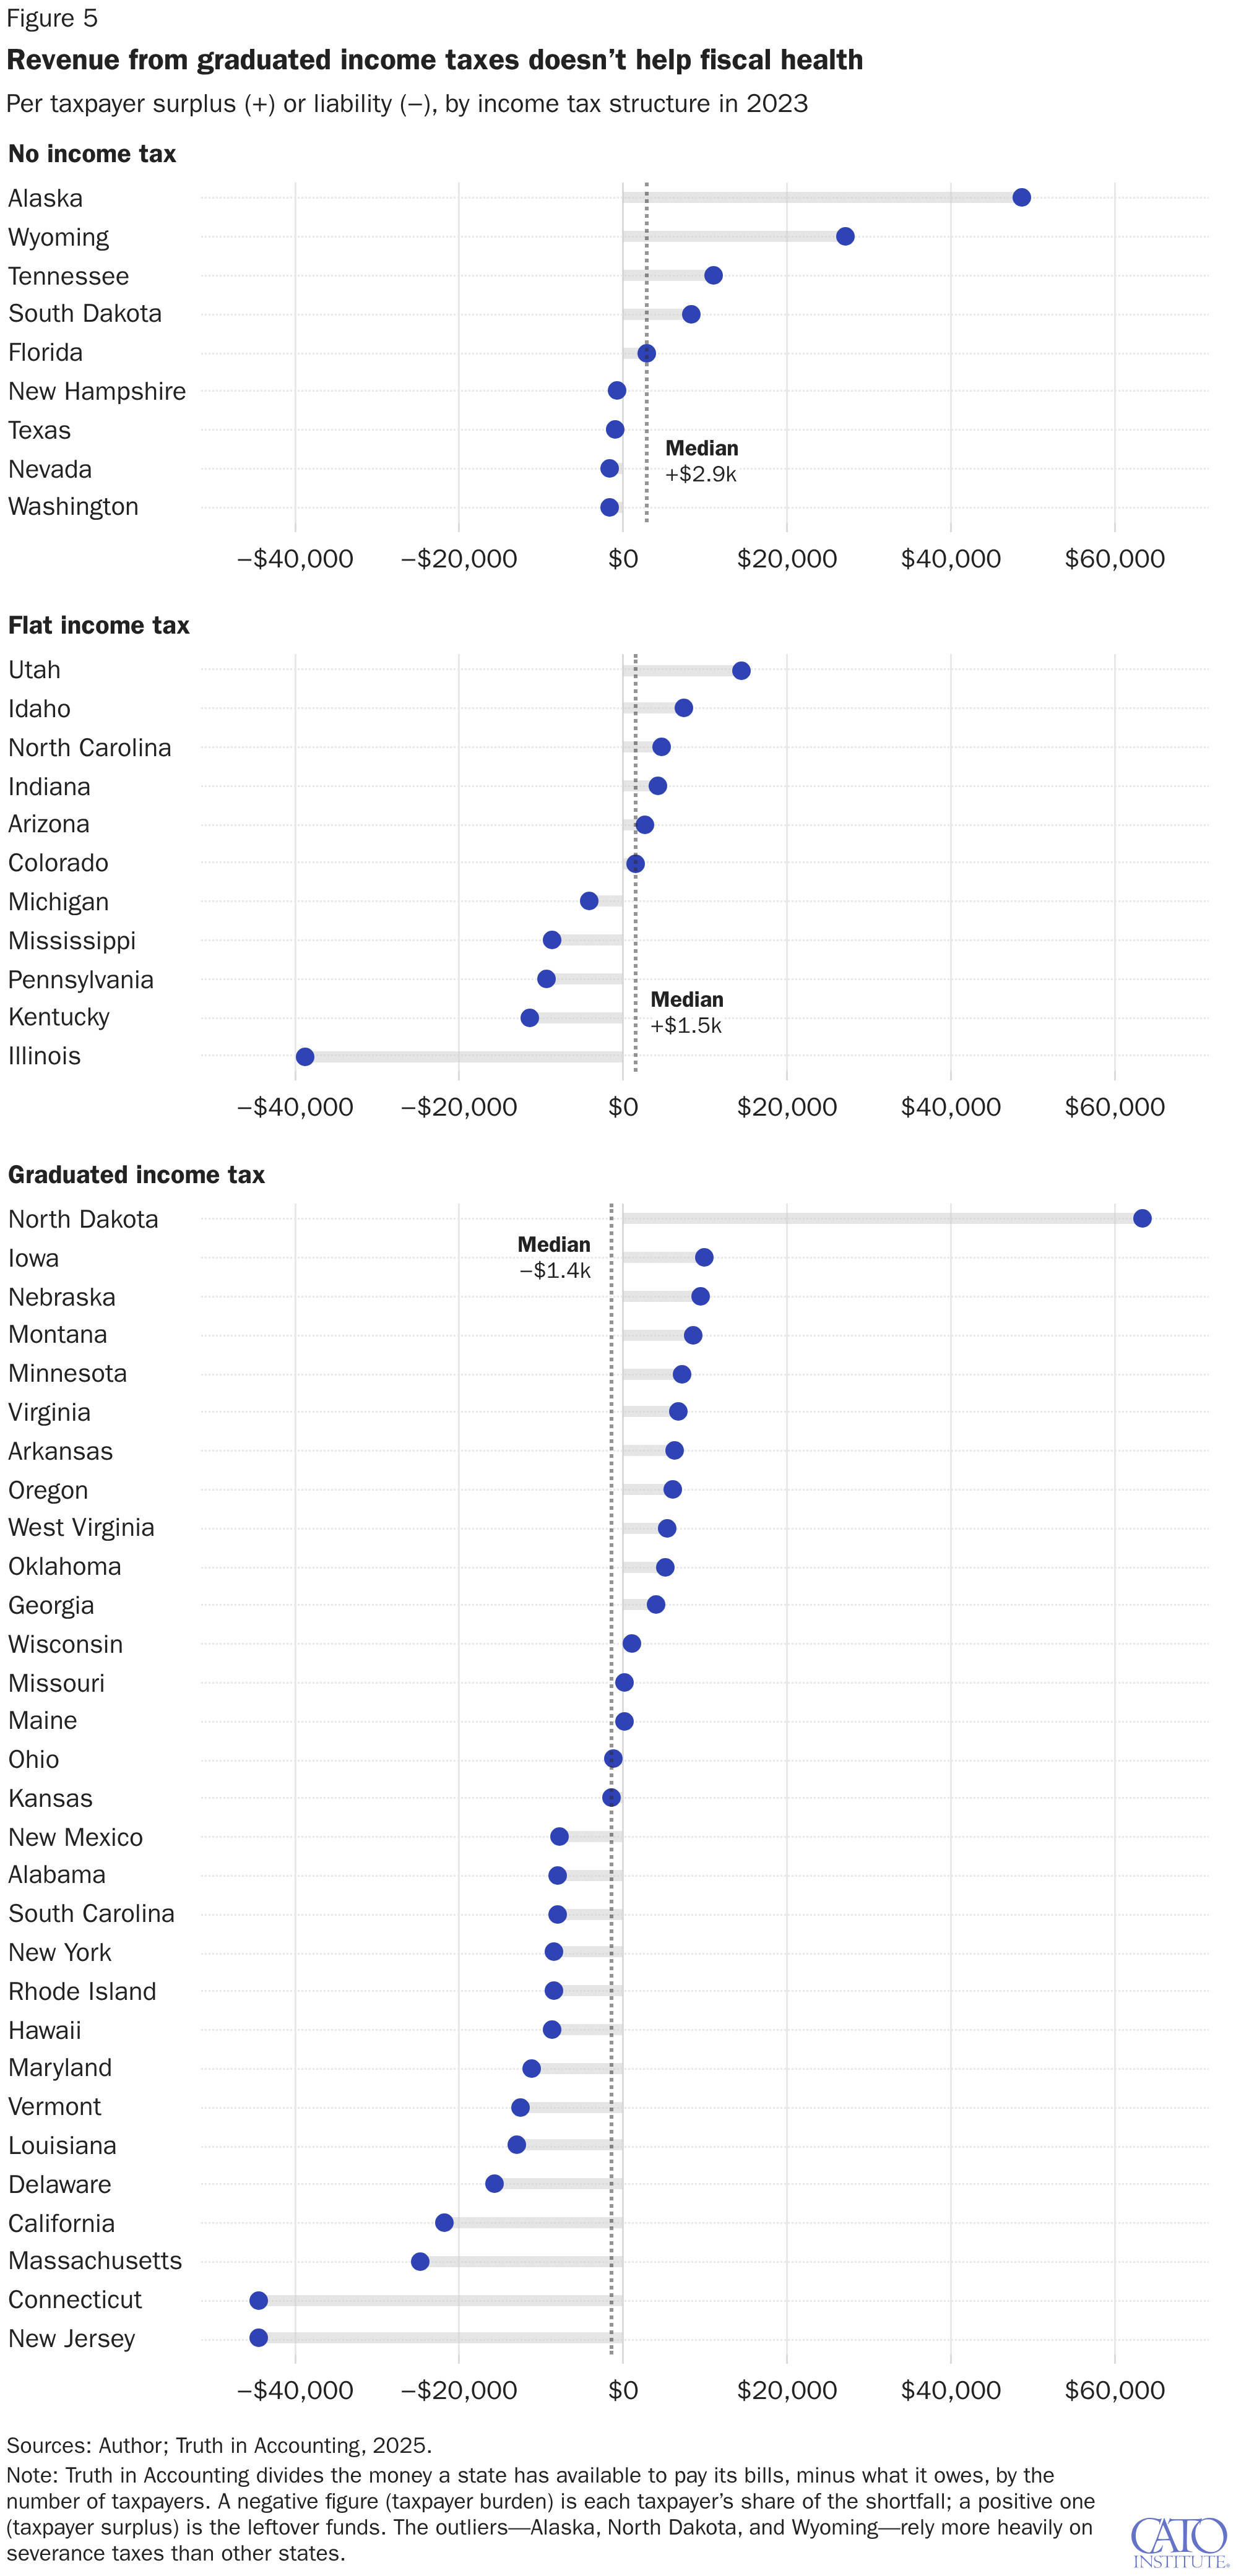
The more important story is on the expenditure side. Illinois and Utah both have flat taxes, with a fiscal burden gap of more than $50,000 per taxpayer. Despite Illinois collecting per capita taxes above the national average, this gap is primarily driven by underfunded pension liabilities.54 Other outliers, such as Alaska, North Dakota, and Wyoming, rely on severance taxes on natural resource extraction for a higher share of their revenues.55
This pattern may also be driven by the volatility of graduated income taxes and the political economy constraint of fewer revenue sources. Graduated income taxes are more volatile because they rely more on higher-income earners, whose earnings come from more volatile sources, such as capital gains, bonuses, and equity.56 The volatility means that higher revenues during economic booms fund permanent spending commitments that become structural deficits in downturns. Additionally, for states with balanced budget constraints, fewer and less-flexible revenue sources can discipline a government that is inclined to overspend. Flat and no-income-tax states tend to force clearer fiscal trade-offs instead of relying on higher taxes on more volatile incomes to cover new spending.
Conclusion
In the past half century, 30 states cut their top income tax rates, and the number with flat taxes tripled. Over the same time, 8 states raised their rates. States that lowered and flattened their income taxes grew faster and raised incomes. States that raised rates lost top earners and suffered slower growth.
Colorado was the first state to convert its graduated system to a flat tax, and a decade later, its per capita income was about 5 percent higher than comparable states that kept graduated rates. Across all flat-tax-adopting states, incomes grew about 1 percentage point faster over several years, which could translate into incomes about $4,000 higher than they would have been had they maintained a graduated income tax. Amendment 87 would repeal Colorado’s flat tax and reverse its flat tax advantage.
The federal lesson is the same, with larger consequences. Pro-growth tax policy once aimed for a flat tax, beginning with the Hall–Rabushka proposal in the 1980s. Democratic presidential candidate Jerry Brown came in second to Bill Clinton in 1992, proposing a 13 percent flat tax.
The standard objection to a federal flat tax is that it would be unpopular, fiscally costly, or not worth the trouble. The evidence from more than a dozen states and twice as many countries that have flat income taxes tells the opposite story. Lower, flatter income taxes are pursued by popular politicians and come with wide-ranging economic benefits. A federal flat tax is achievable and would be good for growth.
The author thanks Santiago Forster for his assistance in preparing this briefing paper.

About the Author


This work is licensed under a Creative Commons Attribution-NonCommercial-ShareAlike 4.0 International License.