
Executive Summary
More than 86 million people have legally immigrated to the United States between 1783 and 2019. The legal regime under which they immigrated has changed radically over that time; the politics surrounding those changes have remained contentious, and past immigration policies inform the current political debate. Conflicting visions and piecemeal legislation have left the United States with an archaic and barely coherent immigration system with outdated policy objectives that is primarily controlled by the executive branch of government. We review the history of U.S. immigration policy, including the legal controversies that empowered Congress with its immigration plenary power and the historical policy decisions that still guide the U.S. immigration system, in order to contextualize the current political debate over immigration at the beginning of the Biden administration.
Introduction
In 1952, President Harry S. Truman lamented that “in no other realm of our national life are we so hampered and stultified by the dead hand of the past, as we are in this field of immigration.”1 From the colonial period through the Industrial Revolution, the Roaring Twenties, the Great Depression, and up to today, radical swings in immigration policy have had their connections to earlier debates and policies. It’s important to understand how immigration policy got to this point because many of the same debates keep recurring and the Biden administration will likely start to remove some of the immigration restrictions imposed by former president Donald J. Trump. We review the history of U.S. immigration policy, including the legal controversies that empowered Congress with its immigration plenary power and the historical policy decisions that still guide the U.S. immigration system, in order to contextualize the current political debate over immigration.
The Colonial Period: 1607–1776
Between the 16th and the late 18th century, European governments implemented mercantilist economic policies to increase their trade surpluses via import tariffs and the subsidization of export industries. Mercantilists treated their citizenry like resources and restricted or compelled their movement based on factors such as class or social status.2 Britain, for example, fiercely protected citizenship by limiting naturalization and forcibly populating its colonies with criminals and other social pariahs that the British government deemed undesirable. Naturalization was economically important because only British citizens, known as “subjects,” could own real estate and bequeath it to their heirs under English common law.3 Thus, limitations on naturalization constrained the economic options for new immigrants from other nations. Britain’s unwillingness to naturalize immigrants relegated most of its alien residents to a legal position called “denizen,” similar to the Athenian metic (a foreign resident of Athens), which gave them limited economic rights, reduced their political rights, and placed restrictions on bequeathing their estates under English common law.4
Whereas European countries discouraged interior migration of their citizens, they typically encouraged the immigration of skilled workers without encouraging naturalization.5 European governments also encouraged immigration to their colonies and colonial governments offered quick naturalization, land grants, and debt relief.6 In North America, the British Crown’s desire to settle its colonies caused it to ignore the lax naturalization processes in the colonies, which granted immigrants the rights of Englishmen within the colonies in which they resided. Eventually, however, in 1700 Parliament limited the colonies’ ability to grant naturalization and other group rights because it believed that the colonial naturalization policies weakened English citizens’ trading positions.
Thereafter, many colonies relied on local naturalization and grants of denizenship until Parliament passed the Plantation Act of 1740 to ease the colonial naturalization process and spur settlement.7 The Pact created a uniform naturalization system that granted new, non-Catholic colonial settlers English naturalization after seven years of residency contingent upon a religious test, a pledge of allegiance, and a statement of Christian belief to which some people, such as Jews, were exempt.8 Despite the Plantation Act, the colonies preferred to rely on more rapid local naturalization processes to further incentivize immigration.
Voluntary and Forced Migration
Individuals arrived in the British colonies via two very different paths. Some were forced to immigrate, either through transportation or slavery, while others came voluntarily. “Transportation,” a criminal term for forced emigration, allowed Britain to expel its social undesirables, criminals, and others to populate its North American colonies. In practice, criminals sentenced to death could either choose transportation or hanging, and so forced emigration was a common choice since death was the only punishment for a felony conviction under English common law. In North America, transported persons began landing in British colonies as early as 1615.9
By 1717, the Transportation Act granted English courts the ability to sentence convicts to transportation, thus streamlining the process. The courts could effectively banish convicts for up to 14 years and turn them into indentured servants. Before the American Revolution, Britain transported about 50,000 convicts to the American colonies.10 While colonists opposed transportation, the colonies were unable to prevent the migration of British subjects who were exempted from many colonial immigration restrictions.
The largest population of forced migrants to North America were not criminals from Britain but 388,000 African slaves.11 Slavery was different from the other forced migrations as, unlike in the case of convicts, there was no possibility of earning freedom, although some slaves were manumitted in the centuries before the American Civil War. African slaves and their descendants have comprised a substantial part of the population in the British colonies and the United States since the 1600s, but thinking of slaves as immigrants stretches the meaning of that word to its breaking point. Enslavement was an experience so radically different from what was experienced by other migrants that the story of slavery does not fit into this paper’s narrative.
Those who migrated to the colonies on their own volition were drawn by the allure of cheap land, high wages, and the freedom of conscience in British North America.12 Many of these individuals financed their passage by entering into indentured servitude contracts. This arrangement meant that migrants exchanged future years of their labor for passage to North America. At the end of their contracts, the indentured servants would be discharged with a small amount of cash, skills, and sometimes land on the new continent. During the 1700s, a significant share of Europeans coming to British North America were indentured servants.
While the colonies were eager to attract immigrants, colonial cities and towns still regulated immigration by barring entry of the poor, applying head taxes, and using banishment. However, these small and heterogeneous colonial communities were less meticulous than European governments in enforcing their immigration laws and generally granted equal rights to accepted foreigners. For example, Massachusetts applied its laws against pauperism equally to all members, regardless of citizenship status. Other states extended voting rights to aliens and, sometimes, to “servants, Negroes, Aliens, Jews, and Common sailors.”13
By 1755, the colonial population surpassed one million residents, which worried some in England. In 1763, Britain prohibited colonists from settling the land acquired from France during the Seven Years War and subsequently curtailed colonial naturalization authority in 1773.14 Parliament’s actions infuriated colonialists to such an extent that they complained about them in the Declaration of Independence, charging King George III with preventing “the population of these States; for that purpose obstructing the Laws for Naturalization of Foreigners; refusing to pass others to encourage their migrations hither, and raising the conditions of new Appropriations of Lands.”15 The colonial population had increased to roughly 2.2 million residents by the beginning of the American Revolution, much of that growth fueled by the 346,000 European immigrants and their descendants.16
The Forging of a Nation: 1776–1830
More than 86 million immigrants have entered the United States from 1783 to the end of 2019 (Figure 1).17 That large flow was shaped by many legal issues that were first addressed during the early days of the American Republic. Citizenship was one of the earliest issues that American politicians grappled with. Three fundamental concepts underlie U.S. citizenship law, and their relative importance shifts depending on the needs and the norms of the era.18 The first is jus soli, the right of the soil, which means that those born on U.S. soil are automatically granted citizenship. The second is jus sanguinis, the right of blood, which means that those born to U.S. citizens in other countries automatically earn U.S. citizenship under most conditions. The third is pledged allegiance, whereby those who civically commit to the United States become U.S. citizens. Pledged allegiance is related to the concept of naturalization, the process by which an immigrant voluntarily moves to the United States and swears allegiance to the government to fully enter American political life through citizenship.

Pre-Ratification Period
Immediately after issuing the Declaration of Independence, the Founders thought that pledged allegiance would confer citizenship through consent. This approach diminished the new country’s reliance on jus soli and jus sanguinis. It is unsurprising that during the American Revolution, when the American Founders feared that the British would punish their disloyalty with death, that loyalty trumped one’s birth country or bloodline as a matter of importance. Thus, a pledge of allegiance was the ticket to receive the full panoply of political rights in a new and struggling nation.
This situation effectively divided the population into three categories: former British citizens who supported the revolution and became American citizens, British citizens who still supported the British government and became enemy aliens, and a murky middle ground of fair-weather residents.19 After the war, the presence of former loyalists and those in the murky middle prompted the U.S. government to view citizenship as “both a matter of place of birth and one of consent.”20
Post-Ratification Period
The Constitution gave Congress the power to establish a uniform rule of naturalization in Article I, Section 8, and made immigrants eligible for all federal offices except the presidency and, later, the vice presidency.21 St. George Tucker, a prominent lawyer from Virginia and a delegate to the Annapolis Convention of 1786, wrote that excluding immigrants from the office of the president would limit foreign influence on the government.22 But Tucker also argued that foreign-born people should not be kept out of the councils of power entirely, nor deprived of federal employment for the same reasons, because such efforts would be ultimately unsuccessful, breed resentment, and be undesirable in a country as open to foreign ideas and peoples as the United States.23 In the first Congress in 1789, almost 10 percent of all members of the House of Representatives and the Senate were foreign-born, compared to just 3 percent in 2021.24 Ultimately, the Constitution did not create an enumerated power to control free people’s immigration into the United States.25 The Constitution enumerates other powers that are considered inherent to a sovereign, but the Founders did not include immigration as one of them.
The Constitutional Convention’s decision to only grant the federal government authority over naturalization meant that states regulated immigration as part of their policing powers—banishing criminals and noncitizens, denying entry to the poor, and even attempting to ban whole races.26 Although many of the Founders were concerned about Catholicism, alien voting rights, non-English languages, and cultural assimilation, Thomas Jefferson summarized their overall position when he stated, before listing his concerns, that “the present desire of America is to produce rapid population, by as great importations of foreigners as possible.”27 Beyond ideological motivations, several other factors likely influenced the Founders, including the desire to populate the United States, the need to pay the country’s debts, and the demand for new laborers.
The 1790 U.S. Census, which excluded Native Americans, revealed that the United States’ population had grown significantly since the 1770s, reaching roughly 3.9 million residents. The Census also showed that about 80.7 percent of the United States’ population was white, while the remainder (19.3 percent) were almost all African slaves.28 In terms of ethnicity, only 69.3 percent of the U.S. population could trace their origins to either England, Scotland, or Wales.29 Compared to other European countries, the U.S. population was ethnically and racially heterogeneous in 1790.30
In the same year, Congress passed the Naturalization Act of 1790, extending citizenship to free white persons of good character who had resided in the United States for two years and took an oath of allegiance.31 The law excluded indentured servants, non-whites, and slaves from naturalization. Despite these exclusions, the Naturalization Act of 1790 was arguably the most liberal naturalization law to date, as it created a short and uniform path to citizenship that lacked gender requirements, religious tests, skills tests, or country of origin requirements.
However, some Congressmen were unsatisfied with the Naturalization Act of 1790 because they feared that a large foreign-born population with voting rights could undermine national security, especially when the United States faced the prospect of war. As a result, Congress passed the Naturalization Act of 1795. The new act increased the residency requirement for naturalization to five years and added a clause requiring prospective citizens to declare their intention to naturalize three years before doing so.32 Notably, the Naturalization Act of 1795 held a religious and moral subtext that changed “good character” to “good moral character.”33
After a close election and a looming war with France, Congress passed a series of bills in 1798 collectively known as the Alien and Sedition Acts that expanded the federal government’s involvement in immigration policy. Together these acts subjected aliens to the threat of national surveillance and arbitrary arrest and granted a new power to the president to deport noncitizens via decree.34 Notably, these acts increased the residency period for naturalization to 14 years and required that prospective citizens declare their intent to naturalize five years before doing so.35
During congressional debate, a partisan schism arose over whether noncitizens had rights under the Constitution. Democratic-Republicans argued that noncitizens possessed all rights under the Constitution because it often used the words “people” or “persons” rather than “citizens.” James Madison denounced the idea that noncitizens didn’t have rights under the Constitution and argued that even if they didn’t, the government would still not have absolute authority over them. Congressmen also decried that deportation by presidential decree violated the Fifth and Sixth Amendments.36 Although these acts empowered the federal government, much of the Alien and Sedition Acts expired by 1801. In 1802, Congress passed the Naturalization Law of 1802 that reverted the residency requirements for naturalization to five years. However, the 14-year waiting period remains the longest legally mandated residency time required for prospective citizens before becoming eligible for naturalization in American history. (Today’s immigrants who entered on student visas, adjusted to H‑1B visas, and then earned green cards may wait longer for citizenship, but those are not mandated wait times as they arise from a combination of different legal requirements.)
After the 1800 election, both parties courted the support of the approximately 250,000 European immigrants who arrived between 1783 and 1815.37 By 1819, economic depression and the worry that Britain might ship their poor to the United States tempered Congress’ pro-immigration position. While Congress lacked an enumerated power under the Constitution to control immigration, in 1819 it indirectly regulated immigration under the guise of safety by limiting the number of passengers that a ship could carry based on its tonnage.38 This legislation lowered the carrying capacity of passenger ships and increased the price of travel, consequently reducing the number of poor immigrants who could afford passage. The bill also required ship captains to provide a passenger manifest to customs officials that allowed the federal government to track immigration flows for the first time.
The Second Wave, Third Wave, and Expansion of the Federal Government: 1830–1910
The next wave of immigrants began to arrive around 1830, when the U.S. population was nearly 12.9 million.39 Most immigrants in this second wave relied on credit or family remittances to pay for their passage to the United States. These funding methods caused the number of indentured servants to decline and nearly disappear.40 International developments—such as the Irish Potato Famine, beginning in 1845, and the European political revolutions of 1848—helped push immigrants to the United States. Overall, international and domestic conditions increased the number of immigrants from 599,125 during the 1830s to 1,713,251 during the 1840s.41
Antebellum Period
During the Antebellum Period, immigrants were mainly German, Irish, English, Canadian, and French. These immigrants had different cultures and religions, particularly the German craftworkers and Irish Catholics, both of which created political backlash and prompted the emergence of nativist political parties in the United States.42 Beyond these issues, nativists also worried about wage competition, immigrants’ use of outdoor relief (welfare consumed outside of institutions) and other welfare programs, and the religious dichotomy between the new Catholic immigrants and the native-born Americans, who were primarily Protestant.43 Moreover, nativists were also concerned that Catholic immigrants would oppose slavery.
In New York City, 51 percent of the population was foreign-born, while in California more than 63 percent of the population was foreign-born in 1855.
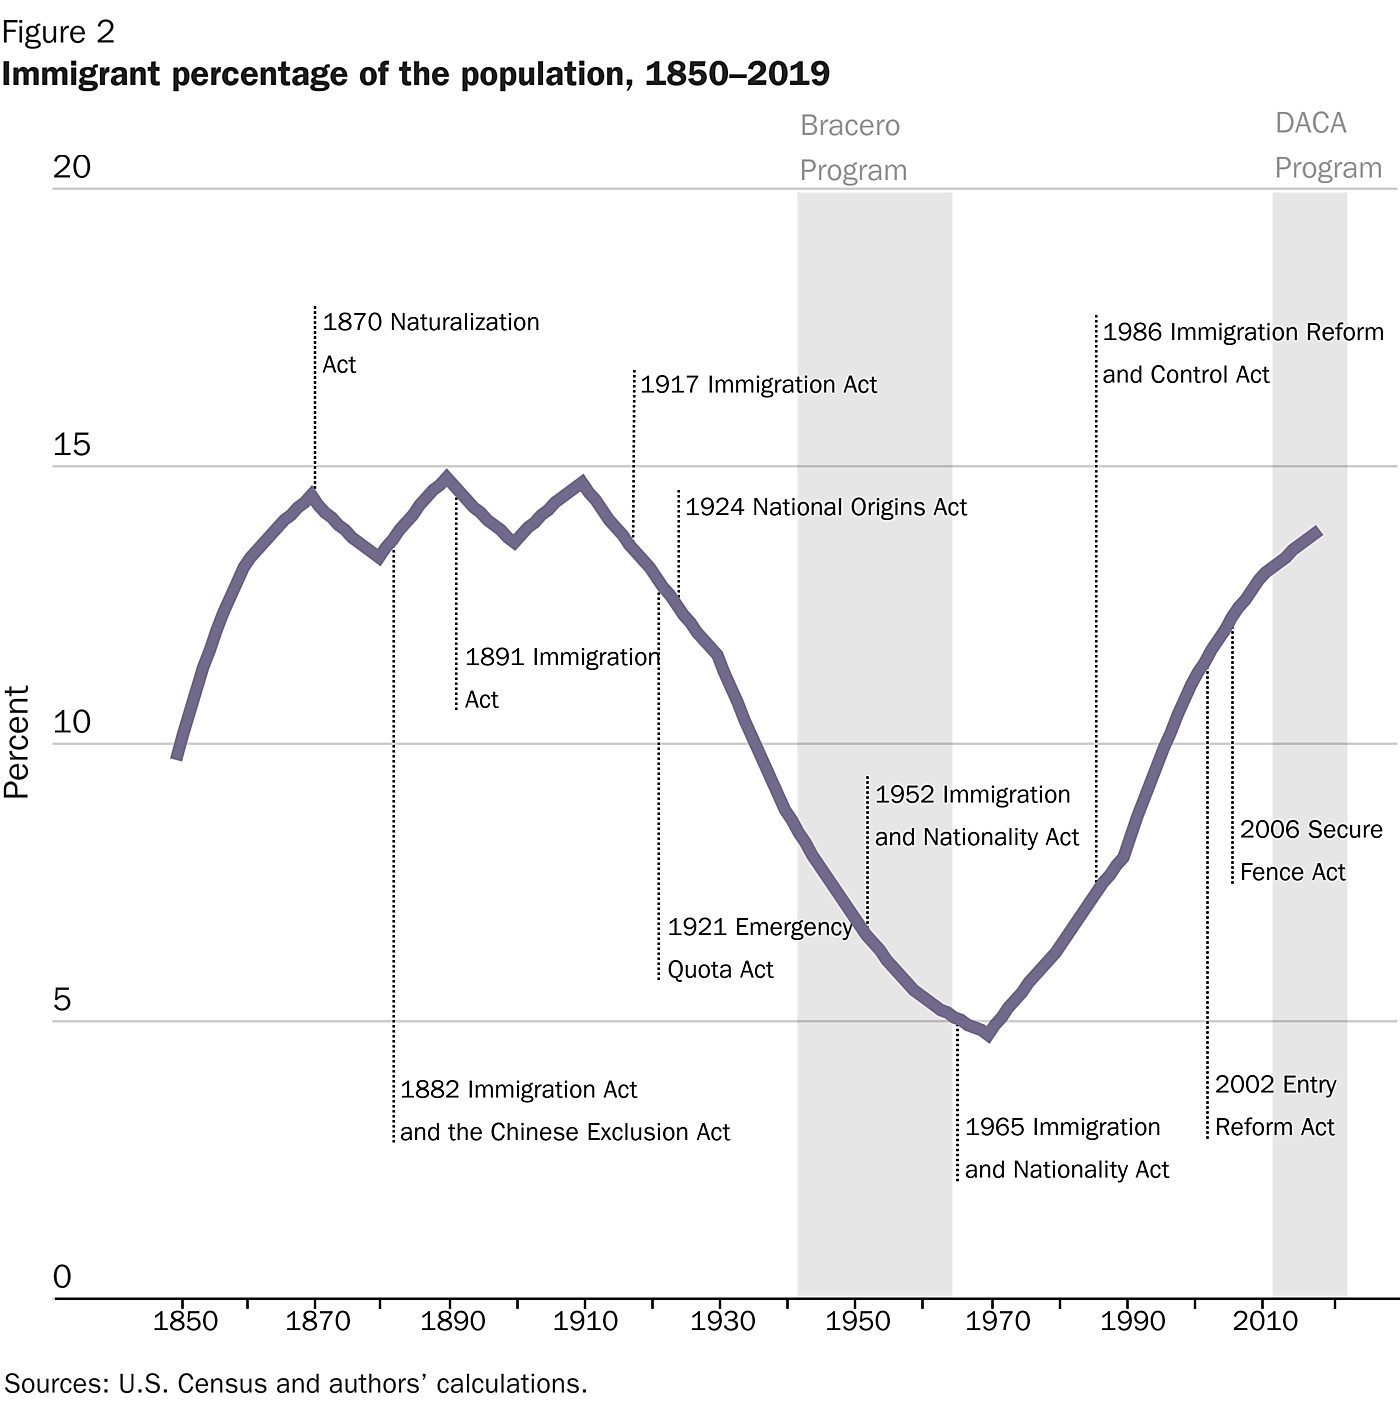
These sentiments spawned the American Party, also called the Know Nothings, in the 1850s. Among its many nativist policies, the party’s central goal was increasing the residency period for naturalization to 21 years.44 The Know Nothings initially won several elections. However, the party’s popularity subsided after immigration slowed in 1855. Despite slowing immigration flows, between 1820 and 1860 the 30-year-long wave of immigrants altered U.S. demography, increasing the foreign-born population to 13.2 percent by 1860 (Figure 2).45 Regionally, the proportion of the population that was foreign-born could be far higher. In New York City, 51 percent of the population was foreign-born, while in California more than 63 percent of the population was foreign-born in 1855.46
Civil War and Postbellum Expansion
When the Civil War began in 1861, demand for workers in war industries increased. To fill the void, pro-immigration Republicans sought to discredit nativists. President Abraham Lincoln contended that “our immigrants [are] one of the principal replenishing streams which are appointed by Providence to repair the ravages of internal war and its waste of national strength and wealth.”47 Under the Lincoln administration, Congress passed both the Homestead Act in 1862 and the Act to Encourage Immigration of 1864, also known as the Contract Labor Act. The Homestead Act offered land grants to both U.S. citizens and immigrants who were eligible for naturalization and who were willing to settle and develop the land for five years. The last consequential immigration law passed during Lincoln’s administration was the Contract Labor Act of 1864, which allowed private employers to recruit foreign workers, pay their transportation costs, and contract their labor.48
The Lincoln administration had a longer-term effect on American immigration policy when it appointed Anson Burlingame as the U.S. Minister to China in 1861. Burlingame negotiated the Burlingame-Seward trade treaty with China in 1868. Recognizing the “mutual advantage of the free migration and emigration of their citizens,” the Burlingame-Seward Treaty ensured that Chinese citizens had the right to emigrate and enter the United States.49 Although the treaty didn’t secure naturalization rights for Chinese immigrants, it secured their ability to legally emigrate, which had previously been illegal under Chinese law. In other words, the U.S. government negotiated a treaty where the major provision required the Chinese government to allow emigration to the United States. As a result, Chinese immigrants joined an increasing flow that pushed the U.S. foreign-born population up to about 14.4 percent of the total in 1870.50
With the Civil War concluded, Congress set about reforming naturalization law to be consistent with the end of slavery. However, Congress members disagreed on how far they should extend the rights afforded by naturalization. Sen. Charles Sumner (R‑MA) wanted to liberalize existing naturalization legislation by striking out “the word ‘white’ wherever it occurs so that there shall be no distinction of race or color in naturalization.”51 Other congressmen refused to extend naturalization rights to Asians and American Indians. Ultimately, the Naturalization Act of 1870 only granted naturalization rights to “aliens being free white persons, and to aliens of African nativity and to persons of African descent.”52
The federal government even seemed to initially interpret the newly ratified Fourteenth Amendment, which stated that “all persons born or naturalized in the United States, and subject to the jurisdiction thereof, are citizens of the United States and of the State wherein they reside,” to prohibit birthright citizenship for the descendants of Chinese immigrants.53 The federal government held this position until the Supreme Court ruled otherwise in the 1898 United States v. Wong Kim Ark decision.54 In response to growing anti-Chinese sentiment nationwide, and especially in California, Congress passed the Page Act of 1875. The Page Act restricted the immigration of Chinese contract laborers, convicts, and many Chinese women, most of whom were the wives of male workers, on the spurious grounds that they were prostitutes. These restrictions were in violation of the Burlingame-Seward Treaty.
Throughout the 1870s, the federal government adopted and began enforcing many state-level restrictions that had been on the books for decades but were rarely enforced. Congress also passed the Immigration Act of 1882 and the Chinese Exclusion Act in the same year. The former bill imposed a $0.50 federal head tax on each alien passenger to fund immigration enforcement.55 It also mandated that state officials identify and deny entry to “any convict, lunatic, idiot, or any person unable to take care of himself or herself without becoming a public charge.”56 The Chinese Exclusion Act emulated previous California legislation that attempted to impose blanket bans on immigrants from China. Although the Chinese Exclusion Act of 1882 only imposed a 10-year ban on Chinese laborers, Congress extended this ban through 1943.57
While the Supreme Court initially ruled that states had the authority to regulate immigration, it expanded the federal government’s immigration authority over time. For example, the Supreme Court found, in the case of Corfield v. Coryell (1823), that “[c]ommerce with foreign nations, and among the several states, can mean nothing more than intercourse with those nations, and among those states, for purposes of trade.”58 However, the Supreme Court did not consider free immigrants to be articles of commerce, so they were not subject to federal regulation. Similarly, the Supreme Court’s 1837 New York v. Miln ruling noted that “[p]ersons are not the subjects of commerce, and not being imported goods, they do not fall within the reasoning founded upon the construction of a power given to Congress to regulate commerce and the prohibition of the states from imposing a duty on imported goods.”59 Thus, states could pass laws excluding various kinds of immigrants, reaffirming the lack of federal jurisdiction.
Twelve years later, however, the Supreme Court’s rulings in the Passenger Cases struck down several state laws that restricted immigration on the grounds that they interfered with the commerce clause and federal jurisdiction over taxation and indirect regulation of immigrants.60 By 1875, the Supreme Court’s Henderson v. Mayor of New York ruling struck down a New York state law that required both a bond for ship captains and an immigrant fee because it infringed on Congress’s power to regulate commerce. In this case, the Justices noted that the power to regulate commerce ended when the passengers landed in the United States.61 In the 1884 Head Money Cases, the Supreme Court decided that Congress had “the power to pass a law regulating immigration as a part of the commerce of this country with foreign nations” and overrode state immigration policies.62 Although many of these cases expanded Congress’ authority, they were minor encroachments relative to the Supreme Court’s decision in Chae Chan Ping v. United States in 1889.
Prompted by a provision of the Chinese Exclusion Act, the Supreme Court determined that Congress had an extra-constitutional plenary power over immigration based on the “incident of sovereignty” rather than any specifically enumerated power. The Court reached this conclusion despite the fact that the Constitution explicitly enumerates other powers that are unquestionably an “incident of sovereignty,” such as regulating international commerce, raising an army, and declaring war.63 In the Court’s opinion, Justice Stephen Field recounted California’s constitutional convention, which had found that “the presence of Chinese laborers had a baneful effect upon the material interests of the state, and upon public morals; that their immigration was in numbers approaching the character of an Oriental invasion, and was a menace to our civilization.”64 Field then reasoned that the United States had the power to “preserve its independence, and give security against foreign aggression and encroachment,” such as Chinese migration. The Supreme Court’s decision created a “constitutional oddity” that subsequently decreased judicial oversight of immigration law.65
The Progressive Era
Between 1861 and 1890, 10.4 million immigrants arrived in the United States, mainly of Southern and Eastern European descent. This wave was more than twice the size of the previous wave, which had 4.9 million immigrants of mostly Northern European descent, who migrated to the United States between 1831 and 1860.66 By 1890, decades of immigration increased the foreign-born portion of the U.S. population to 14.8 percent.67 In this new wave, many migrants desired to work temporarily in the United States before returning home. While return migration was not a new phenomenon, lower transportation costs made the option more viable.
Congress passed the Immigration Act of 1891 after a congressional investigation found “widespread violations and circumventions” of existing immigration laws.68 The new legislation expanded the list of excluded immigrants,69 enabled the deportation of immigrants present for less than a year if government authorities later found them excludable, and established the Office of the Superintendent of Immigration within the Treasury Department—later reformed as the Bureau of Immigration.70 The act also made immigration inspectors’ rulings final and ended the possibility of judicial review, although the Treasury Secretary could still review them.71 Twelve years later, the Immigration Act of 1903 expanded the list of excludable immigrants and excluded aliens from “due process protection hitherto provided by the Fourteenth Amendment to all ‘persons’ rather than ‘citizens.’”72 In 1903, Congress also relocated the Bureau of Immigration to the Department of Commerce and Labor.
During the early 1900s, many Progressives argued that immigrants impeded the achievement of an ideal society, committed crimes, and abused welfare.73 Others proposed that the government had a duty to protect natives from immigrants who supposedly depressed innovation and lowered native-born American wages.74 Scholars of the era contended that certain ethnicities possessed immutable intrinsic characteristics that would prevent assimilation into American society.75 To combat these perceived ills, Progressives championed mandatory literacy tests, as well as various other eugenics-inspired racial and ethnic exclusions of Jews, Asians, and Africans.76
The confluence of pseudo-scientific eugenic claims and a desire for an activist federal government engendered several immigration acts between 1890 and 1907, some of which have already been discussed, that increased the number of inadmissible classes of immigrants, expanded the power of deportation, and raised the head tax on immigrants to $4. Anti-immigrant sentiment also prompted the United States to block the immigration of Japanese laborers via the informal Gentlemen’s Agreement.77 Additional immigration restrictions were politically popular but divisive for the Republican Party.78
Dillingham Commission, World War I, and the National Origins Act: 1910–1930
Progressives and nativists bolstered their anti-immigration position by using the Dillingham Commission report as evidence that “‘new immigrants’ were fundamentally different from old immigrants who came from Western and Northern Europe.”79 The Dillingham Commission was staffed with members who had previously supported immigration restrictions, with the single exception of one member named William S. Bennet, of New York.80 Its members cherry-picked data to reach the predetermined conclusion that immigrants from Northern and Western Europe were innately superior to those from Southern and Eastern Europe. When data revealed large numbers of Northern and Western Europeans seeking welfare in American cities, the Dillingham Commission returned the data “for further information or for corrections.”81 Despite its methodological flaws, policymakers embraced the report and its recommendations because it confirmed their prejudices.
Citing concerns about the intelligence of new immigrants and how well they would assimilate, the Americanization movement started as a collective of private nonprofit organizations that backed civics classes, language lessons, and the destruction of the “hyphenated American.” This movement eventually morphed into a series of government programs that wrote school curricula to push for immigrant assimilation, including banning the German language from being spoken in public schools.82 These anti-German laws actually slowed assimilation but were very popular, especially during World War I.83 Politically, anti-immigration sentiment prompted Congress to pass the restrictive Immigration Act of 1917—overruling President Woodrow Wilson’s veto. This act sanctioned legal immigrants’ detention and deportation if they committed a deportable crime within five years of their arrival. It also imposed literacy tests and other restrictive measures aimed at limiting immigration flows from African and Asian countries.84
After the end of World War I, the demobilization of four million soldiers and the anticipation of a wave of post-war migration caused Congress to consider further immigration restrictions.85 Restrictionists and eugenicists strengthened their position during this time by providing their own dubious accounts of immigration’s role in American history.86 Others used improperly administered intelligence tests to prove the intellectual inferiority of black Americans and new immigrants, biasing their results by intentionally surveying a disproportionate number of immigrants and blacks who were mentally handicapped for their final report and then omitting that crucial detail in their conclusions.87 With support mounting, Congress passed restrictive legislation again in 1921.
The Emergency Quota Act of 1921 broke with previous immigration laws by establishing a cap on the number of quota admissions equal to roughly 358,000 for immigrants from the Eastern Hemisphere, exempting immediate relatives. This was the first American immigration law that substantially emphasized family-based immigration over economic immigrants. Of the total quota admissions, the bill allocated 55 percent to Northern and Western European countries. The bill’s provisions favored family members of U.S. citizens by exempting admissions of certain immediate relatives. Before 1921, immigration laws pertained primarily to which immigrants to exclude, while any immigrant not specifically excluded could migrate. However, beginning in 1921 and continuing until today, the opposite has been the status quo: federal agencies decide which immigrants to admit and deny entry to those not explicitly approved.
Before 1921, immigration laws pertained primarily to which immigrants to exclude, while any immigrant not specifically excluded could migrate. However, beginning in 1921 and continuing until today, the opposite has been the status quo: federal agencies decide which immigrants to admit and deny entry to those not explicitly approved.
The Emergency Quota Act of 1921 broke with previous immigration laws by establishing a cap on the number of quota admissions equal to roughly 358,000 for immigrants from the Eastern Hemisphere, exempting immediate relatives. This was the first American immigration law that substantially emphasized family-based immigration over economic immigrants. Of the total quota admissions, the bill allocated 55 percent to Northern and Western European countries. The bill’s provisions favored family members of U.S. citizens by exempting admissions of certain immediate relatives. Before 1921, immigration laws pertained primarily to which immigrants to exclude, while any immigrant not specifically excluded could migrate. However, beginning in 1921 and continuing until today, the opposite has been the status quo: federal agencies decide which immigrants to admit and deny entry to those not explicitly approved.
The Immigration Act of 1924, also known as the National Origins Act, refined the system that had been established in 1921. The new law reduced the annual quota from roughly 358,000 to about 164,000. The law also established per country cap allocations that awarded 82 percent of the world quota to immigrants from Western and Northern European countries, 14 percent to immigrants from Eastern and Southern European countries, and a mere 4 percent to immigrants from the remaining Eastern Hemisphere.88 Like the 1921 act, the 1924 act did not put restrictions on immigrants from the Western Hemisphere. The 1924 act also categorized wives and children as nonquota admissions, exempting them from the quota caps. Under the 1924 act, there were three categories of aliens: quota immigrants entering under immigration statutes as permanent residents, nonquota immigrants entering as spouses and unmarried children of quota immigrants, and nonimmigrants entering temporarily.89
Few politicians opposed the 1921 Emergency Quota and 1924 National Origins acts. These laws were politically popular because of widespread notions of eugenics, nationalism, and xenophobia. For example, even popular books, such as The Melting Pot Mistake by New York University sociologist Henry Pratt Fairchild, defended the new restrictionist regime by using the crudest elements of nationalism, eugenics, and xenophobia.90 Former state senator Edwin E. Grant, a Democrat, summed up these sentiments when he wrote, “the prosperity made possible by our forefathers has lured the parasites of Europe—the scum that could have so well been eliminated from the melting-pot.”91
Since eugenics was a significant motivation, it is initially perplexing that the Immigration Act of 1924 established quotas based on the country of origin rather than the immigrants’ race or genetics, especially considering how the latter characteristics were most important to the progressive demographic central planners of the time. A proponent of the law, Fairchild noticed this peculiarity and commented that:
The question will probably at once arise, why, if this legislation was a response to a demand for racial discrimination, was it expressed in terms of nationality? The answer is simple. As has already been shown, our actual knowledge of the racial composition of the American people, to say nothing of the various foreign groups, is so utterly inadequate that the attempt to use it as a basis of legislation would have led to endless confusion and intolerable litigation. So Congress substituted the term nationality, and defined nationality as country of birth. It is clear, then, that “nationality,” as used in this connection, does not conform exactly to the correct definition of either nationality or race. But in effect it affords a rough approximation to the racial character of the different immigrant streams.92
The 1924 Immigration Act did not place numerical quotas on immigrants from countries in the Western Hemisphere.93 As a result, immigration from Mexico and Canada spiked as immigrants from these regions replaced Asian and European immigrant laborers. In response, immigration restrictionists argued that Mexicans could not legally immigrate because they were ineligible for citizenship as “mixed breeds”—a legal argument based on a statute that limited immigration to only those who could naturalize.94 Specifically, economist Roy L. Garis reasoned that “to admit peons from Mexico… while restricting Europeans and excluding Orientals is not only ridiculous and illogical—it destroys the biological, social, and economic advantages to be secured from the restriction of immigration.”95 Eventually, the federal government resolved this disagreement by classifying Mexicans as white.96 The Supreme Court, however, decided not to confer the racial status of “white” to high-caste Hindus, in United States v. Bhaghat Singh Thind, even though racial theorists deemed Asian Indians to be Aryans.97
Regardless of the motivations behind the 1924 Immigration Act, it created a complex quota system that was tough to impose and took years to establish, in part due to the Bureau of Immigration’s lack of administrative capacity.98 For example, the 1924 Immigration Act required the prescreening of immigrants at embassies and consulates abroad, implementing a visa system, and deporting illegal arrivals.99 To enforce the law, Congress also created the U.S. Border Patrol. Additionally, Congress allowed Immigration Bureau agents to arrest illegal border crossers without obtaining warrants, to board and search vessels, and to access private lands within 25 miles of the border.100 Despite these powers, an estimated 175,000 illegal entries occurred annually.101 When the act went into force as it was intended to be in 1929, Congress allowed illegal immigrants who were eligible for naturalization and who were present since 1921 to regularize their status.102
The Great Depression, World War II, and Post-War Recovery: 1930–1965
The 1924 act significantly reduced the number of legal immigrants entering the United States. Five years before the act, an average of 554,920 legal immigrants arrived each year; during the five years after the act, the average number of legal immigrants arriving each year dropped to 304,182. By 1932, the inflow of legal immigrants had fallen to 35,576. Throughout the entire decade of the 1930s, legal immigration averaged 69,938 annually. The number of immigrants arriving in the United States dropped by 90 percent from 1924 to 1940. The annual immigrant inflow in 1924 was equal to 0.63 percent of the total U.S. population. By 1940, that figure had collapsed to 0.05 percent of the population.
In 1933, an Executive Order merged the Bureau of Immigration and the Bureau of Naturalization into the Immigration and Naturalization Services (INS) with the Department of Labor. As the country entered the Great Depression, Secretary of Labor William N. Doak thought that deporting illegal immigrants would create jobs for natives.103 As a result, the federal government deported more than one million Mexicans and persons of Mexican ancestry in what was euphemistically known as “repatriation,” even though approximately 60 percent of the deportees were U.S. citizens, having been born in the United States to Mexican parents.104 Despite its intended goal, the repatriation efforts increased unemployment rates for native-born Americans.105 Although Congress passed no additional significant immigration restrictions during the Great Depression, President Herbert Hoover did establish new administrative barriers by instructing immigration officials to interpret existing public charge statutes to exclude non-wealthy immigrants.106
President Franklin D. Roosevelt issued Executive Order 9066, establishing concentration and detention camps for Japanese and Germans inside the United States.
Before World War II, politicians and bureaucrats applied immigration laws selectively to meet the demands of labor unions, denaturalize and deport political activists, and prosecute criminals.107 In 1940, Congress passed the Alien Registration Act that forced noncitizens to register with the federal government, provide fingerprints, and notify the government in the event of an address change. The law also made prior involvement in the Communist, Fascist, or Nazi political parties grounds for deportation.108 In the same year, the Department of Justice took over the INS.109 Congressman Thomas F. Ford (D‑CA) noted that “the mood in the House is such that if you brought in the Ten Commandments today and asked for their repeal, and attached to that request an alien law, you could get it.”110 Under these conditions, and just two months after the United States entered into World War II, President Franklin D. Roosevelt issued Executive Order 9066, establishing concentration and detention camps for Japanese and Germans inside the United States.111
World War II Refugee Policy and Reform
Historically, the United States was a refuge for displaced persons and those fleeing persecution. These refugees included, but were not limited to, expelled British political and religious dissidents, Jews escaping the pogroms in Eastern Europe and Russia, and Europeans escaping nationalist uprisings. However, the 1920s immigration laws did not allow exceptions to the quotas for refugees.112 As Adolf Hitler rose to power in Germany in the 1930s, a refugee crisis mounted that Western countries mostly ignored or actively worsened. The lack of a humanitarian response caused the U.S. commissioner overseeing the League of Nations to resign in protest, stating, “when domestic policies threaten the demoralization and exile of hundreds of thousands of human beings, considerations of diplomatic correctness must yield to those of common humanity.”113
Even after the Nazi government indicated at a meeting of the Intergovernmental Committee on behalf of refugees that it would allow 40,000 refugees to leave with some of their assets, thus reducing the likelihood that immigrants would become a public charge, few countries were eager to accept them.114 In the United States, Congress was so indifferent to the refugee crisis that it defeated a 1939 proposal that would have facilitated the migration of 20,000 children from Nazi Germany, even though all of the children had U.S. family sponsors.115
The federal government did allow about 127,000 German Jews to enter the United States between 1933 and 1940. However, the quota for German immigrants, as set by the 1920s immigration laws, was underfilled by about 110,000 for the entirety of the 1930s.116 That many more German Jews could likely have escaped Germany before World War II if the meager quota were fully utilized. One estimate reported by author and Holocaust historian Henry L. Feingold was that 62,000 to 75,000 Jewish refugees could have left Europe between 1940 and 1942, but enforcement of the U.S. public charge rule blocked them.117 By the time World War II began in 1939, approximately three-fifths of the Jews in Germany, Austria, and Czechoslovakia had escaped, but about 250,000 to 300,000 people were still left behind.118 If the pre-1920s immigration laws had been in effect, then there is little doubt that virtually all German Jews—and many others from Eastern Europe—could have escaped to the United States before the outbreak of the war.
The voyage of the St. Louis neatly summarizes the tragedy of U.S. immigration policy. The St. Louis sailed from Europe in 1939 with 900 Jewish passengers. The Cuban government denied the ships’ passengers the ability to disembark, prompting the St. Louis to sail to the United States, where the U.S. government denied the refugees entry. Without a port to dock at, the St. Louis returned to Europe, where European countries admitted some of the refugees. Ultimately, 254 of the 900 passengers perished during the war.119 The disconnect between the actions and words of Western governments prompted Hitler to remark that “it is a shameful example to observe today how the entire democratic world dissolves in tears of pity, but then, in spite of its obvious duty to help, closes its heart to the poor, tortured people.”120
The postwar revelation of the Holocaust shamed the United States for its pre-war anti-refugee policy and generated political support for the passage of the Displaced Persons Act of 1948 and the Refugee Relief Act of 1953. These two pieces of legislation helped facilitate the post-war immigration of refugees.121 As a result of these and other provisions, the United States admitted more than a half million refugees between 1945 and 1953.122 Another motivating factor for liberalizing refugee flows after World War II was the realization that the United States could use refugee policy to increase its international prestige relative to that of the Soviet Union in order to combat Soviet propaganda.123 Congress made the first moves in this direction during World War II when it lifted the ban on Chinese immigrants and established a meager quota in 1943 to limit the effectiveness of Japanese propaganda.124
The Bracero Program
Amid World War II, the federal government instituted the Mexican Labor Program, commonly known as the Bracero Program. The Bracero Program was similar to the temporary-worker programs of 1917 and 1922 that allowed for the entry of 50,000 to 80,000 Mexican laborers.125 This program gave farmers, who faced severe labor scarcity and wage controls during the war, access to Mexican laborers under certain conditions. Along with a minimum wage standard and housing protections, the program also established terms of return for Mexican workers, who would labor in agriculture while Americans were employed in war industries or serving in the military. The Mexican government was allowed to select participants for the program.126
Some U.S. farmers refused to use the program because of the precedent it set for government control of the labor market. Other farmers hired lower-cost illegal immigrant workers. A third group paid braceros less than the mandated minimum wage.127 Enforcement remained lax, and many farmers abused bracero workers.128 Between 1942 and 1964, the Bracero Program facilitated roughly 4.5 million Mexican agricultural workers’ legal entry.129
During the Great Depression and World War II, few immigrants wanted to come to the United States illegally, and the program allowed some of those who might have otherwise come illegally to enter on a visa instead.130 During this period, immigration enforcement was performed relatively well, but it quickly broke down in the face of sustained postwar immigration flows. In 1946, an INS report recorded a massive increase in illegal entries that were “riddling the country of aliens illegally in the United States” with more illegal entries than any previous year.131 In subsequent years, reports described a steady increase in the number of illegal immigrants as “virtually an invasion.”132
Illegal immigration increased substantially in 1947 when the Bracero Program temporarily ended. This influx of illegal immigrants prompted the federal government to arrest 142,000 illegal workers between 1947 and 1949 before returning them to the border to grant them temporary work visas, a process that eventually morphed into a revamped Bracero Program.133 However, the small liberalization under the Bracero Program did not legalize the entire population of illegal workers and left two million illegal Mexican immigrants living in the American Southwest in the early 1950s.134
The federal government also responded to these inflows with two additional interrelated actions. The first was a legal reform and expansion of the bracero guest worker visa program in 1951.135 The second was Operation Wetback in 1954, an ill-conceived immigration enforcement operation that removed almost a million illegal Mexican immigrants. Between 1953 and 1954, the federal government removed or returned more than two million illegal immigrants.136 It is important to note that the government legalized many of those apprehended in Operation Wetback and gave them bracero work visas as an extension of the 1947–1949 legalization program. The government derogatorily referred to this legalization process as “drying out.”137
Some illegal immigrants took “a walk-around the statute” to gain a bracero worker visa—a process where they were driven down to the Mexican border by the INS or Border Patrol and made to take one step across the border and then immediately reenter the United States legally with a bracero work visa.138 The combination of a legal migration pathway with consequences for breaking immigration laws incentivized Mexican migrants to come legally. As a result, the number of removals in 1955 fell significantly and those who would have previously entered illegally instead signed up to become braceros.139
Before the expansion and partial deregulation of the program in 1951, employers in the Rio Grande Valley referred to the Border Patrol as a “Gestapo outfit” that wrenched their willing illegal workers away from employment.140 The INS commissioner, Joseph Swing, realized that he would have to reduce both the demand for, and supply of, illegal immigrant workers to have any hope of success, which he accomplished by telling farmers that they could hire as many legal Mexican workers as they demanded if they followed the rules.141 Farmers who did not comply were punished, but this rarely happened because compliance was easy and cheap. Commissioner Swing characterized the success as an “exchange” of illegal workers for legal guest workers.142
A Border Patrol official warned that if the Bracero Program was ever “repealed or a restriction placed on the number of Braceros allowed to enter the United States, we can look forward to a large increase in the number of illegal alien entrants into the United States.”143 After Congress canceled the program in 1964 in response to political pressure from labor unions and labor organizers, illegal immigration jumped because Congress failed to replace it with another effective lower-skilled guest worker visa program.144 By the time Congress canceled the program in 1964, regulations promulgated by the Department of Labor had whittled the number of guest-worker visas down to just 200,000.145 The department’s wage regulations and labor certification requirements raised costs for farmers and migrants, incentivizing them to move into the informal, underground economy.146 Ending the Bracero Program did not end temporary worker migration to the United States; it merely made such migration illegal.147
Shifting Perceptions and the Immigration and Nationality Act of 1952
Eugenicist, progressive, and nationalist justifications for the 1924 National Origins Act were less popular after World War II, but immigration restrictionists still hoped to achieve “the preservation of whiteness” through the immigration system.148 The 1950s McCarran Report defended the National Origin Act’s system of allocating quotas as the best way to “preserve the sociological and cultural balance of the United States.”149 Despite Truman’s veto, Congress passed the Immigration and Nationality Act of 1952. This bill increased the quota for Europeans from outside of Northern and Western Europe, granted the Department of State the ability to deny entry to those it thought would lower native wages, repealed the 1880s’ prohibitions against contract labor, and set a minimum quota of a hundred visas for immigrants from every country. The bill promoted family reunification by continuing the exemption of children and spouses of citizens from the numerical caps.150
The 1952 act introduced four preference categories, allotting 50 percent of the quota admissions to immigrants with needed skills, 30 percent to parents of adult citizens, 20 percent to the spouses and children of legal residents, and any unused green cards to the siblings and adult children of citizens.151 Further, the act created nonimmigrant visa categories that are familiar to us today, such as treaty trader or investor (E), student (F‑1), temporary worker of distinguished ability or merit (H‑1), and others.152 The bill favored Europeans, and because few wanted to immigrate at that time, many of the available visas went unused between 1952–1965.
The Immigration and Nationality Act also removed the ban on Asian immigration and many due-process safeguards that protected immigrants from deportation abuses.153 Senators Hubert Humphrey (D‑MN) and Herbert Lehman (D‑NY) lamented that the act subjected deportees to the tyranny of bureaucrats and that deportations “without hearings or findings, and without the possibility of judicial review, would be the beginning of a police state.”154 In 1958, Congress expanded its 1929 regularization provisions to illegal entrants and overstayers eligible for naturalization who had resided in the United States since 1940.
Reopening the Immigration System: 1965–2000
Between 1952 and 1960, immigration rebounded from its World War II lows and averaged 257,000 immigrants per year, but the 1960 census revealed that only 5.4 percent of the United States’ population was foreign-born.155 The Civil Rights movement and the rejection of eugenics positioned public opinion against the national quota system, laying the groundwork for reform.156
The Immigration and Nationality Act of 1965
Sen. Philip Hart (D‑MI) and Rep. Emanuel Celler (D‑NY) championed the Immigration and Nationality Act of 1965, which would end the national quota system and replace it entirely with a preference system for immigrants from the Eastern Hemisphere.157 The 1965 act created categories of immigrants that included the unmarried and married sons and daughters of U.S. citizens; siblings of U.S. citizens; spouses and unmarried sons and daughters of green card holders; members of the professions that include, but are not limited to, architects, engineers, lawyers, physicians, surgeons, and teachers; scientists and artists of exceptional ability; skilled and unskilled workers in occupations for which labor was in short supply; and some refugees.158 Congress set aside 74 percent of the available green cards for family members, 20 percent for workers, and 6 percent for refugees.159
Early versions of the Immigration and Nationality Act of 1965 allocated fewer green cards for family members and more for workers. Those who supported the national origins system and opposed non-European immigration pushed for the expanded family-based immigration system to maintain European favoritism in the law. Rep. Michael Feighan (D‑OH) introduced amendments that would set aside 74 percent of the 1965 act’s green cards for family members because he believed that the current stock of European-American immigrants would use them to create and maintain ties to Europe.160 He did not anticipate, however, that Latin Americans and Asians would be the primary beneficiaries.
As with the 1921, 1924, and 1952 acts, the 1965 Immigration and Nationality (Hart-Celler) Act did not count spouses, minor children, or the parents of U.S. citizens over the age of 21 against the numerical cap.161 The bill also mandated that employment-based immigrants must receive certification from the Department of Labor that “the employment of such aliens will not adversely affect the wages and working conditions of the workers in the United States similarly employed.”162 Prior to the 1965 act, the government had to demonstrate that a new worker would depress American citizens’ wages in order to deny the new worker a visa, but the new bill put the onus on the applicant to show that no adverse effect would result—this was a substantial burden shift that increased visa denial rates.163
Further provisions of the 1965 Immigration and Nationality Act limited immigration from both hemispheres to 290,000 annually—170,000 for the Eastern Hemisphere and 120,000 for the Western Hemisphere.164 The act limited immigration from any individual country in the Eastern Hemisphere to 20,000 annually. By 1976, this provision also applied to Western Hemisphere countries.165 Lastly, the act extended the administrative amnesty of 1929 to those who were illegally present in 1948, legalizing about 44,106 illegal immigrants by 1981.166
Related Read
Free to Move: Foot Voting, Migration, and Political Freedom
Immigration policy is the most debated and controversial issue of our time. Across the developed world, political parties have greatly diverged on this issue. In Europe, political parties with a nativist bent have won elections and governed in coalition with other mainstream parties. But even mainstream parties, such as the Danish Social Democrats, have adopted anti‐immigration platforms as they adapt to the opinions of voters skeptical of immigration—and have maintained power as a result.
Under the new system, the number of immigrants from the Western Hemisphere increased because the family-reunification portions of immigration law expanded chain migration from Latin America.167 Moreover, the 1965 act did not replace the Bracero Program with another functional guest worker program, all but guaranteeing an increase in illegal migration.168 Demographically, the removal of racial restrictions significantly increased the number of Asian immigrants and slightly increased the number of Hispanic immigrants. Geographically, Florida, California, New York, Texas, Illinois, and New Jersey received the bulk of new immigrants.169
In 1968, Sen. Edward M. Kennedy (D‑MA) secured the federal government’s agreement to the 1967 United Nations Protocol Relating to the Status of Refugees.170 From 1967 to 1980, waves of refugees fleeing communism arrived in the United States through a mixture of special legislative remedies and presidential parole power. Congress replaced this ad hoc system with a formal admission process in the Refugee Act of 1980. This bill restricted the use of presidential parole, temporarily raised the refugee limits from 17,600 to 50,000, and established a new category for asylum seekers. The bill mandated that the president, in consultation with Congress, determine the number of future refugees admitted annually. Moreover, this bill amended the Immigration and Nationality Act to conform with the 1967 United Nations Protocol Relating to the Status of Refugees, recognizing individuals with certain characteristics as refugees. From 1980 to 2000, the federal government accepted an average of 97,000 refugees per year.171
Legal immigration expanded in the wake of the 1965 act. Between 1966 and 1980, the average annual number of immigrants increased by roughly 150,000, compared to the yearly averages between 1952 and 1965. By 1980, 6.2 percent of the 226 million U.S. population was foreign-born, and 524,295 immigrants entered legally that year.172 The number of illegal immigrants also grew, in part, because the 1965 act did not create a way for lower-skilled workers to enter the country and legally work. Estimates suggest that there were 28 million illegal immigrant entries to the United States from 1965 to 1986; these were offset by 23.4 million departures, yielding a net difference of about 4.6 million over 21 years.173
The Immigration Reform and Control Act
The influx of illegal immigrants forged a contentious political alliance between Democrats who were interested in amnesty for illegal immigrants and Republicans who wanted to end illegal immigration. This overlap allowed Sen. Alan K. Simpson (R‑WY) and Rep. Romano Mazzoli (D‑KY) to submit immigration reform bills based on policy recommendations made by the 1980 Select Commission on Immigration and Refugee Policy. Despite being delayed by political posturing, a transmuted version of the bill, called the Immigration Reform and Control Act (IRCA), passed in 1986.174
This act consisted of two main components: amnesty for illegal immigrants who had lived continuously in the country since January 1, 1982; and penalties for employers who willingly hired illegal immigrants. The bill granted roughly three million illegal immigrants amnesty and created 109 new INS offices to enforce immigration laws.175 The act slightly lowered illegal immigrant wages, but failed to dim the wage magnet entirely because employer sanctions incentivized illegal immigrant workers to purchase fake documents on the black market, to steal identity documents, and to borrow valid documents from those with legal work authorization.176
The legalization component of the law did succeed, however, as immigrants earned green cards and saw substantial wage gains in the years after legalization.177 The IRCA also attempted to deregulate and expand low-skilled guest worker visas, but it had virtually no effect on migration. Ultimately, IRCA did not create a way for future low-skilled migrants from Mexico and Central America to enter lawfully. And although IRCA boosted the number of Border Patrol agents along the southwest border to roughly 3,350 agents by 1988, illegal immigration nevertheless increased.
The Anti-Drug Abuse Act of 1988 created a category of offenses called aggravated felonies that subjected noncitizens to deportation after completing their prison sentence.178 Although the bill defined aggravated felonies as murder, drug trafficking, and illicit trafficking in arms, Congress has since increased the number of crimes that are considered aggravated felonies. By 2016, more than 30 types of offenses were deemed aggravated felonies, including minor crimes with a sentence of one year or more.179 An aggravated felony conviction subjects a noncitizen to deportation, removes all possibility of deportation relief, and bans them from the United States for life, even if the immigrant committed the crime before it was considered an aggravated felony.180
The Reforms of the 1990s
Legal immigration flows surpassed one million in 1989, the first time since 1914.181 By 1990, the immigrant stock was 19.8 million, accounting for 7.9 percent of the U.S. population.182 In 1960, 84 percent of the U.S. foreign-born population in the United States were either from Europe or Canada—in 1990, about 7 percent of green cards were issued to those from Europe, 22 percent to those from Asia, and 59 percent to those from either Mexico, Central America, or South America.183 Legislation was partially responsible for the change in origin regions, but much of the shift was due to economic development globally. Whereas Europe and Canada were wealthy regions relative to the rest of the world, developing nations were wealthy enough that their citizens could emigrate, but not yet wealthy enough to entice them to stay.
Following on the expansion of legal immigration after 1968, Congress passed the Immigration Act of 1990 to liberalize the immigration of skilled workers and increased the number of green cards issued annually to 675,000.184 Similar to earlier legislation, the law allowed immediate relatives—children, spouses, and parents of U.S. citizens—and a few other classes of immigrants to immigrate outside the direct numerical limits. It provided, at minimum, another 226,000 green cards for family reunification and 140,000 green cards to employment-based immigrants divided among five preference categories. The 1990 act also raised the annual per country ceilings to 7 percent (25,620) of the total familial and employment-based allowance. Lastly, the Immigration Act of 1990 added and reformed nonimmigrant visas for skilled workers, such as the H‑1B visa for skilled workers in specialty occupations and the O‑1 visa for individuals with extraordinary ability or achievement.
Finally, the bill allocated 55,000 immigration visas to a Diversity Visa program that awarded visas to nationals from countries with low levels of immigration to the United States. Despite the program’s name, Congress created it not to increase immigrants flows from Africa and Asia but rather Ireland. Congressmen began to realize that the 1965 reforms, which allocated the majority of green cards on a family reunification basis, favored recent non-European immigrants over others. The program was an attempt to accommodate these newly disfavored European immigrants.
Unsurprisingly, given congressional intent and a temporary allocation of 40 percent of the diversity visas to the Irish, in 1994 almost all diversity visa recipients were from European countries.185 From 1995 to 2000, an average of 42 percent of diversity visas were issued to European countries, but over time the composition of recipients shifted.186 In 2016, the percent of diversity visas issued to European countries fell to 24 percent, while the percent of diversity visas issued to Africans and Asians increased to 40 percent and 31 percent, respectively.187
Despite the 1990 act, the illegal immigrant population increased from about 3.5 million in 1990 to 5.7 million in 1995.188 Restrictionists argued that immigrants had negative economic effects, failed to assimilate culturally, used an abundance of welfare, and amplified the perceptions of lawlessness and social chaos along the border with Mexico caused by illegal immigration.189 Restrictionists also introduced a new argument based on a relatively new concern regarding immigrants’ supposed environmental damage.
Politicians and activists of the era hashed out many immigration debates at the state level, California Propositions 187 and 227 being the two most well-known examples.190 The former curtailed welfare for illegal immigrants and required every state employee to report suspected illegal immigrants to the INS, while the latter eliminated bilingual education in public schools.191 Both passed by wide margins. At the federal level, the Clinton administration attempted to reduce illegal immigration administratively via border operations such as Operation Hold the Line in 1993 and Operation Gatekeeper in 1994.
In the same vein, Congress passed the Antiterrorism and Effective Death Penalty Act and the Illegal Immigration Reform and Immigrant Responsibility Act in 1996. These bills increased the penalties for illegal entry, created mandatory detention for many classes of noncitizens, and expedited deportation procedures for certain cases. The bills also limited judicial review of certain types of deportations and allowed secret evidence in removal proceedings for noncitizens accused of terrorist activity.192 Additionally, the Illegal Immigration Reform and Immigrant Responsibility Act increased the interior deportation apparatus in the United States and prevented illegal immigrants from using the legal system to earn a green card through the so-called three-and-ten-year bars, which prevented illegally present immigrants who leave the United States from legally returning for any reason, thus guaranteeing that the number of illegal immigrants would grow more rapidly than in the pre-IRCA period.193
Congress also passed the Personal Responsibility and Work Opportunity Reconciliation Act. The act made most noncitizens ineligible for means-tested welfare, authorized the states to deny providing welfare such as Medicaid to immigrants, and delayed the possibility to receive welfare for most immigrants for five years.194 While initially impactful, the act became less effective as the federal government rolled backed some of its welfare restrictions and states started providing social services to ineligible immigrants.
By 1997, the number of Border Patrol agents along the southwest border increased to 6,315—roughly double the number who were employed in 1987. The additional enforcement measures increased the cost of crossing the border illegally, increased illegal immigrants’ use of smugglers, inflated smugglers’ fees, and decreased the incentive for illegal immigrants to return home after successfully entering the United States.195
Immigration Policy in the 21st Century: 2000–2020
In 2000, Republican presidential candidate George W. Bush appealed to Hispanic voters by supporting expanded legal immigration and legalization for illegal immigrants, a lesson he learned after winning two gubernatorial elections in Texas.196 Bush’s pro-immigration tactic in Texas was at odds with that of California Republican Governor Pete Wilson, who devastated his party’s popularity among Hispanic voters.197 The Bush administration hoped to create a large guest worker program and legalize illegal immigrants even after the 9/11 attacks.
Congress passed the USA Patriot Act shortly after the 9/11 attacks. The Patriot Act reduced the rights of immigrants by expanding deportation powers to suspected terrorists and allowed the attorney general to detain aliens without charge or recourse to due process.198 In 2002, after the INS issued visa extensions to two of the deceased 9/11 terrorists, Congress passed the Homeland Security Act, which consolidated 22 federal departments and agencies into the new Department of Homeland Security.199 This act moved many federal agencies that were responsible for immigration enforcement under the department’s purview and restructured them as Customs and Border Protection, Immigration and Customs Enforcement, and Citizenship and Immigration Services.
During Bush’s terms in office, he signed both the Enhanced Border Security and Visa Entry Reform Act of 2002 and the Secure Fence Act of 2006, and renewed the USA Patriot Act. These laws reaffirmed the government’s power to detain immigrants without trial, authorized about 850 miles of fencing along the southwest border, and expanded the size of the Border Patrol.200 Congressional actions also increased nonimmigrant visa security screening through reforming or implementing various programs, such as the Automated Biometric Identification System, the Student and Exchange Visitor Information System, and the Electronic System for Travel Authorization.201
On the nonsecurity side of immigration, Congress passed the H‑1B Visa Reform Act of 2004, which provided 20,000 additional H‑1B visas to high-skilled temporary workers with advanced degrees from American universities. This act came only four years after Congress passed the American Competitiveness in the Twenty-First Century Act in 2000, which temporarily raised the annual H‑1B cap and permanently exempted universities and nonprofit research institutions from the visa cap. In 2006, the Republican-led Senate passed the Comprehensive Immigration Reform Act, which, among other things, would have legalized illegal immigrants and expanded legal immigration, but the House of Representatives did not ratify the act. Similar bills also died in the Senate in 2007 and 2008.
The Pew Research Center estimated that the illegal immigration population peaked at 12.2 million in 2007, and the issue moved to the forefront of the 2008 presidential election. Democratic presidential candidate Barack Obama ran on a platform of increased employer sanctions and earned legalization for noncriminal immigrants. His Republican opponent John McCain, who had recently helped write the failed 2007 immigration bill, supported comprehensive immigration reform.202 After Obama’s victory, Congress reintroduced the DREAM Act in 2009 to legalize many illegal immigrants who entered the country as children, but it ultimately failed in the Senate after passing in the House of Representatives.203
In 2012, Obama announced the Deferred Action for Childhood Arrivals program (DACA), which granted a two-year work permit and a reprieve from deportation to illegal immigrants who met many of the latest DREAM Act requirements.204 By the 2012 presidential election, Republican presidential candidate Mitt Romney rejected a pathway to citizenship, opposed DACA, and argued that strict enforcement of existing laws would lead to illegal immigrants’ self-deportation.205 Conversely, Obama continued to support comprehensive immigration reform and the targeted deportation of illegal immigrants.206 Obama’s administration removed more illegal immigrants than any other administration, earning him the nickname “Deporter-in-Chief.”207 Obama removed 1,242,486 illegal immigrants from the interior of the United States during his full eight years, averaging 155,311 removals per year. President George W. Bush removed 819,964 illegal immigrants from the interior of the United States during the last six years of his administration, equal to an average of 136,661 removals per year. Estimating the number of illegal immigrants deported in 2001 and 2002, based on those deported during the 2003–2006 period, shows that Bush’s administration would have deported 1,000,653 illegal immigrants from the interior of the United States, with an annual average of 125,082. In comparison, President Trump only managed to remove 325,660 people from the interior of the United States during his entire term in office. On average, Trump removed an average of 81,415 illegal immigrants per year (Figure 3).208

In 2013, eight senators—including John McCain (R‑AZ), Charles Schumer (D‑NY), and Lindsey Graham (R‑SC)—introduced the Border Security, Economic Opportunity, and Immigration Modernization Act, colloquially known as the “Gang of Eight” Bill. This bill proposed a myriad of immigration reforms. Among these were that it allowed many illegal immigrants to obtain Registered Provisional Immigration status, which would eventually permit them to naturalize. It also created a W visa program that provided temporary work visas for less-skilled immigrants. The bill exempted the family of immigrants who obtained employment-based green cards from the numerical cap, established a merit-based system for admitting low-skilled and high-skilled workers, and ended the diversity visa program. Congressional Budget Office estimates indicated that the bill would decrease the federal deficit, increase legal immigration, and reduce illegal immigration.209 However, despite passing the Senate 68 to 32, the bill languished and died in the House.
In 2014, Obama issued the Immigration Accountability Executive Action, which granted three years of temporary revocable relief and work authorization to four to five million illegal immigrants by expanding DACA to cover the parents of U.S. citizens. This order increased and redirected enforcement resources to the southern border. The memo also prioritized deportation for “national security threats, serious criminals, and recent border crossers.”210 The executive action altered administrative procedures to allow visa processing for illegal immigrant spouses of U.S. citizens without their needing to leave the country, help high-skilled workers on H1‑B visas to change their jobs easier, and reduce barriers to the immigration of foreign-born entrepreneurs. The courts blocked Obama’s executive action in late 2014, and in 2016 the Supreme Court deadlocked at a 4–4 decision, thereby defaulting to the lower court’s decision.211
By 2016, the illegal population receded to 10.7 million, and in 2016 there were 17,000 Border Patrol agents and 654 miles of primary fencing on the southwest border.212 During the 2016 presidential elections, immigration became a focal point. Democratic presidential candidate Sen. Bernie Sanders (I‑VT) criticized open borders as “a Koch brothers’ proposal.”213 Sanders acknowledged that a liberal U.S. immigration policy would improve immigrants’ well-being, but stated that his first obligation was to U.S. children, whom he argued would be injured by immigration. Republican presidential candidate Donald Trump said that he would “put America first” by denying entry to immigrants who, he argued, take Americans jobs, commit crimes, and represent national security threats.214
Trump won the Republican nomination—beating Republicans who held more traditional positions on immigration—by calling for a wall on the southern border, ending birthright citizenship, banning Muslim entry into the United States, and terminating DACA.215 Conversely, the Democratic presidential nominee, Hillary Clinton, advocated for almost the opposite approach. Instead of increased enforcement, Clinton promised that, in her first 100 days, she would introduce comprehensive immigration reform, defend DACA, and expand the Affordable Care Act subsidies to all immigrants.216
Upon taking office, Trump issued multiple executive orders to stop the issuance of visas to immigrants and nonimmigrants from several mostly Muslim majority countries based on the assertion that they would be detrimental to national security.217 The Trump administration also halted DACA and lent support to the RAISE Act in 2017, which would have cut legal immigration by half.218 There was little congressional action on immigration under the Trump administration, but various federal agencies utilized the regulatory state in order to reduce legal immigration.219 For example, the Department of Justice and the Department of Homeland Security have attempted to expand immigration enforcement both in the interior of the United States and along the border. Similarly, the Citizenship and Immigration Services issued a final rule that altered the public charge grounds of inadmissibility, which could substantially reduce the number of new green cards issued.220 Trump campaigned on building a wall across the length of the southern border. Regardless of Trump’s efforts, the number of lawful permanent residents entering the United States had not declined much by the end of 2019.
Trump issued his largest immigration executive actions in the wake of the COVID-19 pandemic and the ensuing recession. In April 2020, Trump practically ended the issuance of green cards to people abroad, which usually accounts for about half of new green cards issued annually. In the last six months of the 2020 fiscal year (April to September) the federal government only issued about 29,000 green cards. During the same period in 2016, it had issued approximately 309,000 green cards. Compared to the last half of 2016, the number of green cards issued in the last half of the 2020 fiscal year fell by 90.5 percent (Figure 4).221 During the period from January 2017 to February 2020, the average number of green cards issued per month to immigrants abroad was down about 0.5 percent under Trump compared to the January 2013 to February 2016 period under Obama, with cumulative numbers down just over 3.2 percent.222 In other words, Trump’s lasting impact on the issuance of green cards to immigrants abroad was very small prior to his COVID-19 executive orders.

As with immigrant visas, Trump greatly reduced the issuance of nonimmigrant visas (NIVs) in response to the recession and the COVID-19 pandemic (Figure 5). In the last six months of the 2020 fiscal year (April to September), the federal government issued 397,596 NIVs. In the same period in 2016 during Obama’s last full year in office, it issued more than 5.6 million NIVs. Compared with the last half of the 2016 fiscal year, the number of nonimmigrant visas issued in the last half of the 2020 fiscal year fell by almost 93 percent.223 During the period from January 2017 to February 2020, before the COVID-19 pandemic, the average number of monthly NIVs issued was down about 12 percent under Trump compared to the January 2013 to February 2016 period under Obama, and the cumulative numbers were down by just over 14 percent. Beginning in mid to late March, the Trump administration virtually halted the issuance of NIVs to people abroad. Comparing the decline in the number of visas issued abroad under Trump through November 2020 with the second term of the Obama administration, Trump reduced the number of green cards issued by approximately 418,453 and the number of NIVs by about 11,178,668. That’s roughly an 18 percent decline in the number of green cards issued abroad and approximately a 28 percent decline in the number of NIVs compared to Obama’s second term. The COVID‐19–related restrictions were the most severe and impactful immigration policies adopted by the Trump administration.224
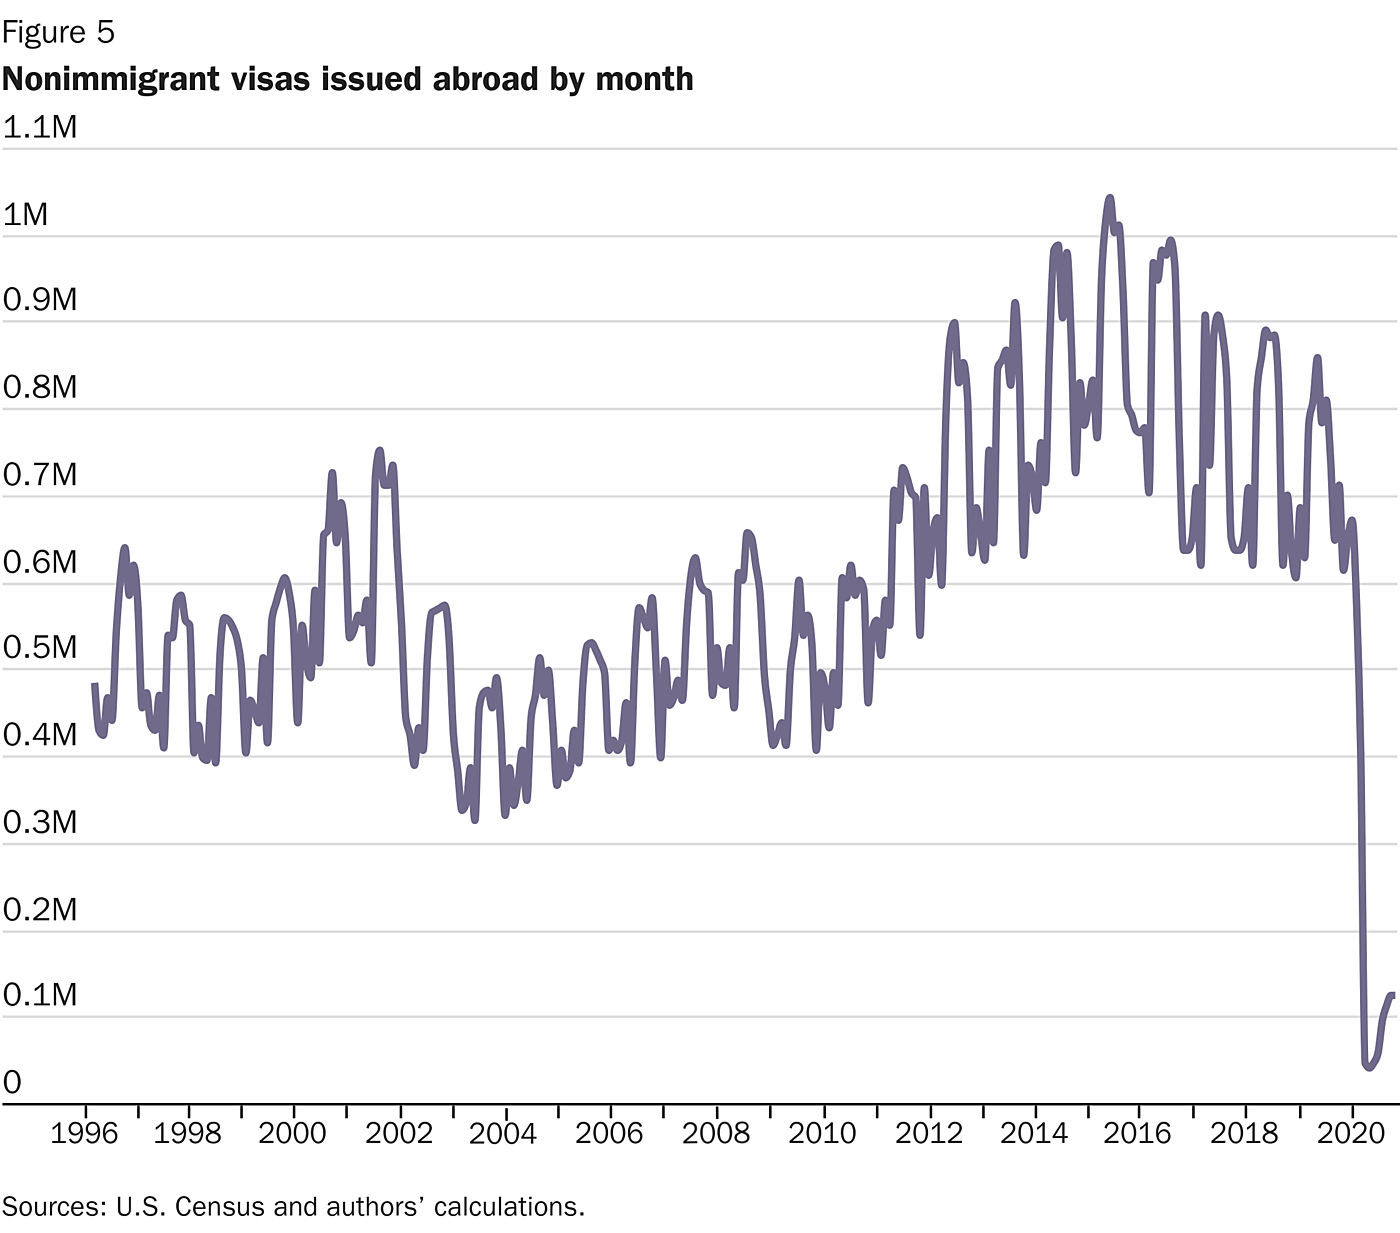
Refugee admissions sharply declined during the Trump administration, from 84,995 in 2016 to a mere 11,841 in 2020.225 This decline was precipitous and occurred annually due to Trump’s orders. Under the Refugee Act of 1980, the president sets worldwide and regional refugee numbers. In every year, Trump cut the numbers and refugee admissions fell. Trump’s control over legal immigration and the reduced number of refugee admissions exposed just how much power the executive branch of government has over immigration.226 Congress has given an enormous amount of power to the president to set immigration policy. The biggest institutional change in immigration policy is that Congress’ importance is shrinking while the executive branch’s power is growing. How this will affect future immigration policy and the political debate over the issue remains to be seen.
Conclusion
In 2019, the United States issued just over one million green cards. Of these green cards, 63 percent were based on familial relationships (81 percent of which went to immediate family relatives of U.S. citizens and green card holders); 5 percent were based on employment; and the remainder were based on various humanitarian concerns or the diversity green card lottery.227 More than half of those obtaining a green card were adjustments of status, meaning that they were already in the United States, as opposed to new arrivals from abroad. The demand to immigrate to the United States, combined with numerical limits and per country caps on family and employment-based migration, has created a backlog of individuals who have been approved for green cards but who are not yet able to receive them. As of 2019, roughly one million foreign workers and family members were awaiting their employment-based green cards in the United States, while another 3.6 million prospective immigrants were awaiting their immigration visas.228 For immigrants from some countries, such as those from India, this means that they will not receive their employment-based green cards for roughly a decade.229
While estimates of the size of the illegal immigrant population continue to fall, the demand for nonimmigrant visas continues to rise.230 In 2018, the Department of State issued nearly 196,409 H‑2A visas for temporary agricultural workers, compared with the 11,004 visas it issued in 1996. Similarly, the issuance of H‑2B visas for temporary nonagricultural workers has grown significantly, increasing from 12,200 in 1996 to 97,623 in 2018.231 Demand for high-skilled workers has been so high “that the annual H‑1B cap was reached within the first five business days on eight occasions” between 2008 and 2020.232 Since the academic year 2008–2009, more than 600,000 international students have enrolled in American academic institutions each year, and many of those students have been unable to obtain green cards, given the current numerical constraints.233
Overall, the U.S. immigration system remains fragmented as of early 2021. Relative to a system that prioritizes economic contributions and creates pathways for immigrants to work in the United States legally, the current system constrains economic growth. Path dependency and politics preserve the status quo and make it difficult to reach consensus on immigration, despite seemingly straightforward opportunities to harness prospective immigrants’ desire to live and work in the United States. Although regulatory changes can generate meaningful improvements to the United States immigration system, congressional reform is likely necessary to replace the patchwork of current immigration policies with a coherent system that channels the constructive powers of immigration rather than disrupting them.
Citation
Baxter, Andrew M., and Alex Nowrasteh. “A Brief History of U.S. Immigration Policy from the Colonial Period to the Present Day,” Policy Analysis no. 919, Cato Institute, Washington, DC, August 3, 2021. https://doi.org/10.36009/PA.919.

About the Authors


This work is licensed under a Creative Commons Attribution-NonCommercial-ShareAlike 4.0 International License.