The Trump administration reportedly is considering a plan this week to restrict or ban foreign students from working after graduation from U.S. universities. Under Optional Practical Training (OPT), foreign students can study for at least one year after receiving their degrees. Foreign students in Science, Technology, Engineering, or Math fields can extend OPT for another two years.
The plan is supposedly to benefit unemployed Americans—almost none of whom work in the relevant fields—after states reopen for business. The program is the main on-ramp for American companies to recruit and retain foreign talent in the United States. Gutting it would harm U.S. workers by undermining the very companies that would employ them.
What is the OPT?
The U.S. government has allowed foreign students to “engage in some version of OPT during their studies or on a temporary basis after the completion of their studies” since 1947. The core component of OPT is that it is “optional” or recommended rather than required by the school to graduate. The original regulation that created OPT allowed foreign student to seek jobs “where employment for practical training is required or recommended by the school.”
While it did not explicitly discuss the ability to work after graduation, immigration or other court decisions as well as subsequent regulations make it clear that this was also permitted and happening. In 1991, the government split OPT into pre-completion and post-completion authorization and permitted only a single year of post-completion OPT “directly related to his or her area of studies.”
What is STEM OPT?
In 2008, the Department of Homeland Security (DHS) permitted extensions of OPT for Science, Technology, Engineering, or Math (STEM) graduates of U.S. universities for up to 17 months because the “ability of U.S. high-tech employers to retain skilled technical workers, rather than losing such workers to foreign business, is an important economic interest for the United States.” In 2016, DHS extended the period to 24 months, allowing for a 3‑year period of total post-graduation employment. The 2016 rule requires employers hiring a worker on a STEM OPT extension to attest that the worker is not replacing a U.S. worker and will receive similar pay to the employer’s similarly situated U.S. workers. DHS can conduct an on-site audit to review employer records to confirm the accuracy of these attestations.
How many foreign students apply for OPT?
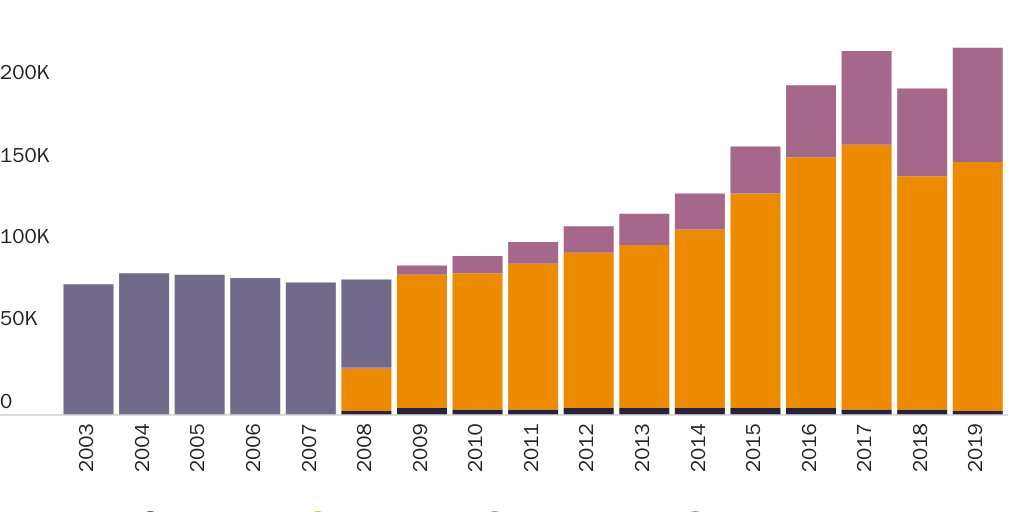
In fiscal year 2019, U.S. Citizenship and Immigration Services (USCIS) approved 223,284 requests for Employment Authorization Documents (EADs) for all types of OPT—the highest number ever. Nearly all approvals were for post-graduate OPT—either regular OPT (152,029) or STEM (69,353). Figure 1 shows that the numbers of approved EADs has nearly tripled from less than 80,000 in 2003 to more than 223,000 in 2019—nearly all of this growth occurred during the Obama administration from FY 2009 to partway through FY 2017. STEM OPT accounts for almost half the growth.
How many OPT recipients are employed?
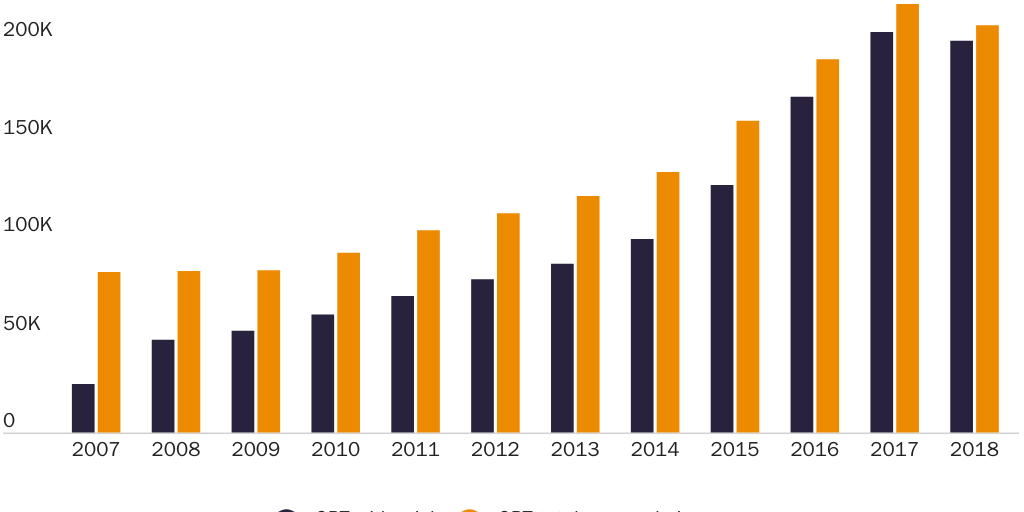
Not all OPT recipients find jobs, but a much greater share are finding them than in the recent past. Unfortunately, an exact comparison between the share with and without jobs is not available, but Figure 2 compares OPT approvals to OPT participants with jobs. In 2007, there were more than 3 approvals for each participant with a job. By 2018, the ratio was nearly 1:1. Overall, 200,162 OPT participants had jobs in 2018.
What countries do OPT participants come from?
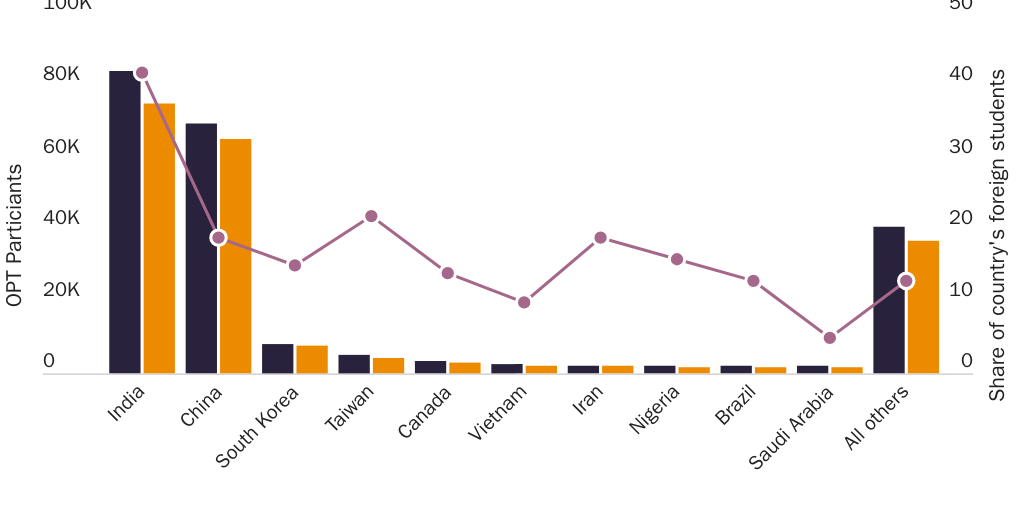
In 2018, two thirds of OPT participants came from India and China, according to the Institute of International Education (IIE). IIE—with the sponsorship of the U.S. Department of State—conducts a survey of international students including those with OPT. It shows that an astounding 42 percent of Indian international students are currently enrolled in OPT (Figure 3). That share is well over double the rest of the world. The difference can be partly attributed to the difficulties that Indians have obtaining employment‐based green cards compared to the rest of the world. They end up using OPT to maintain status in the United States, while other nationalities can simply adjust to permanent residence.
IIE doesn’t report data specifically on STEM OPT, but Immigration and Customs Enforcement data show that again, India represents 59 percent of all STEM OPT participants, and 40 percent of Indian STEM students are involved in OPT—by far the highest share of any nationality with more than 2 participants. It also shows that the United States risks losing nearly half a million STEM students if the government rescinded OPT.
What companies employ OPT participants?
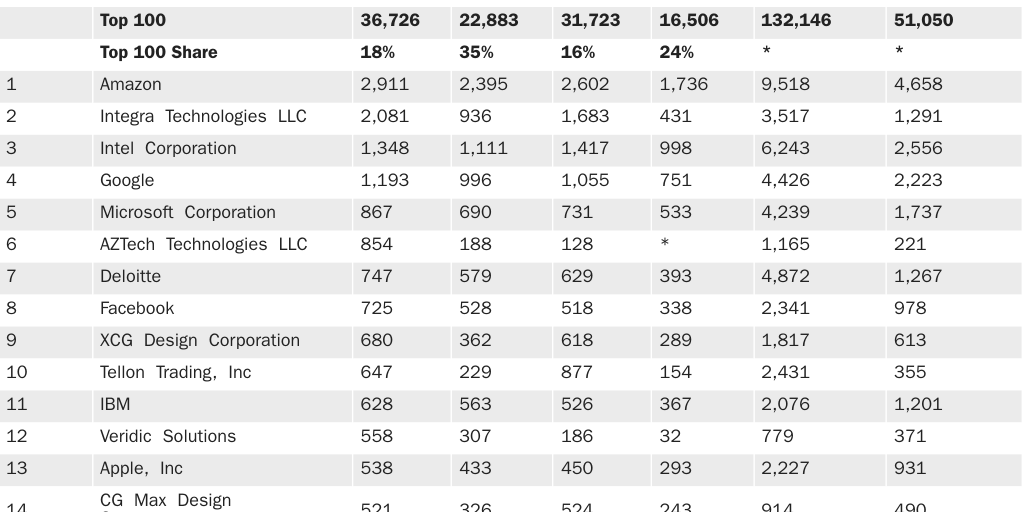
Table 2 displays the top 100 companies for OPT hires in 2018 and 2017 as well as the entire period from 2003 to 2018. The largest OPT employer with 2,911 OPT employees was Amazon, which makes most of its hires under the STEM OPT program. Other technology companies—Integra, Intel, Google, and Microsoft—fill out the top 5 with more than 1,000 employees each. The Top 100 companies make 18 percent of OPT hires. Under the H‑1B program, the Top 100 employers make 35 percent of H‑1B hires. This disparity is compatible with previous research concluding that OPT is more common among startups than the more expensive, complex, and bureaucratic H‑1B program.
What industries do OPT participants work in?
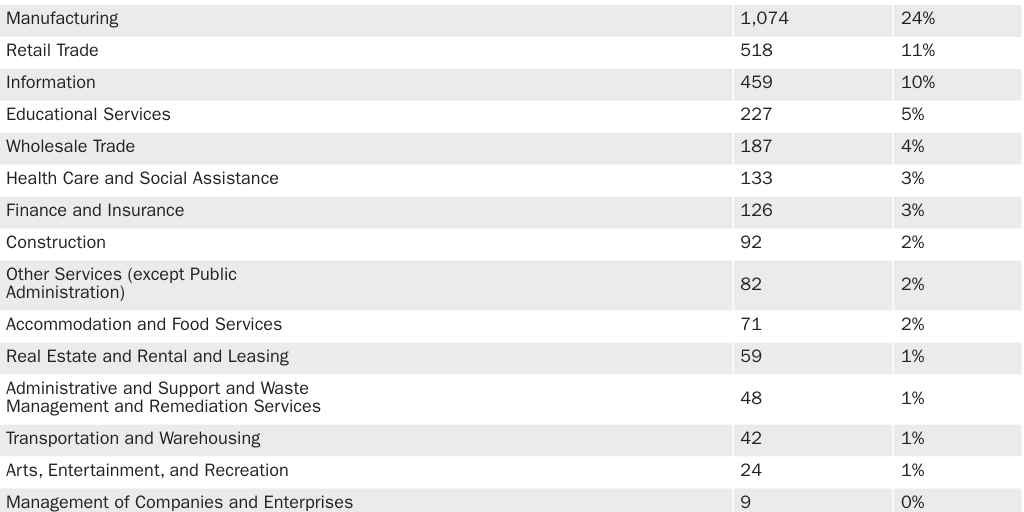
While exact statistics for the entire OPT population is unavailable, the Department of Labor reports that 30 percent of student visa holders with college degrees sponsored by employers for permanent residence (mainly OPT participants) in FY 2019 were offered jobs in professional, scientific, or technical services, such as custom computer programming, computer systems design, and research and development into biotechnology. Another 24 percent were employed in the manufacturing sector, mainly semiconductors and other electronic components (Table 3).
What occupations do OPT participants work in?
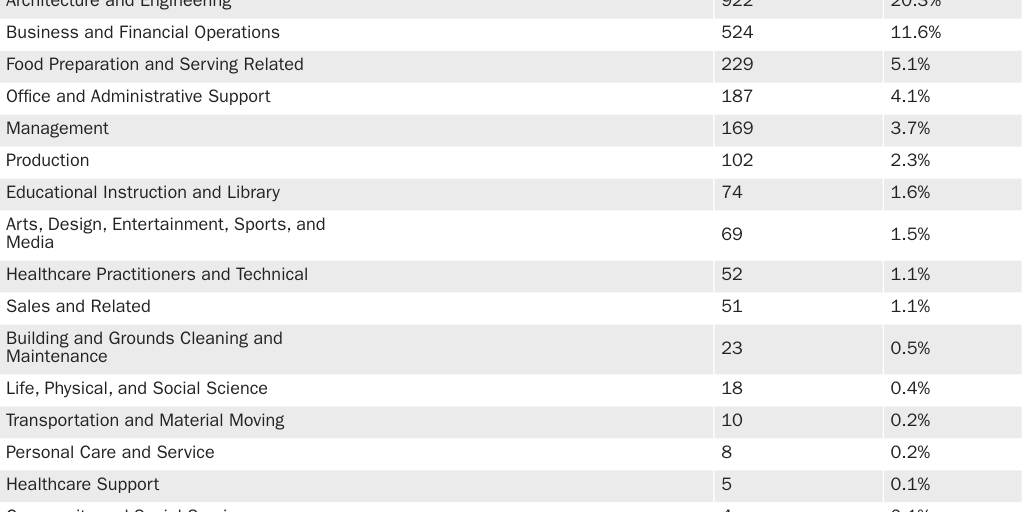
Again, exact statistics for the entire OPT population is unavailable, but the Department of Labor reports that 46 percent of student visa holders with a college degree or above sponsored by employers for permanent residence were offered computer and math jobs (Table 4), mainly software developers. Another 20 percent were in architecture and engineering (mainly non-computer electronics engineers) followed by almost 12 percent in business and finance with market research analysts and accountants being the most common.
How has COVID-19 affected OPT occupations?
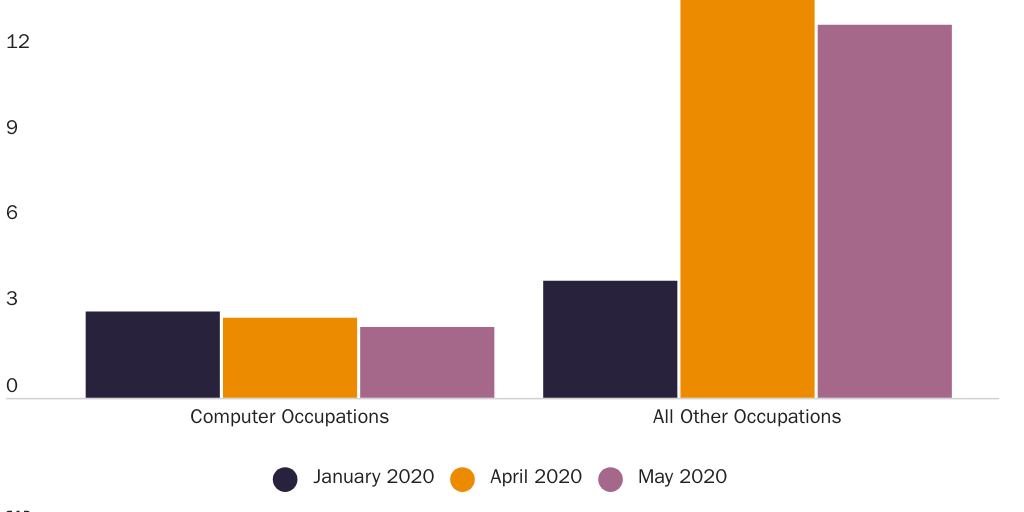
As Stuart Anderson first noticed, the computer jobs that are the most common jobs among OPT students have remained entirely unscathed by the recent economic downturn. The unemployment rate for computer had actually declined since January (Figure 4). Anderson comments that this positive employment situation “makes citing unemployment in these occupations as a reason for new restrictions on H‑1B visas and international students on OPT more dubious.” The downward trend continued in May.
What are the wages of OPT workers?
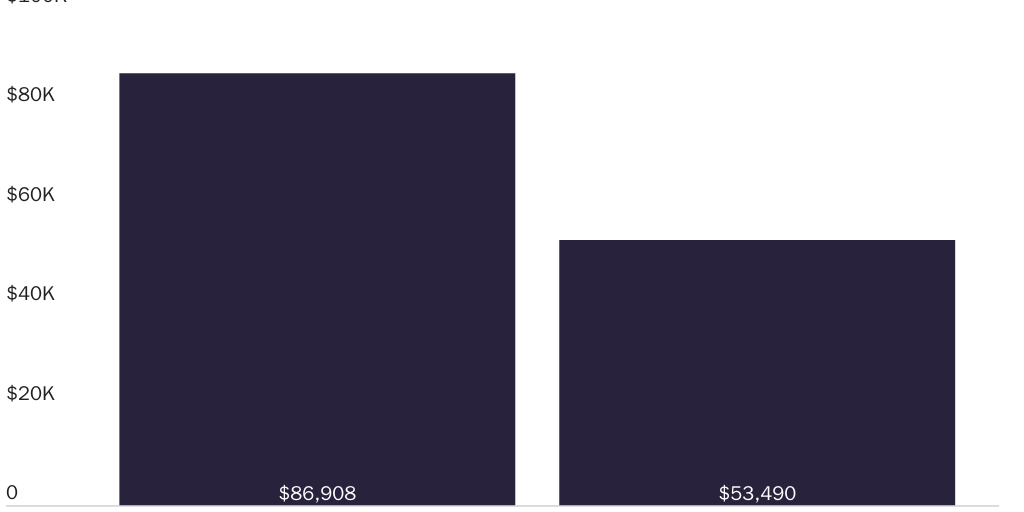
Again, exact figures for the entire OPT population are not available, but the Department of Labor reports that college graduates in student visa status who were sponsored by employers for permanent residence averaged a wage offer of $86,908 in FY 2019. That was significantly higher than the average wage for all U.S. workers that year (Figure 5). These wages imply that if OPT were implemented, it would contract the economy by more than $17.4 billion annually.
What does research say about OPT?
Business Roundtable and the Interindustry Forecasting Project at the University of Maryland found that “scaling back OPT would cause the unemployment rate to rise 0.15 percentage points by 2028.” In 2019, economist Madeline Zavodny found that “A larger number of foreign students approved for OPT, relative to the number of U.S. workers, is associated with a lower unemployment rate among those U.S. workers.” In March 2019, Jeremy Neufeld used OPT data to conclude that “higher levels of OPT participants in a region lead to increased innovation in that region, as measured by the number of patents, higher average earnings among the college educated. In addition, it finds no evidence of adverse effects on average earnings, unemployment, or labor force participation.”
Stuart Anderson has also found that 39 percent of Nobel Prizes in chemistry, medicine, and physics since 2000 have been immigrants to the United States. International students dominate the STEM majors. NFAP has also found that in 2015, more than three quarters of the graduate students in electrical engineering, petroleum engineering, computer science, and industrial engineering were international students. A majority of the graduate students in pharmaceutical sciences and chemical engineering—two majors of particular interest today—were also foreign-born. In 2018, NFAP found that nearly a quarter of American startups valued at $1 billion or more had a founder who entered the Untied States as an international student, which had created 1,200 jobs per company. Michelle Zatlyn, co-founder of Cloudflare, and Ashifi Gogo, founder of Sproxil, both used OPT to launch their businesses.
In 2008, the Department of Homeland Security (DHS) when it launched STEM OPT concluded that the expansion was a national security necessity. “With their large and growing populations of STEM-graduate scientists, high-tech industries in [Russia, China, and India] and others in the OECD now compete much more effectively against the U.S. high technology industry.” It notes that China and India had 31 percent of global R&D staff up from 3.2 percent in 1990. It would be strange for the department to reverse itself completely a decade later, even as the underlying trends continue.
-Post updated 6/17/2020 to provide more details about the OPT program.
